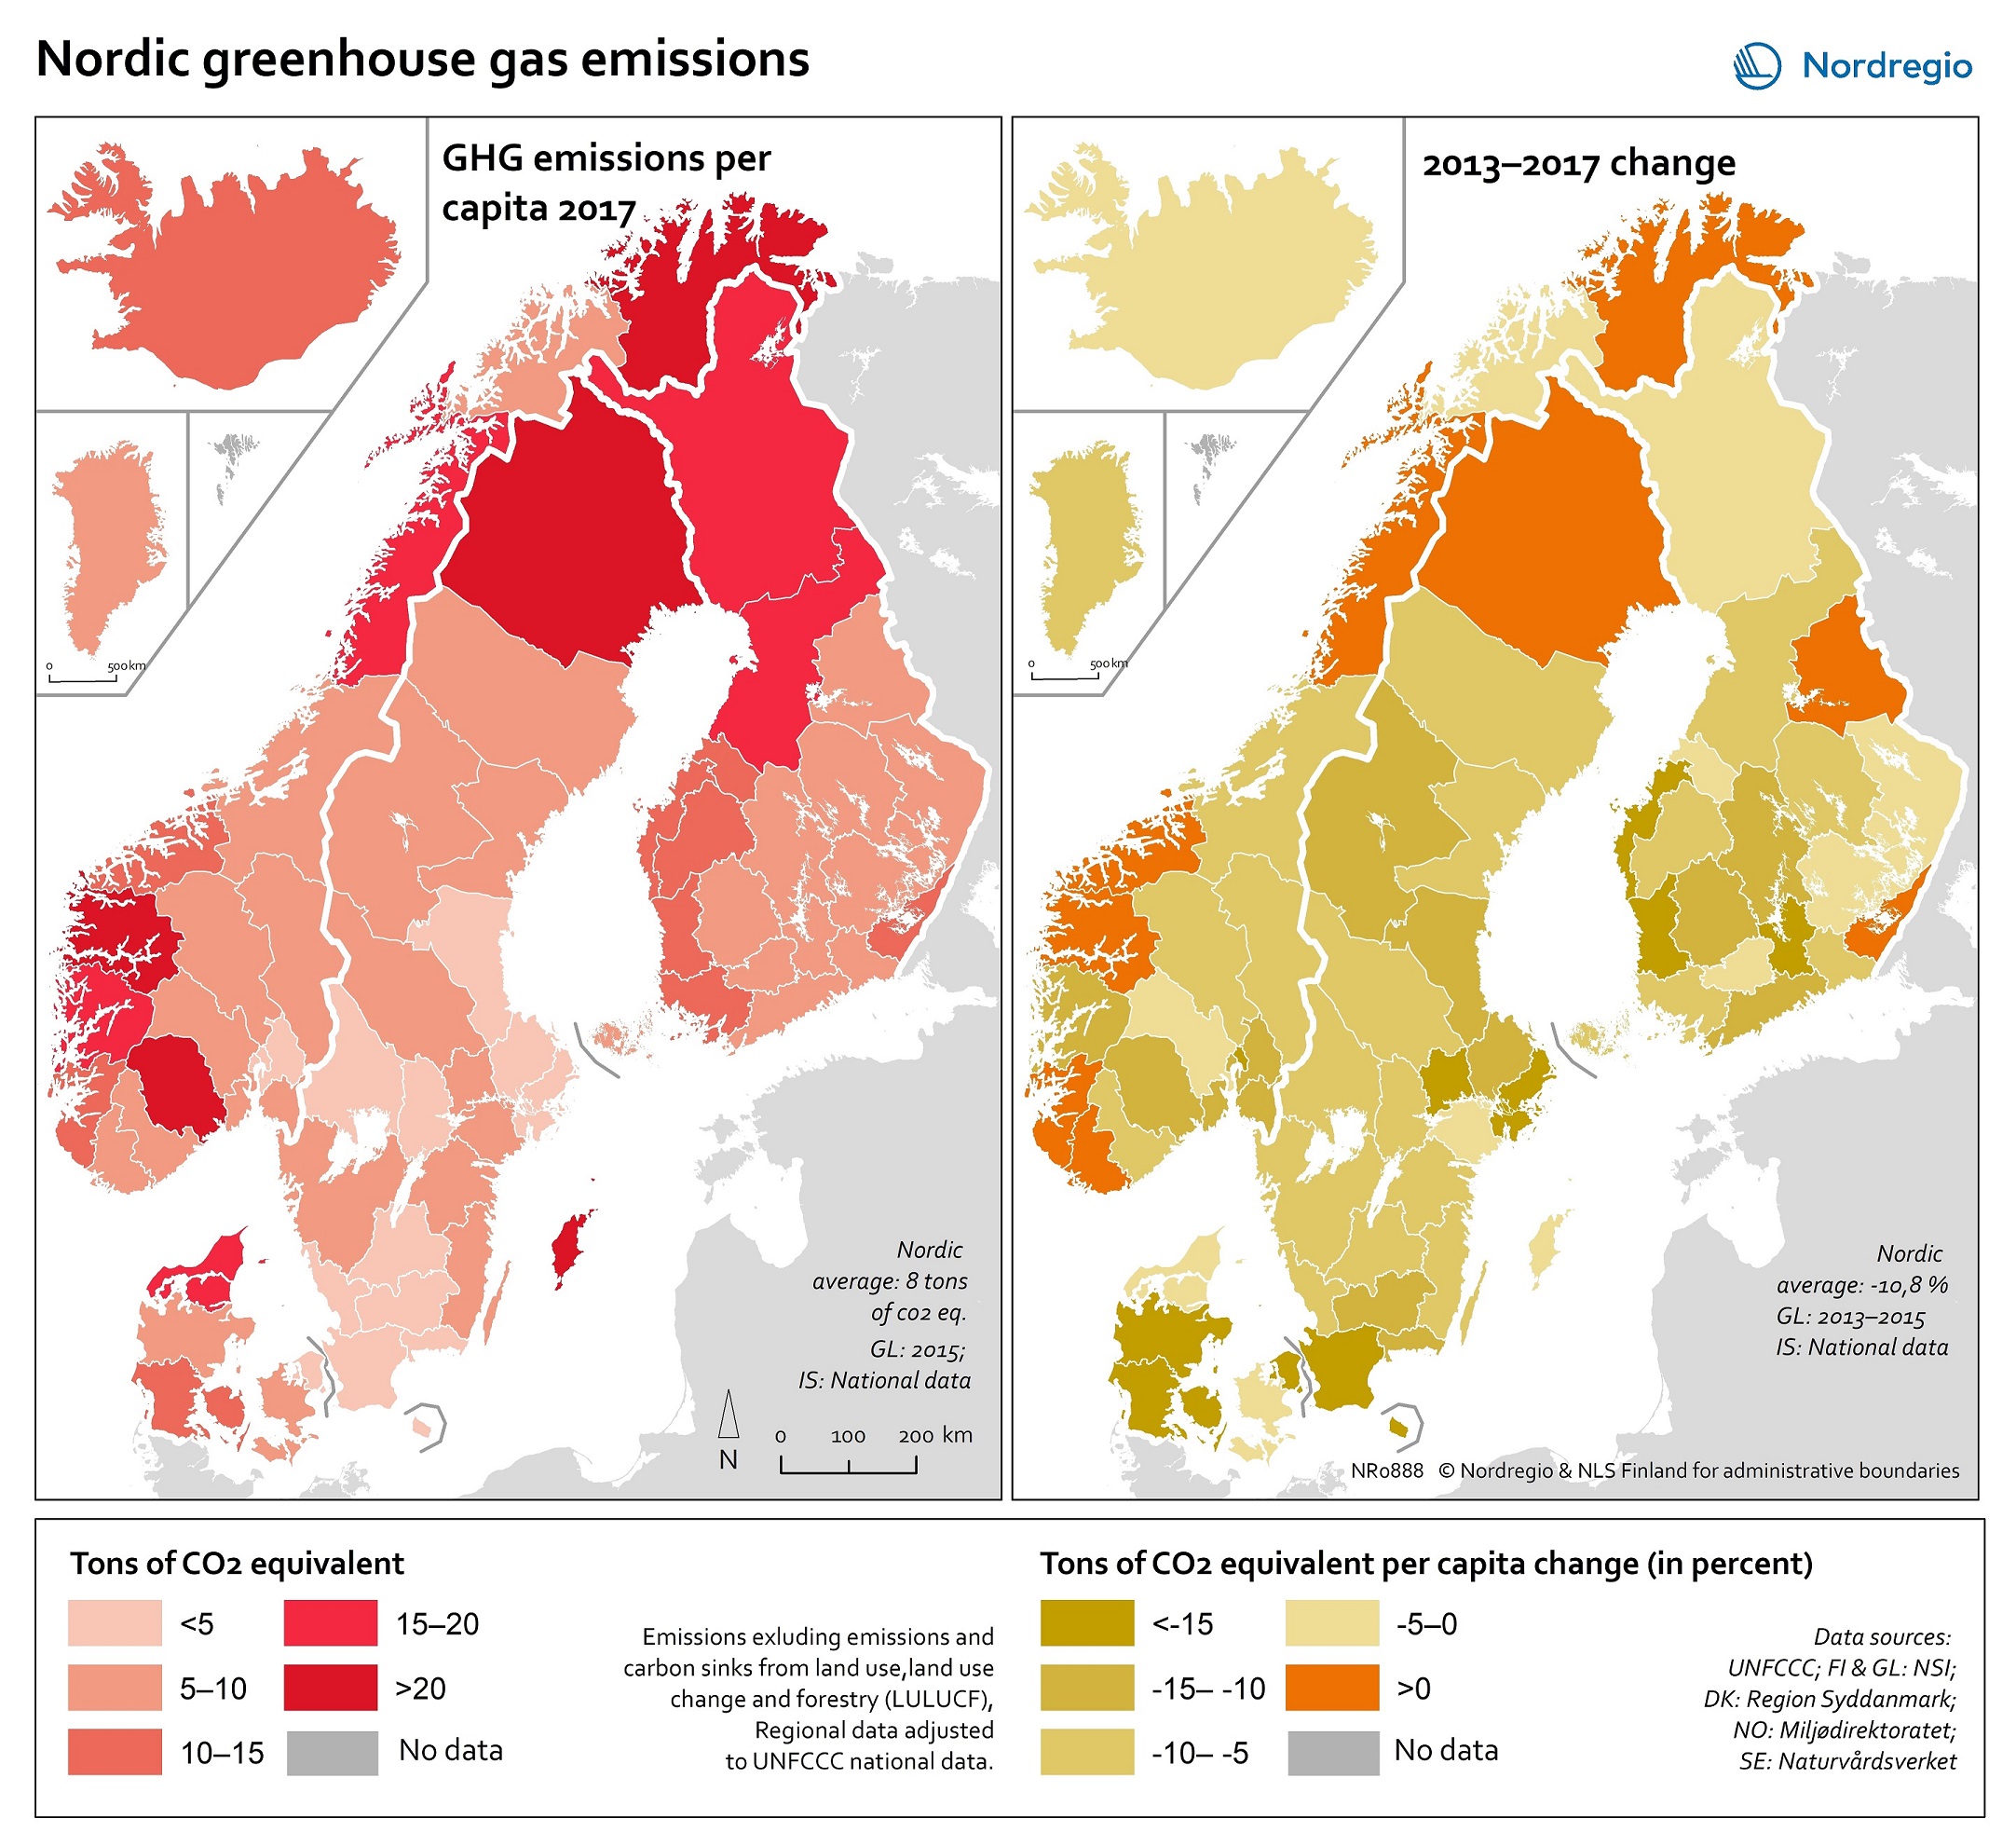
These maps show greenhouse gas emissions per capita in 2017 (left) and per capita change between 2013 and 2017 (right)
Emissions have seen significant reductions in areas where heat and power have traditionally been fossil fuel dependent. This includes Denmark as well as Southern Sweden and Southern Finland; relatively populous areas where improvements in district heating coverage and carbon intensity reduction has been achieved. Emissions are increasing in regions where energy-intensive industry is present. This includes many Norwegian regions with intensive offshore oil and gas activity but also Norrbotten, Sweden as a result of intensive industries in the iron & steel sector.
Regions with per capita increase during 2013-2017 are coloured orange, while regions showing a reduction are indicated with shades of yellow depending on the change magnitude.
Read the digital publication here.