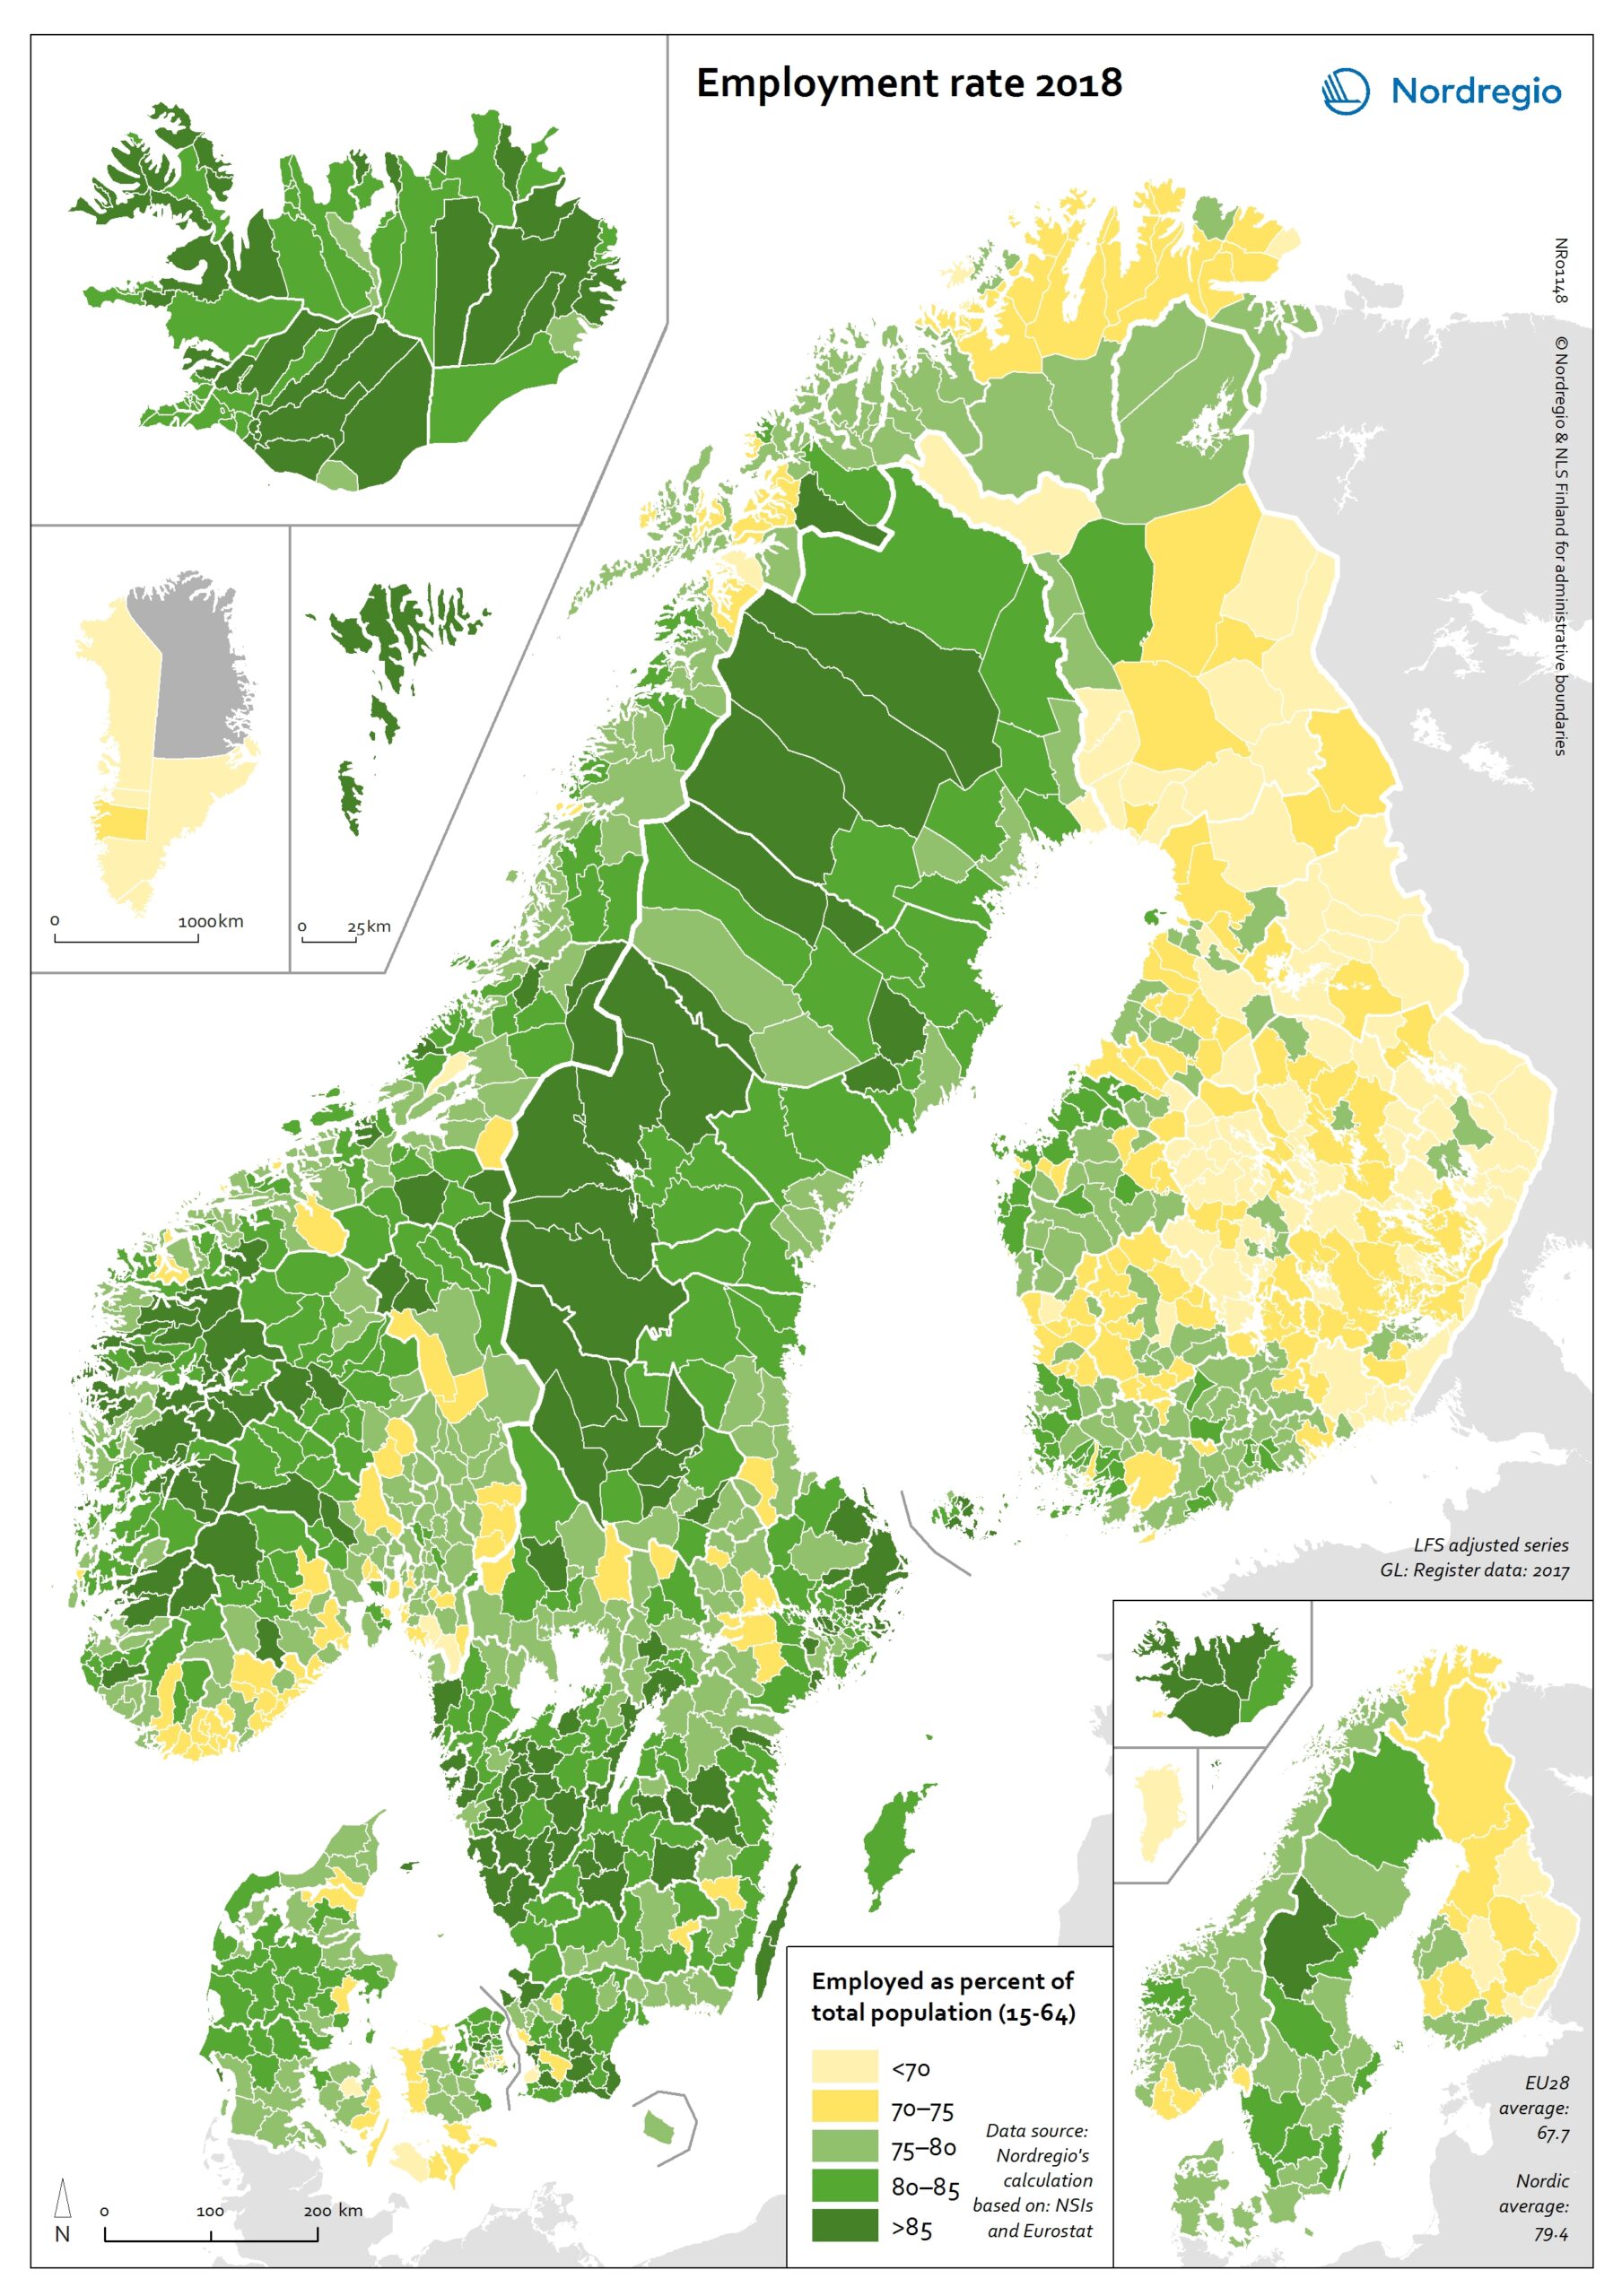
This map shows the employment rate at the municipal and regional level in 2018
Full employment is one of the cornerstones of what is known as the Nordic model and, historically, the Nordic countries have enjoyed comparably high employment rates, particularly for women and older workers. The employment rate measures the number of people in work as a proportion of the working-age population (aged 15–64) as a whole.
The green tones indicate municipalities with employment rates above 75% in 2018, with the darker green representing higher employment rate. The yellow tones indicate municipalities with employment rates below 75% in 2016. The light-yellow colour indicates municipalities with employment rates below 70% in 2018.
The average Nordic employment rate was 79.4% in 2018, considerably higher than the EU28 average of 67.7%. In recent years, and in line with a growing economy, the employment rate has increased throughout the Nordic Region. It is still the lowest in Finland and Greenland, although the increase in Finland between 2016 and 2018 was faster than the Nordic average.
The employment rate is highest in the Faroe Islands and many of the smaller municipalities in Iceland, Norway and Sweden. Most of the municipalities in the local labour market area (LLMA) of Stockholm, as well as municipalities in the LLMAs of Copenhagen (e.g. Gentofte, Vallensbæk, Tårnby, Lyngby-Taarbæk and Greve) and Reykjavik (Hafnarfjörður, Mosfellsbær, Garðabær, Kópavogur) have employment rates above 80%. All 30 of the municipalities with the lowest employment rates are in Finland or Greenland. The lowest rates are in Puolanda, Paltamo and Suomussalmi in Kainuu, Finland.
Read the digital publication here.