Nordregio is an international research institute established by the Nordic Council of Ministers

20 June, 2017

Asylum seekers by municipality in March 2017

The distribution of refugees is of growing interest in the Nordic Region due to both unprecedented in-flows of migrants, and demographic challenges relating to depopulation in many rural areas. Rural municipalities are increasingly recognising the important contributions these newcomers can make to local communities and are pursuing policies that encouraging them to stay.

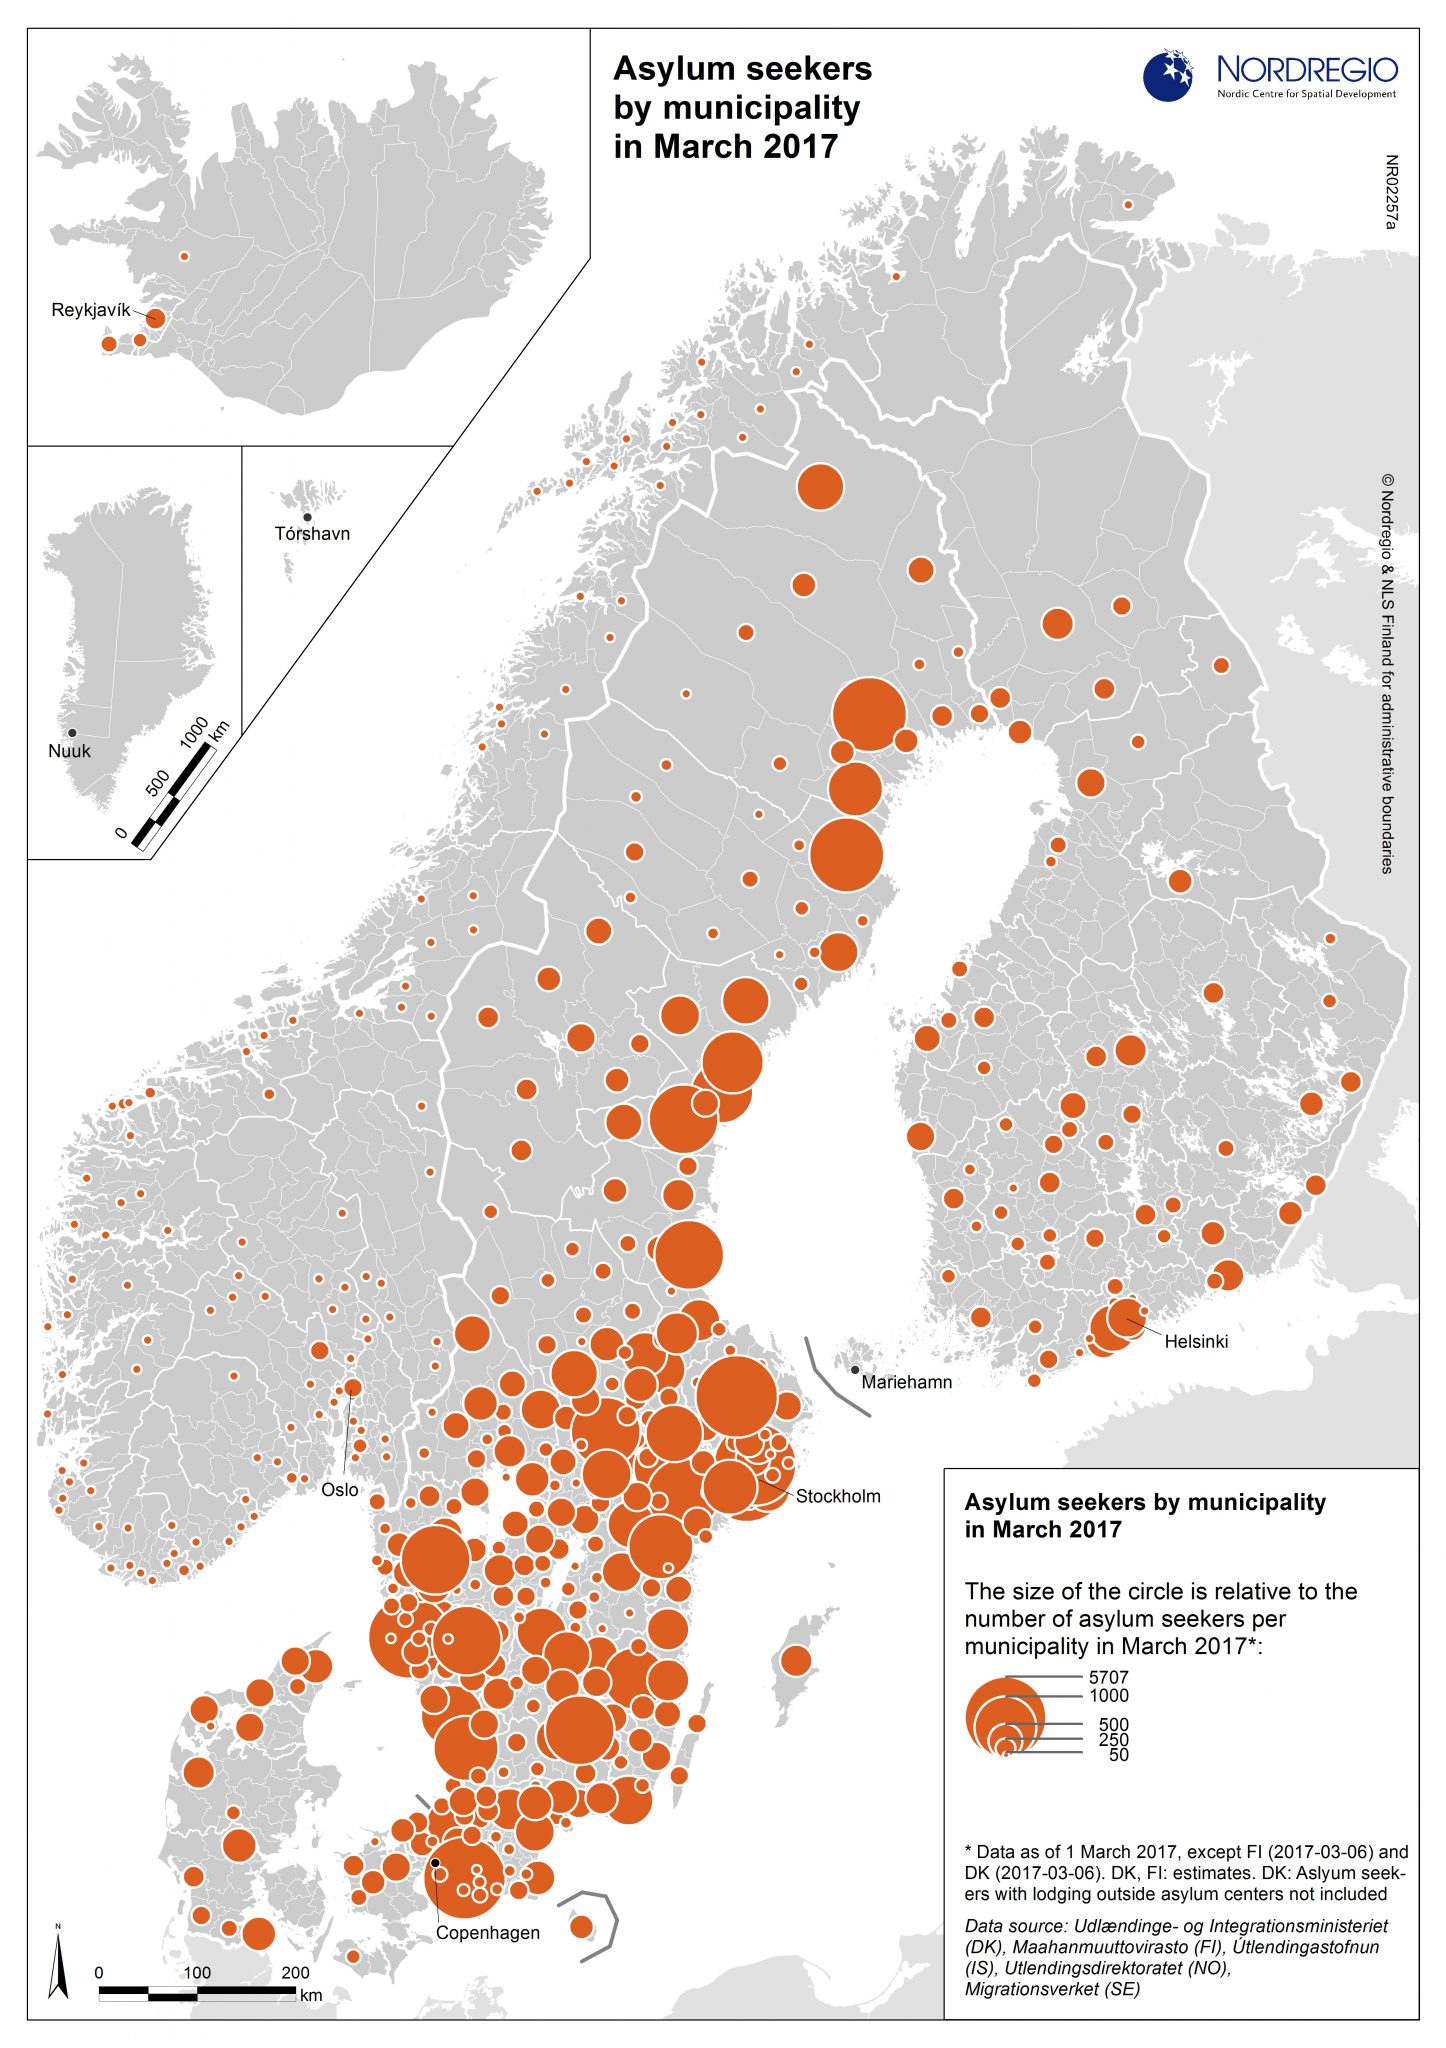
The map shows that, in March 2017, a large portion of the asylum seekers in the Nordic Region were housed in Sweden. In fact, the 35 Nordic municipalities hosting the largest number of asylum seekers in March 2017 were all in Sweden, housing between 760 and 5707 asylum seekers each. It is worth noting that the municipalities housing the largest number of asylum seekers are not necessarily those which are the largest numbers in the context of the population, for example, several municipalities along the coast of Norrland.

The map also highlights the spatial consequences of different national policies regarding the housing of asylum seekers. For example, in Sweden, although each asylum seeker has the right to settle in any municipality, each municipality is required to host asylum seekers resulting in distribution across the country. In Finland and, even more so, in Denmark (particularly in peripheral municipalities in north-western Jutland and on the island of Bornholm), municipalities with asylum centres host the majority of the country’s asylum seekers. A similar case is evident in Iceland, with asylum seekers confined to municipalities in or close to the capital region where Iceland’s asylum centres are located. In Norway, on the other hand, the number of municipalities hosting asylum centres is larger than in Denmark and Finland, but each host a significantly smaller number of asylum seekers.

Map Facts

This map shows the number of asylum seekers per municipality, for the Nordic Region in March 2017.

The circles indicate the number of asylum seekers per municipality during a specific date in March 2017 (1 March for Iceland, Norway and Sweden; 6 March for Finland; 31 March for Denmark). As such, this map provides a snap-shot of the situation on that particular day.

In Greenland and the Faroe Islands, immigration and border control, including handling of asylum applications, is administered by the Danish Government. Data for Greenland and the Faroe Islands was not available for this map.

Asylum seekers are not included in official population statistics until after their application is accepted (at which point the become residents). It should be noted that figures relating to the location of asylum seekers are subject to rapid change, particularly in countries where most asylum seekers are found in reception centres (e.g. Denmark and Finland).

Map id: 02257a

Designer/Cartographer
Linus Rispling

Data source
Udlændinge- og Integrationsministeriet (DK), Maahanmuuttovirasto (FI), Útlendingastofnun (IS), Utlendingsdirektoratet (NO), Migrationsverket (SE)

Published 20 June 2017

Terms of use

All images are the property of Nordregio. They may be freely used as long as the logo of Nordregio is clearly visible and the source is cited accordingly. Please give also the cartographer/designer/author credit and give full recognition to the data sources if named in the graphic.

If you have any questions, contact us:

Email: maps@nordregio.org

Phone: + 46 8 463 54 00

Source: Nordregio at www.nordregio.org