The map shows the share of people at risk of poverty in 2024. The at-risk-of-poverty rate is a common way of measuring of inequality. Persons at risk of poverty are considered those who have an equivalised disposable income below 60% of the national median equivalised disposable income.
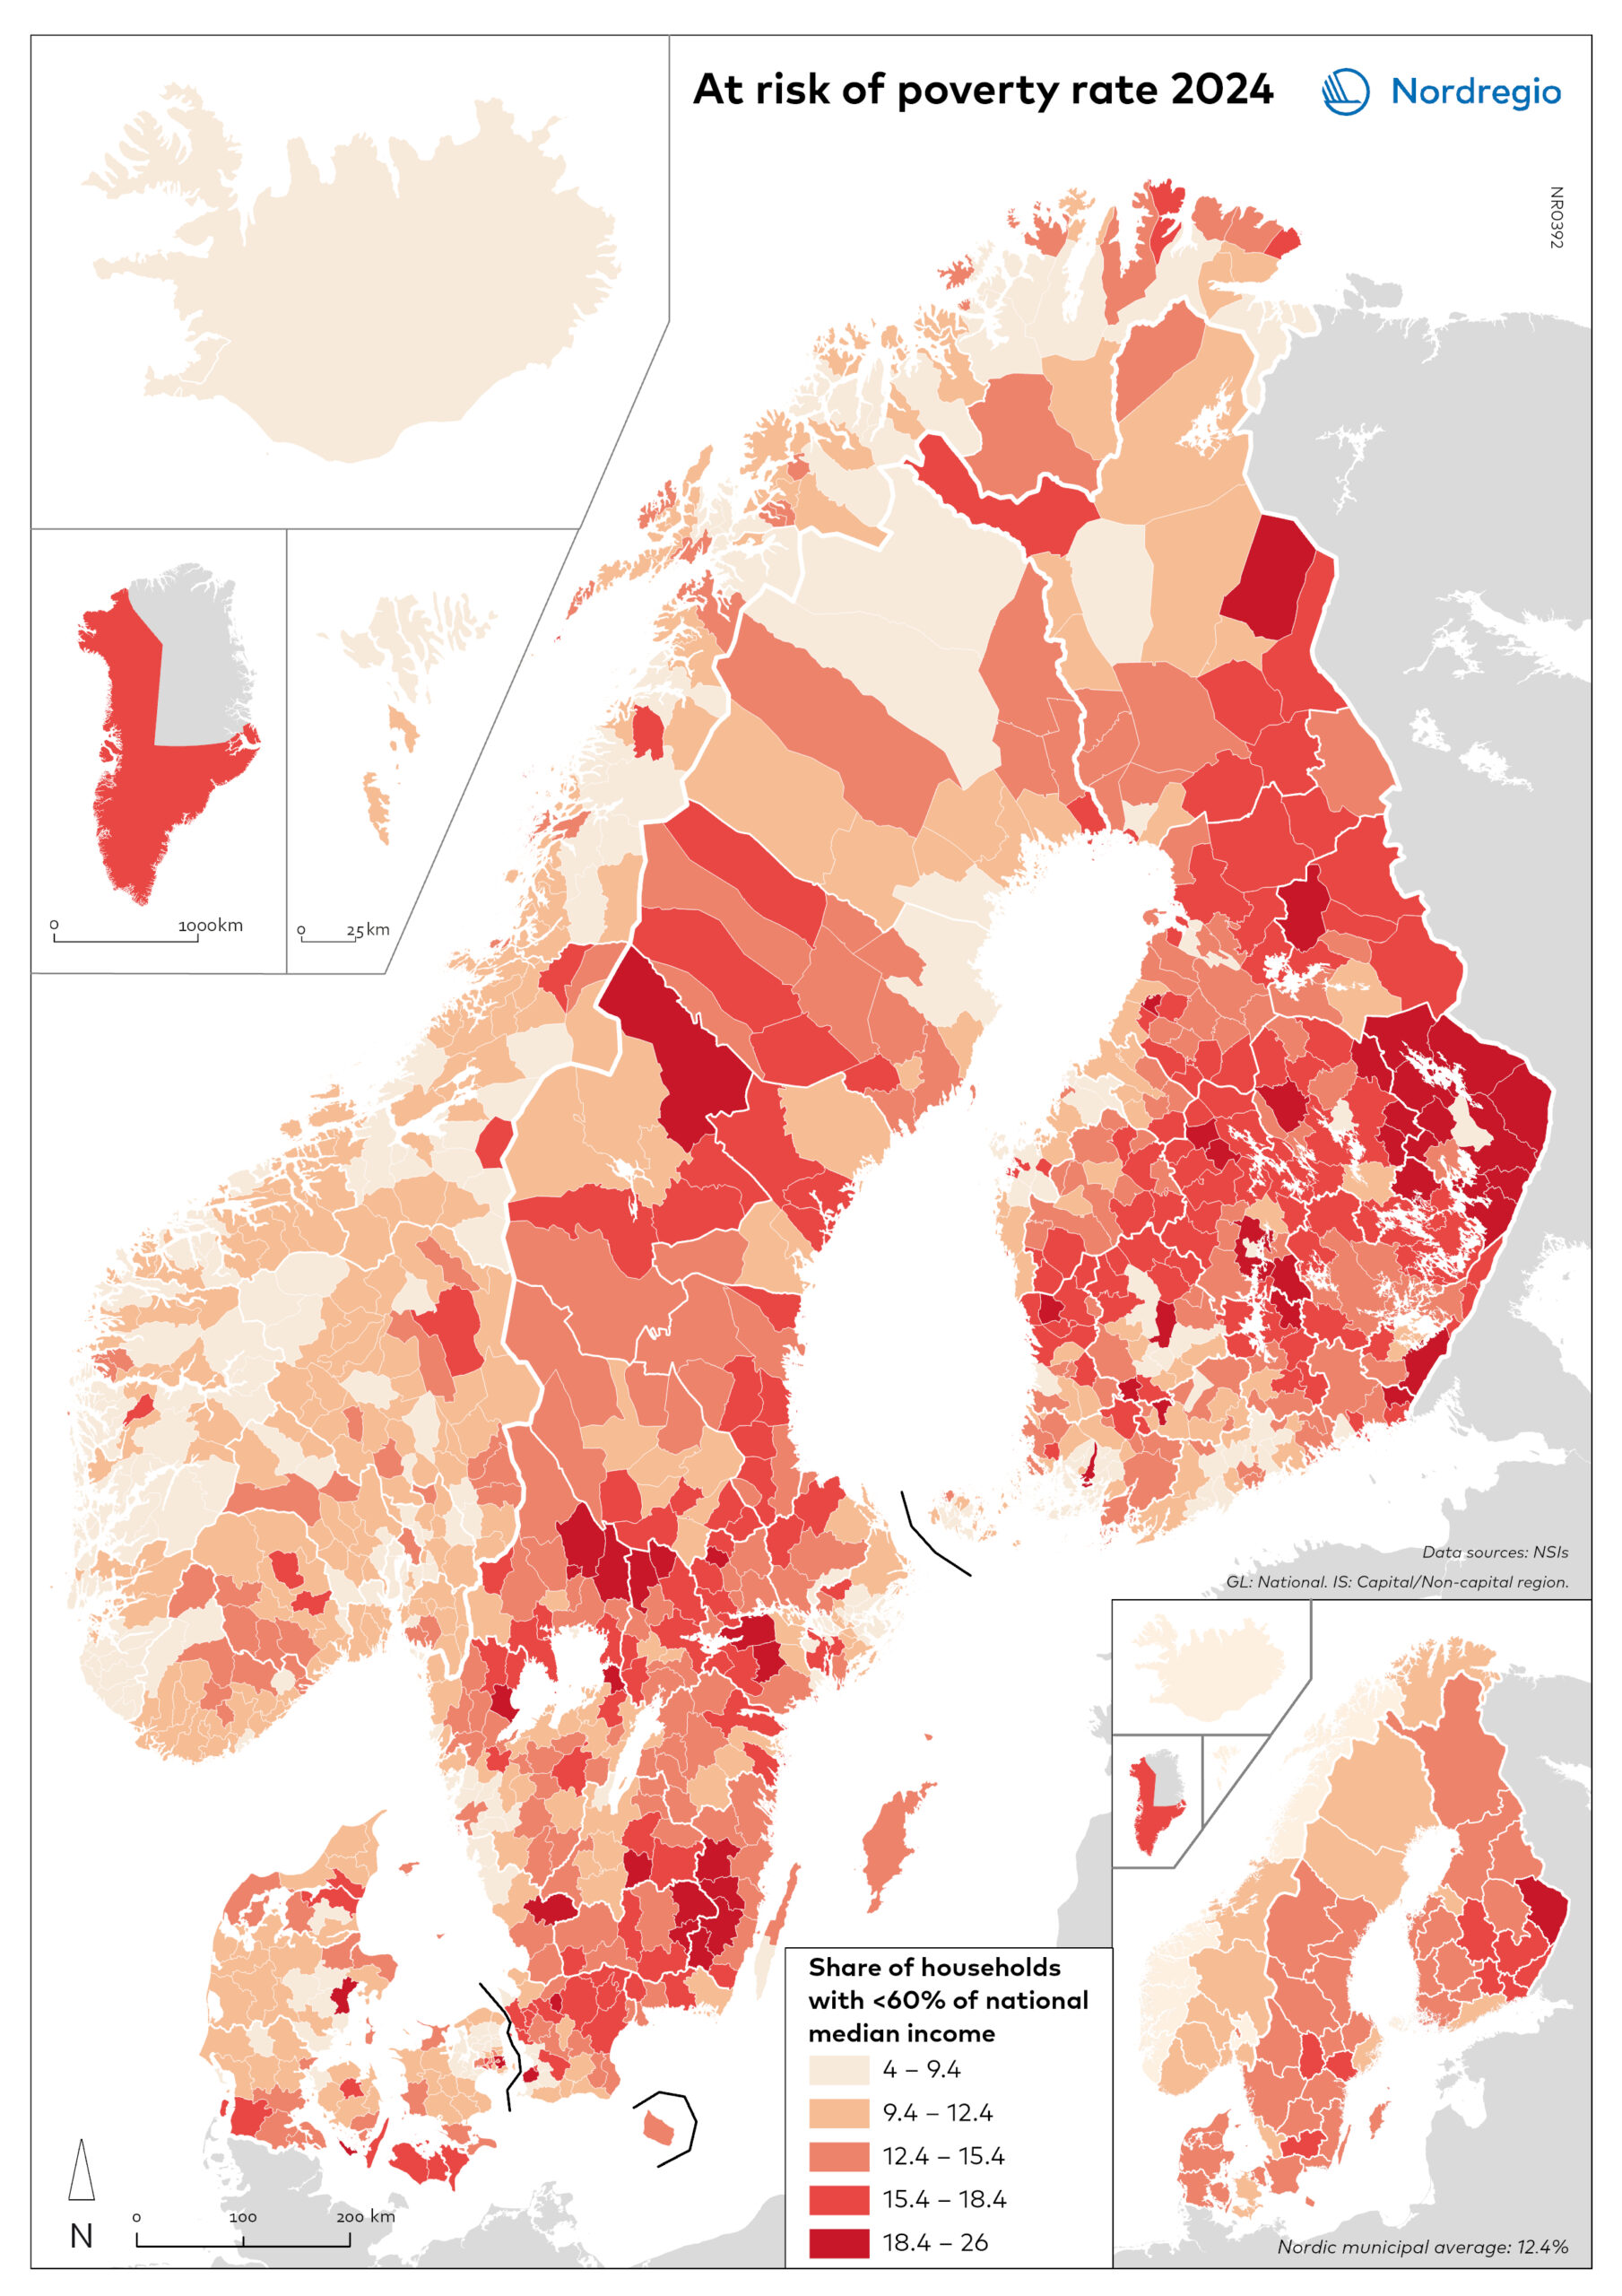
Equivalised means that household income is adjusted to the size and composition of the household. Values for municipalities are compared to their respective national median.
Looking at the map, we almost see a west-east pattern. Lower levels of at-risk-of-poverty are found in Norway, often in coastal municipalities, while many of the municipalities with the highest values are found along Finland’s border to Russia. Greenland presents a national value of 17.9%. Large parts of Iceland and the Faroe Islands are in the lowest group (4–8%). The pattern in Sweden is dispersed. Malmö and Gothenburg municipality have higher values than their neighbouring municipalities. The same goes for Copenhagen and Helsinki, which could suggest that at-risk-of-poverty rates are higher in more urban areas. But Stockholm and Oslo suggest otherwise.
