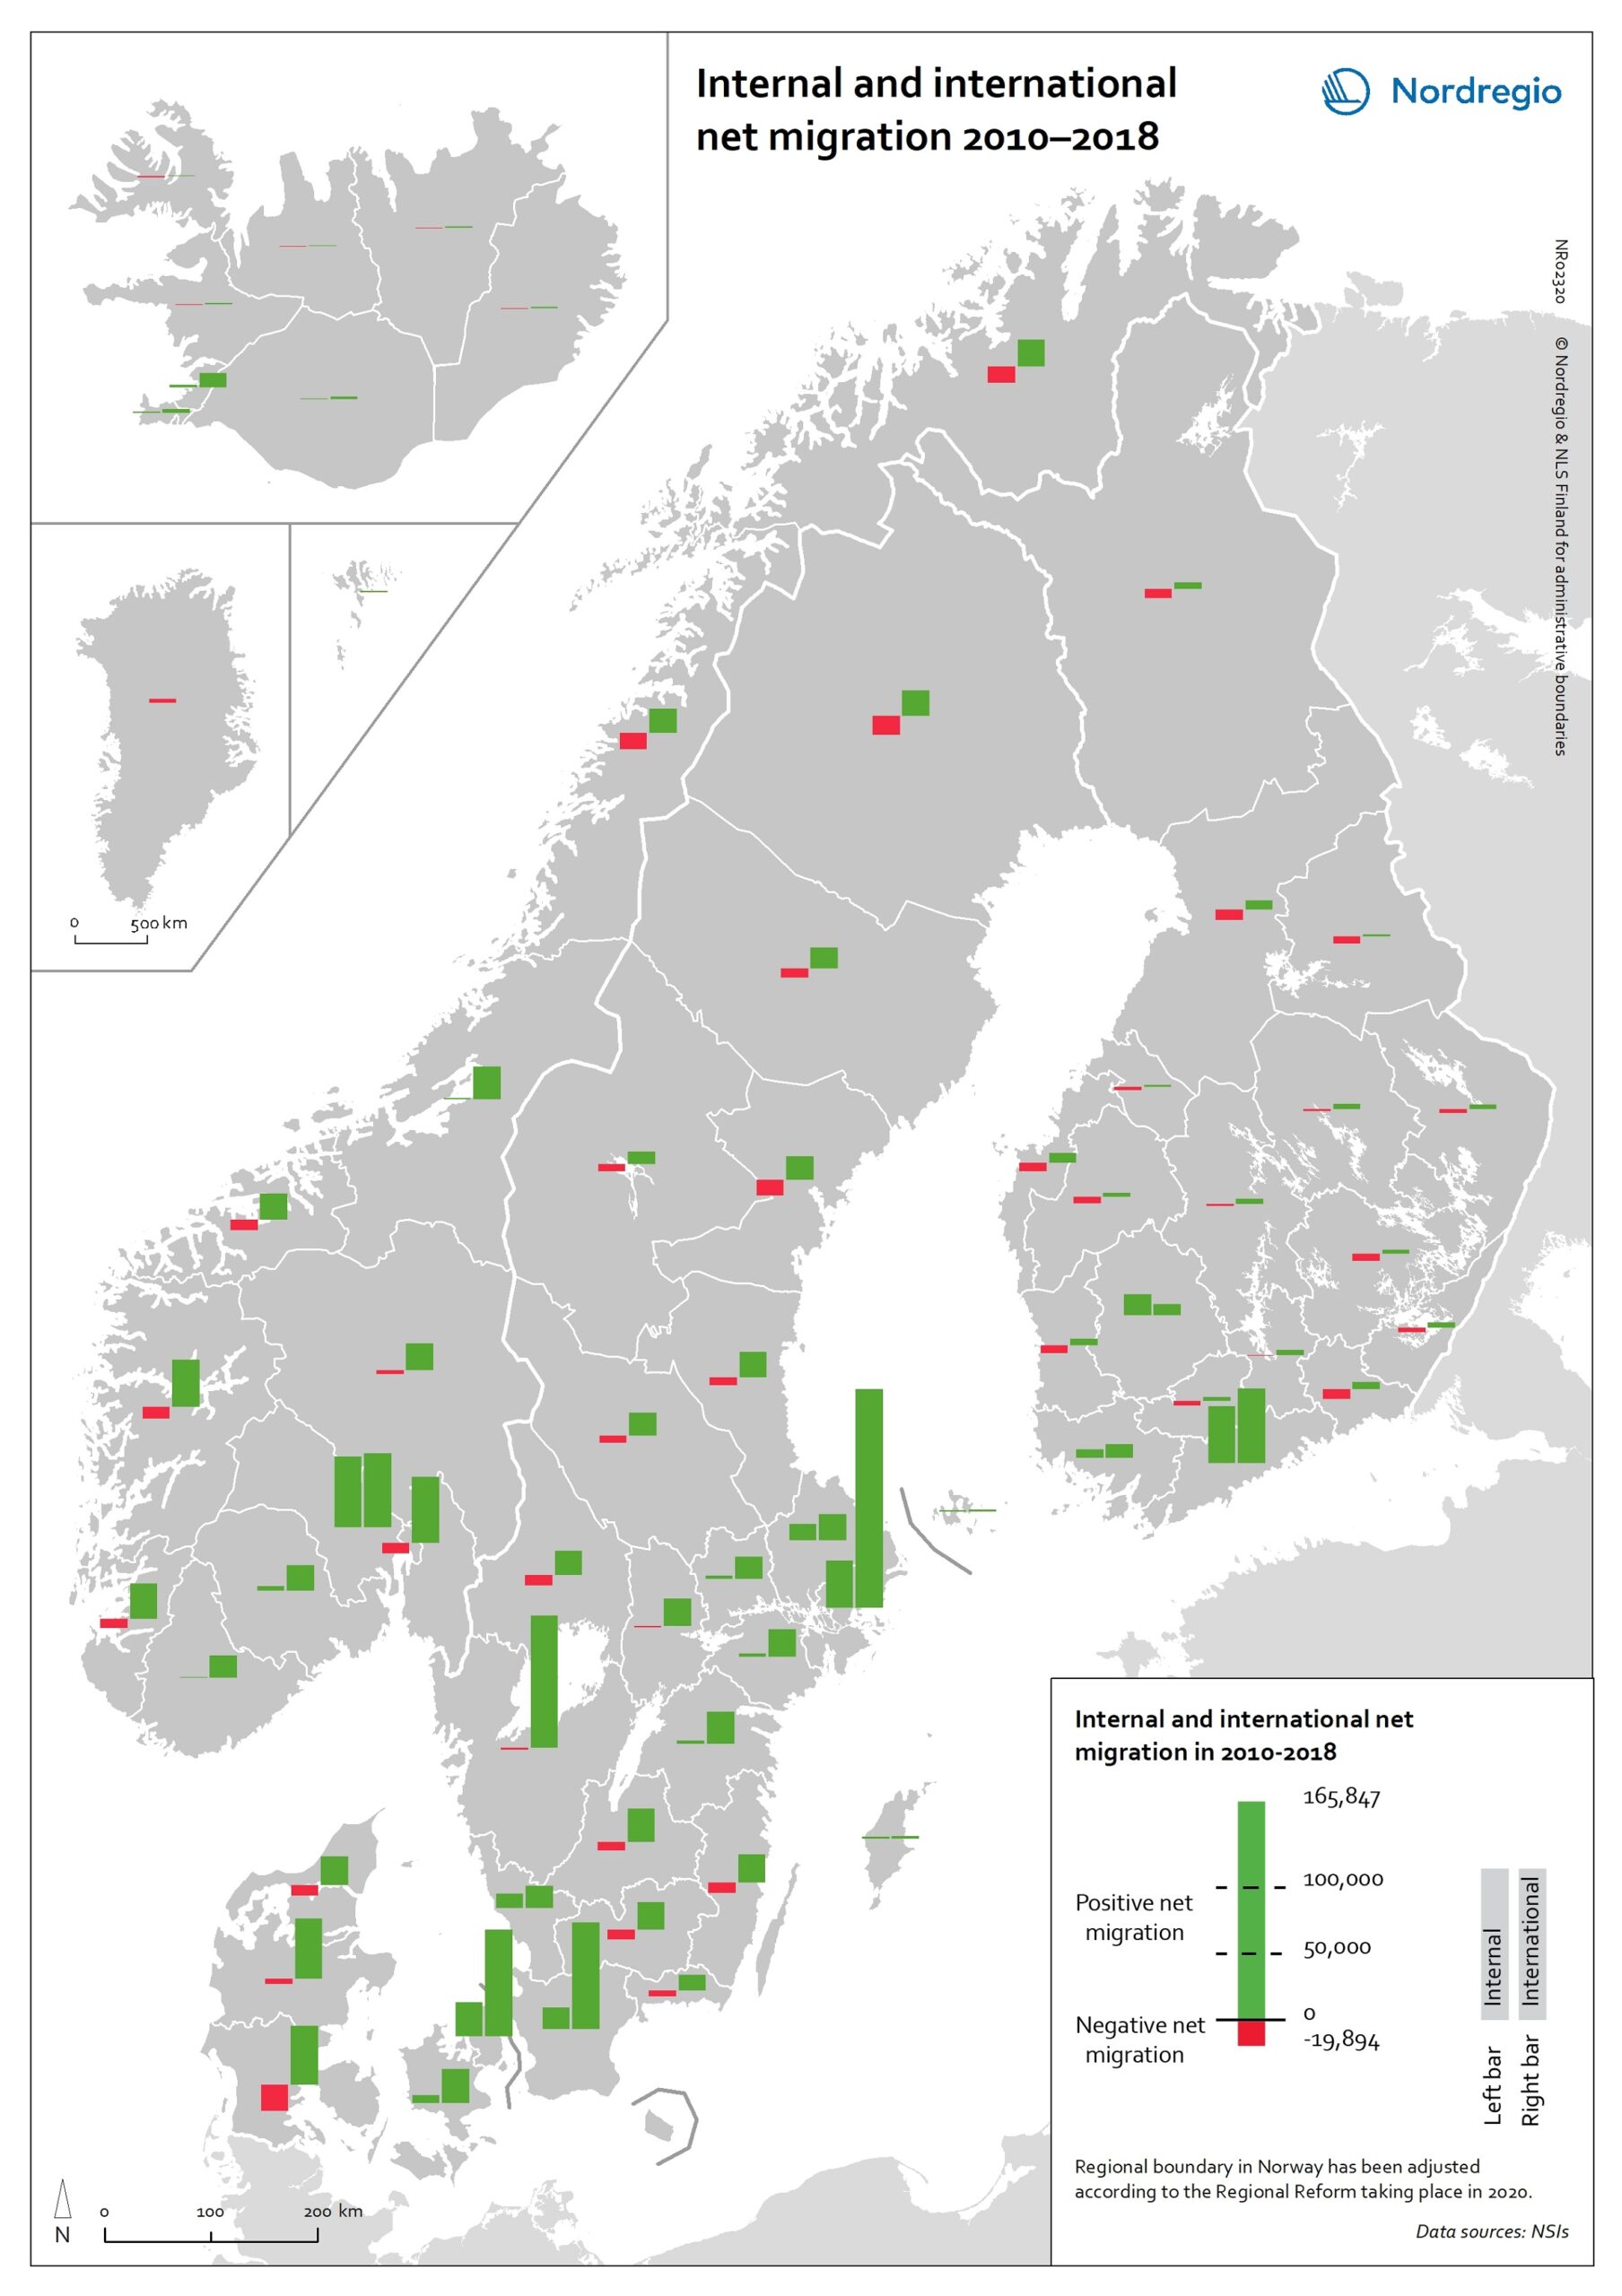
This map shows internal and international net migration in 2010-2018.
The map shows the combination of domestic migration (left-hand bar) and international migration (right-hand bar), with red indicating net out-migration and green indicating net in-migration, for the 66 regions within the Nordic Region in the period 2010 to 2018. The size of the bar indicates the size of the net flows. All regions have had positive international migration since 2010, which is not surprising given the size of the international migration flows into the Nordic Region in recent years.
Overall in the Nordic Region, there were either domestic migration losses and international migration gains or gains from people moving both from elsewhere in the country and from abroad. The gains from international migration far exceeded those of internal migration in almost all regions that experienced net gains from both streams. Due to these different patterns of internal and international migration, nearly all regions are becoming much more diverse in terms of the size of foreign-born populations.
Read the digital publication here.