This map shows the international net migration rate for 2025, calculated as the net migration’s share of the total population.
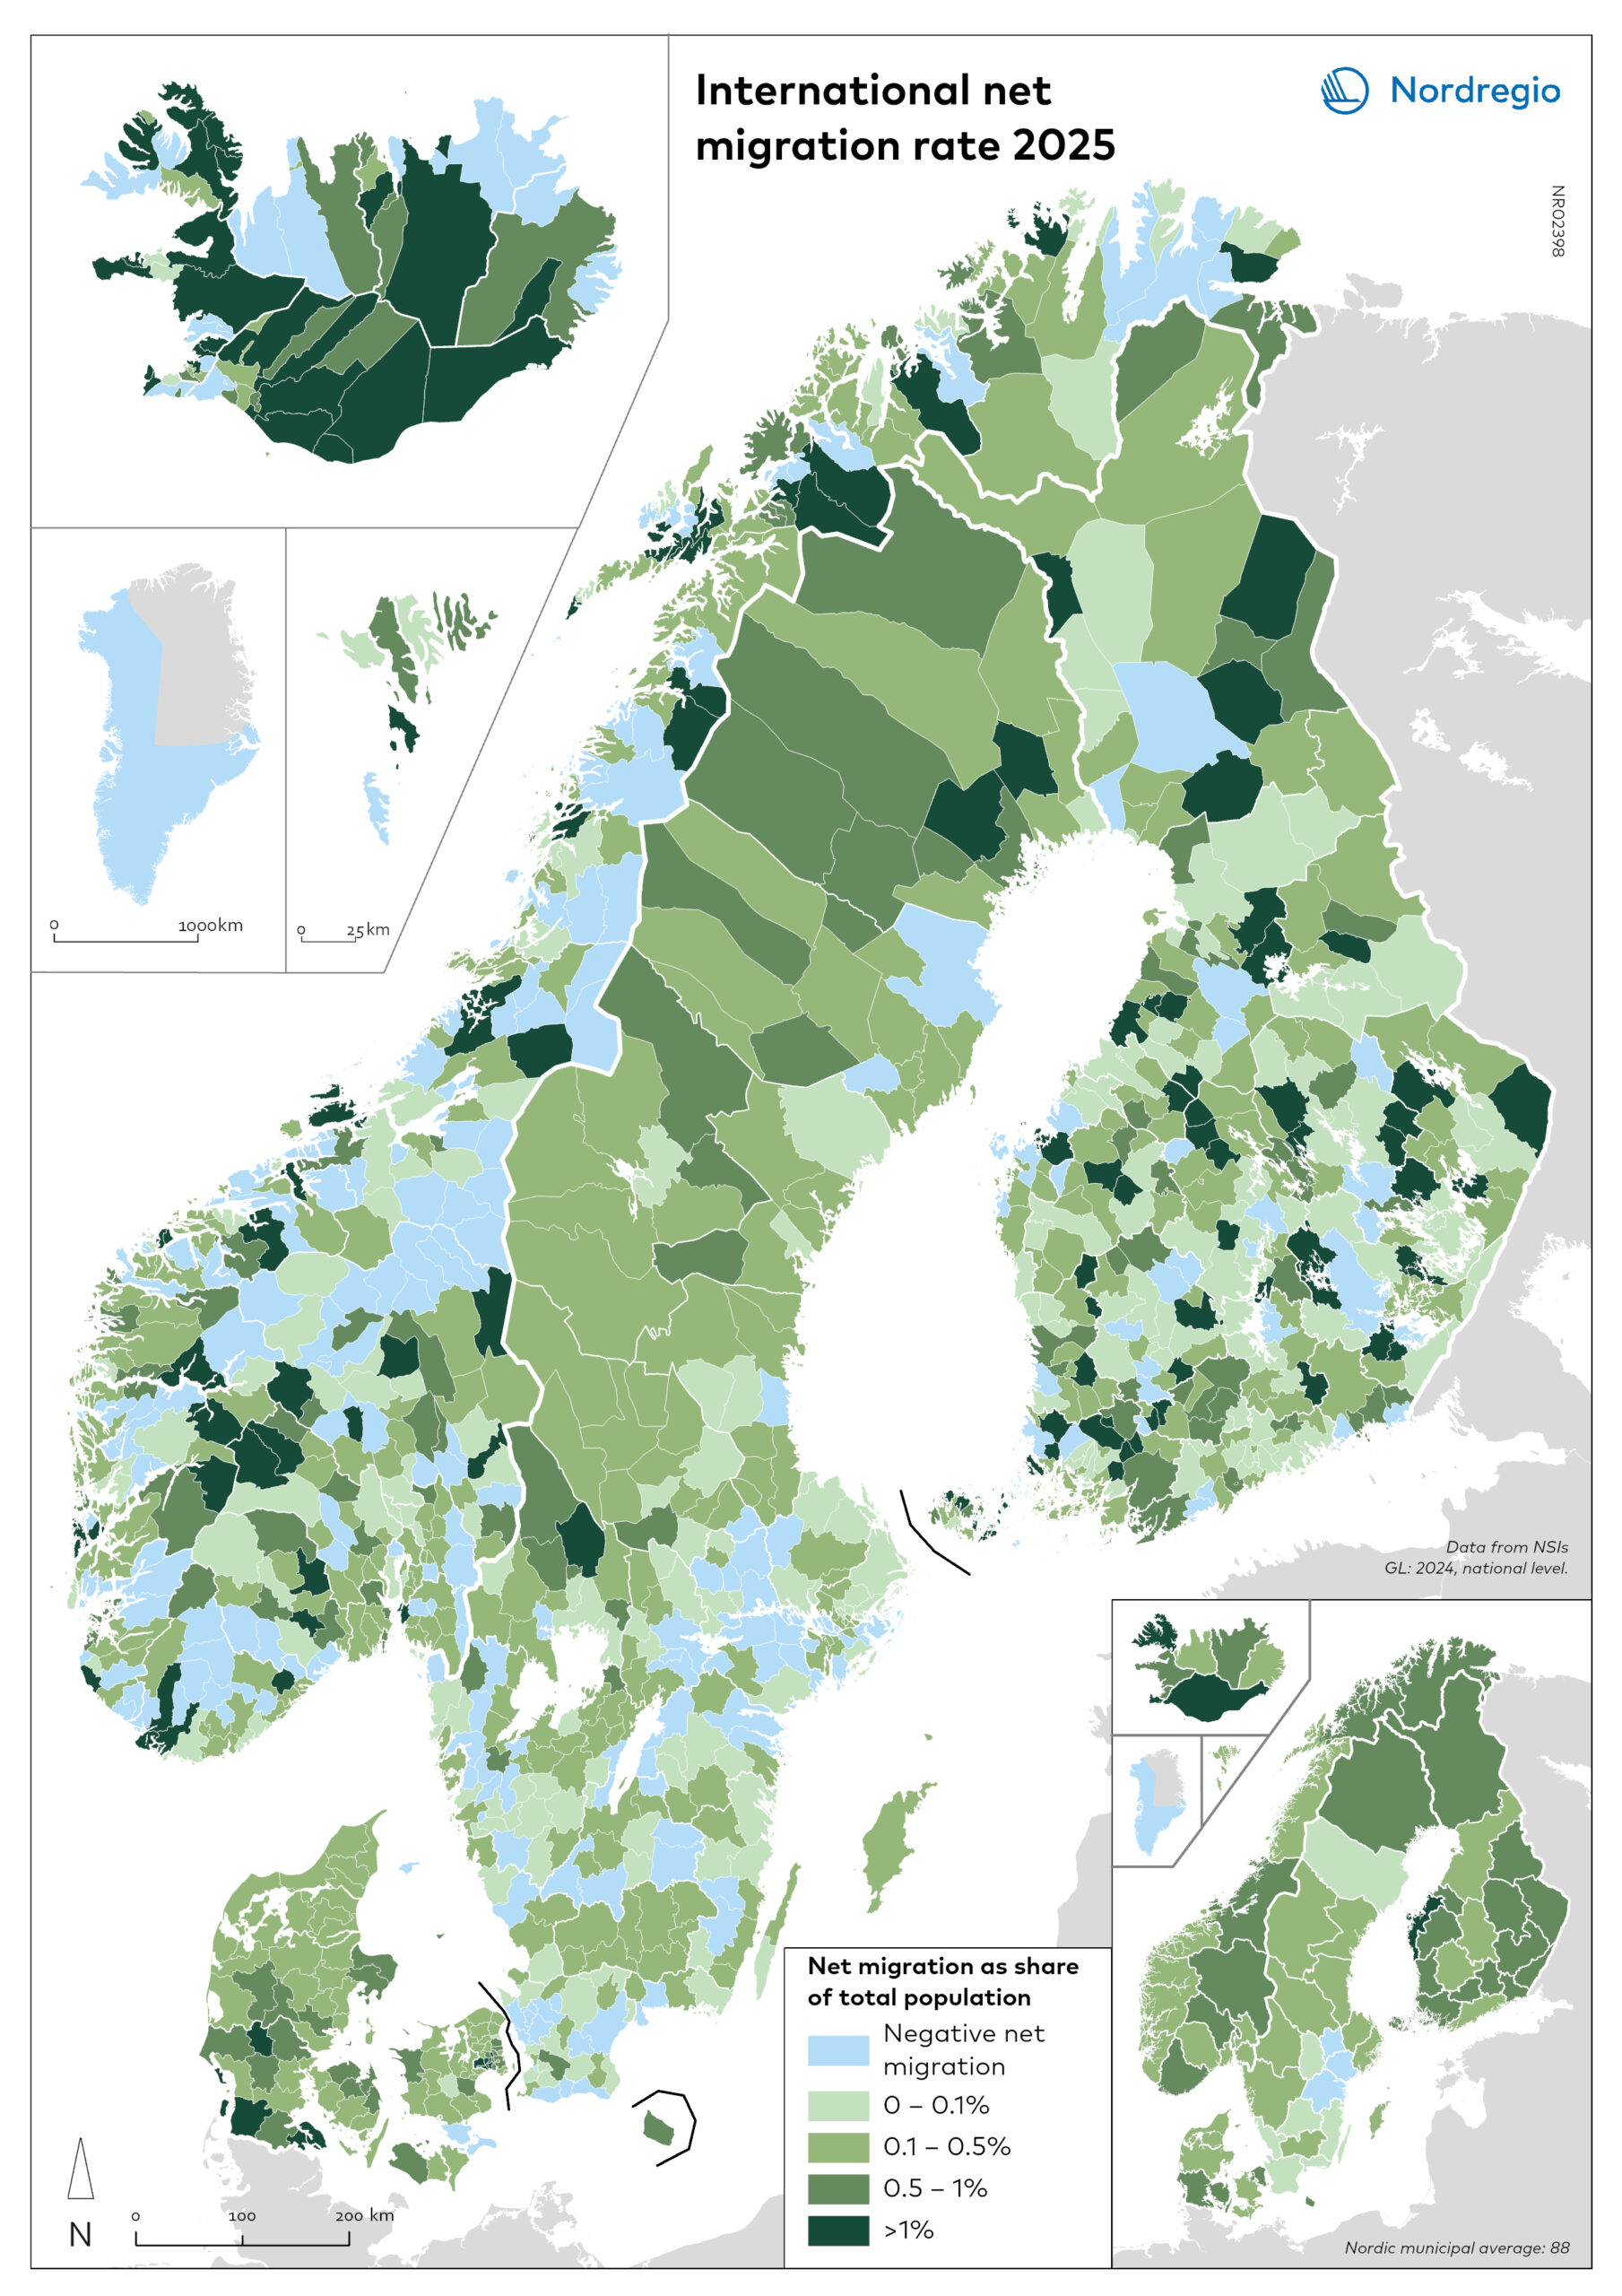
Net migration is calculated as all immigrations – all emigrations. This map only uses international immigrations and emigrations to and from each reporting country. To put it in perspective, the net migration for each municipality (or region) has been divided by the total population for the municipality (or region) in order to visualise the magnitude of international migration in relation to population size.
223 Nordic municipalities had negative net migration in 2025. Two located in Denmark (2%), 32 in Finland (10%), 15 in Iceland (24%), 104 in Norway (29%), one in Faroe Islands (17%), and 69 in Sweden (24%). Values for Greenland were calculated at the national level, where it saw a negative international net migration in 2024. At the regional level, three Swedish counties witnessed negative international net migration in 2025. These were: Södermanland with -178, Västmanland with -74, and Östergötland just below zero at -2.
Many of the municipalities with the highest international net migration as share of the total population are in Finland. 15 of the top 20 are located in the country. No real geographical pattern can be seen, as these municipalities are spread out across the country. Besides Finland, Iceland has one in the top 20, while Norway has 5. At the regional level, only four regions present a value above 1%. Three in Iceland, and one in Finland. 137 municipalities had an international net migration accounting for more than 1% of its total population.
A map on the same theme was made for the year 2020 (see Related Maps below). Although it was made with different colours, and intervals, some differences can be noted. However, the -0.1–0.1 interval makes comparing negative values difficult. At the regional level, negative values were found on Iceland, and plausibly in Denmark, in 2020. In 2025, we see more municipalities exceeding an international net migration rate above 1%, as well as more regions.
