This map shows the yearly average change of employment in business services, 2014–2023 (%).
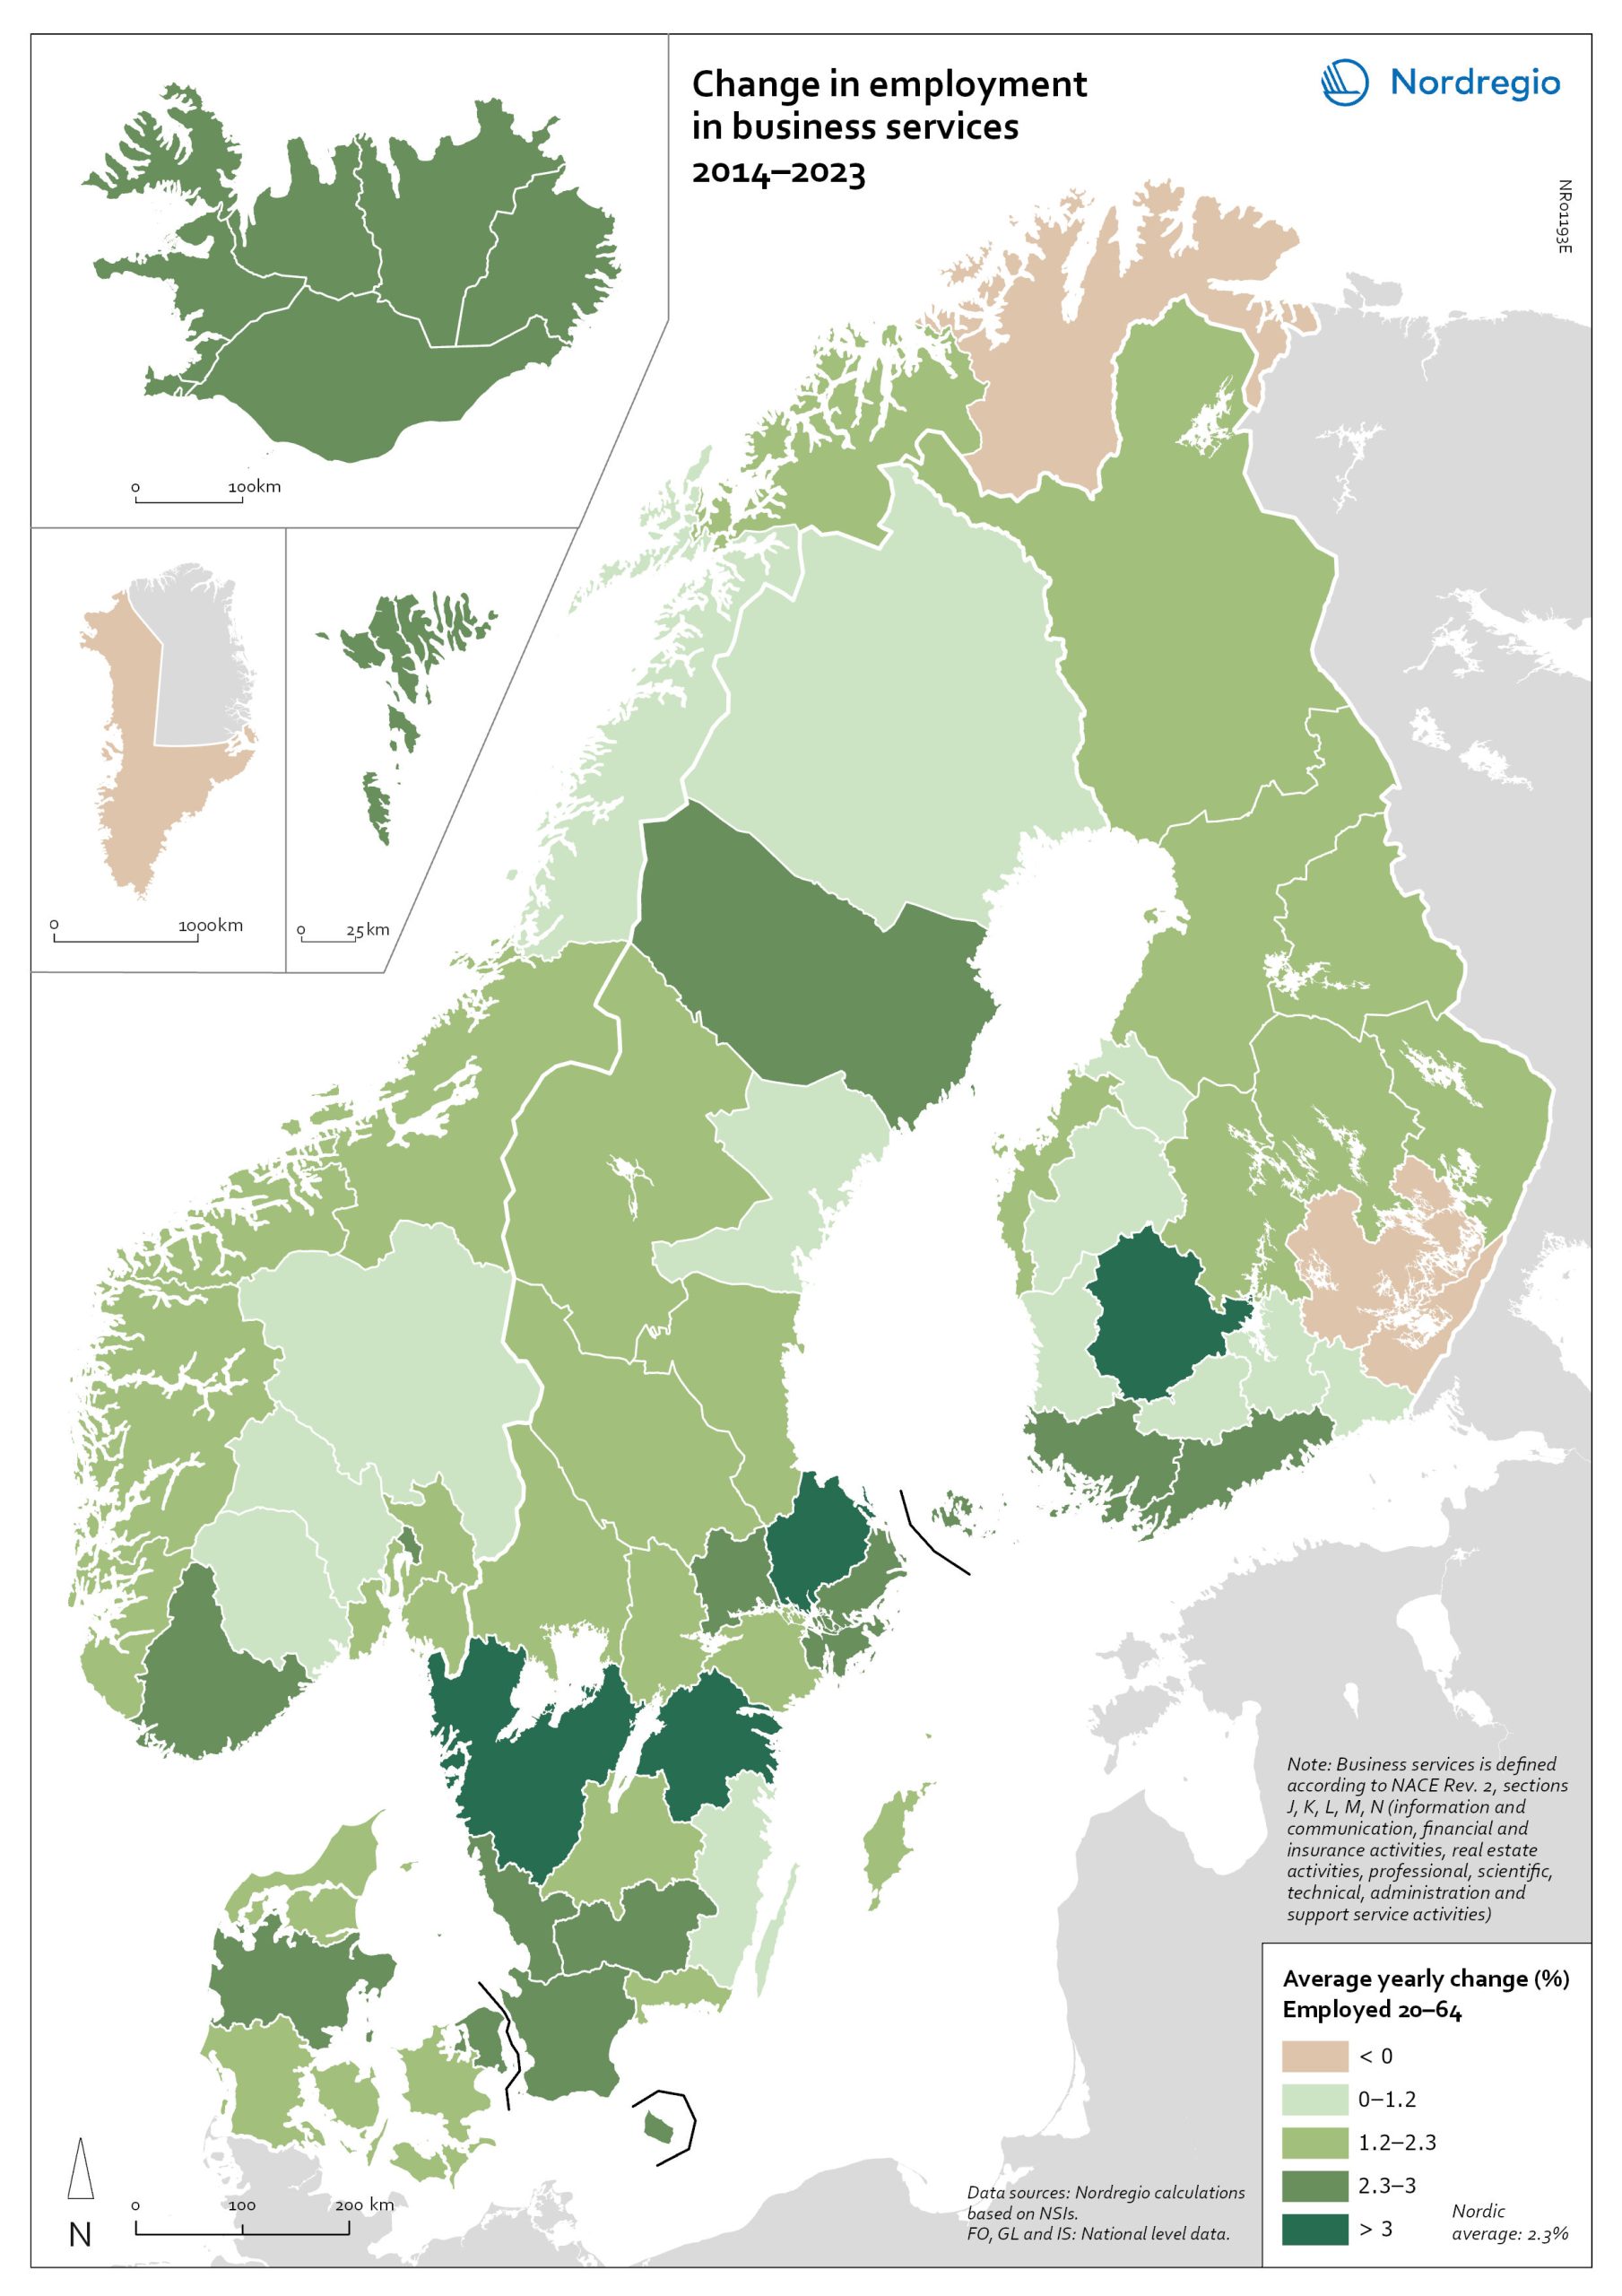
The map is included in the State of the Nordic Region 2026 report (Chapter 6).
25 March, 2026
This map shows the yearly average change of employment in business services, 2014–2023 (%).
The map is included in the State of the Nordic Region 2026 report (Chapter 6).

Junior Cartographer/GIS Analyst


