Across Nordic and Baltic regions

Related Staff
Related Maps
- Nordic-Baltic Demographic Vulnerabilities at municipal level in 2015
- Nordic-Baltic Demographic Vulnerability 2015 indicated by age group 0-14
- Nordic-Baltic Demographic Vulnerability 2015 indicated by age group 15-24
- Nordic-Baltic Demographic Vulnerability 2015 indicated by age group 25-54 years
- Nordic-Baltic Demographic Vulnerability 2015 indicated by net migration
- Nordic-Baltic Demographic Vulnerability 2015 indicated by net migration
- Nordic-Baltic Demographic Vulnerability 2015 indicated by gender balance of the total population
- Nordic-Baltic Demographic Vulnerability 2015 indicated by crude birth rate
- Nordic-Baltic Demographic Vulnerability 2015 indicated by crude birth rate
- Nordic-Baltic Demographic Vulnerability 2015 indicated by age group 65 years and over
- Nordic-Baltic Demographic Vulnerability 2015 indicated by age group 65 and over
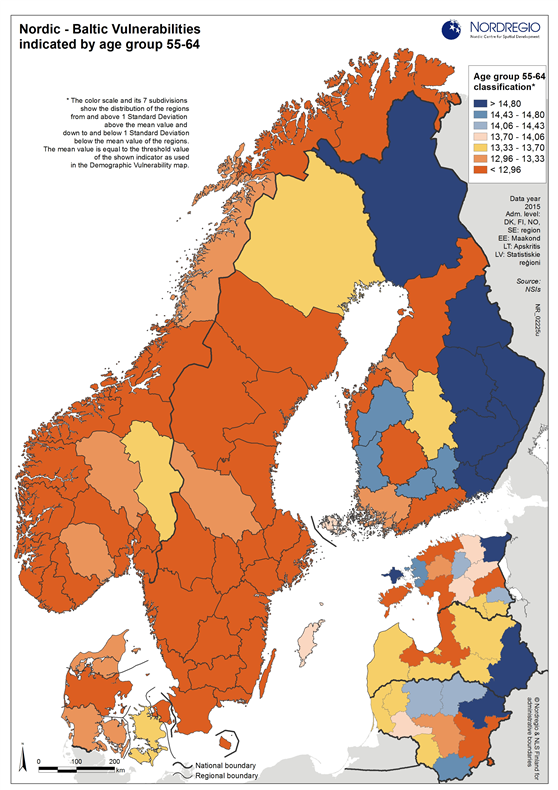
- Nordic-Baltic Demographic Vulnerability 2015 indicated by age group 55-64 years


