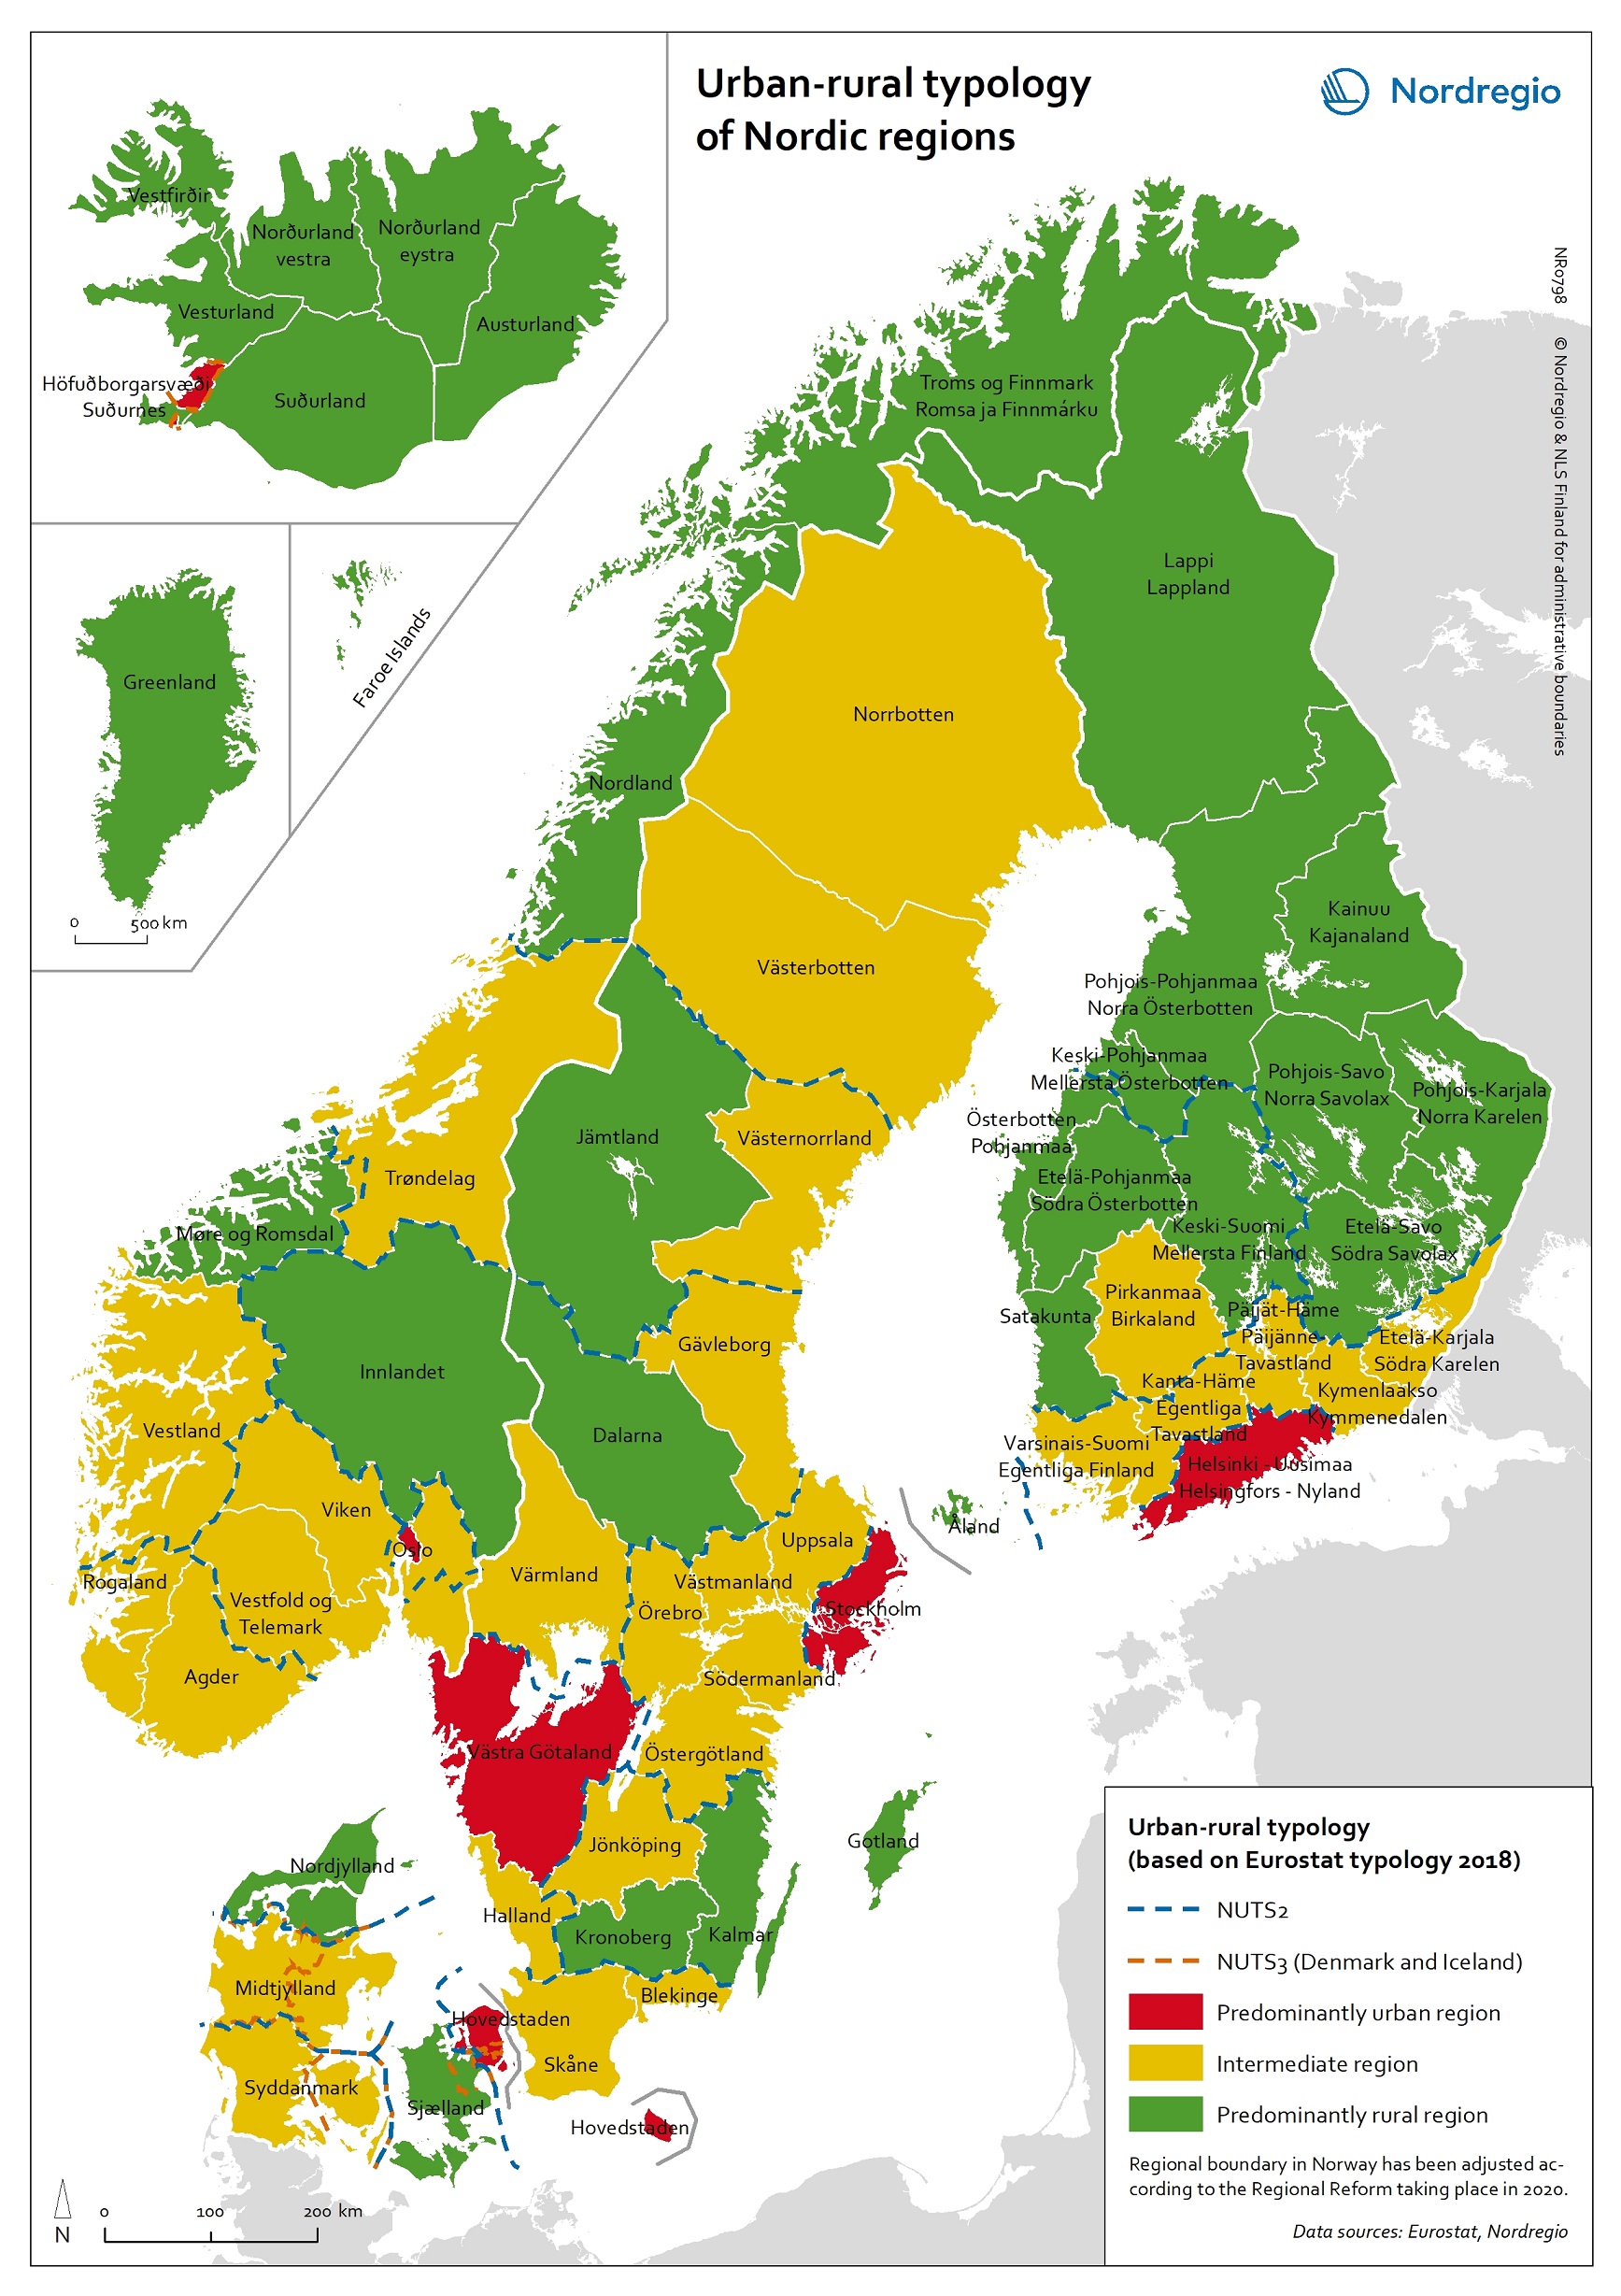
This map is included in the introduction of the State of the Nordic Region 2020 report.
The map is based on the typology provided by Eurostat (2018), in which the 2016 NUTS 3 regions are classified in three categories according to their population density in 2011 and 2015, in 1 km² grids. In predominantly urban regions, at least 80% of the total population is urban, while in intermediate regions, 50–80% of the population lives in urban clusters. In regions that are predominantly rural, less than 50% of the population lives in urban areas.
Read the digital publication here.