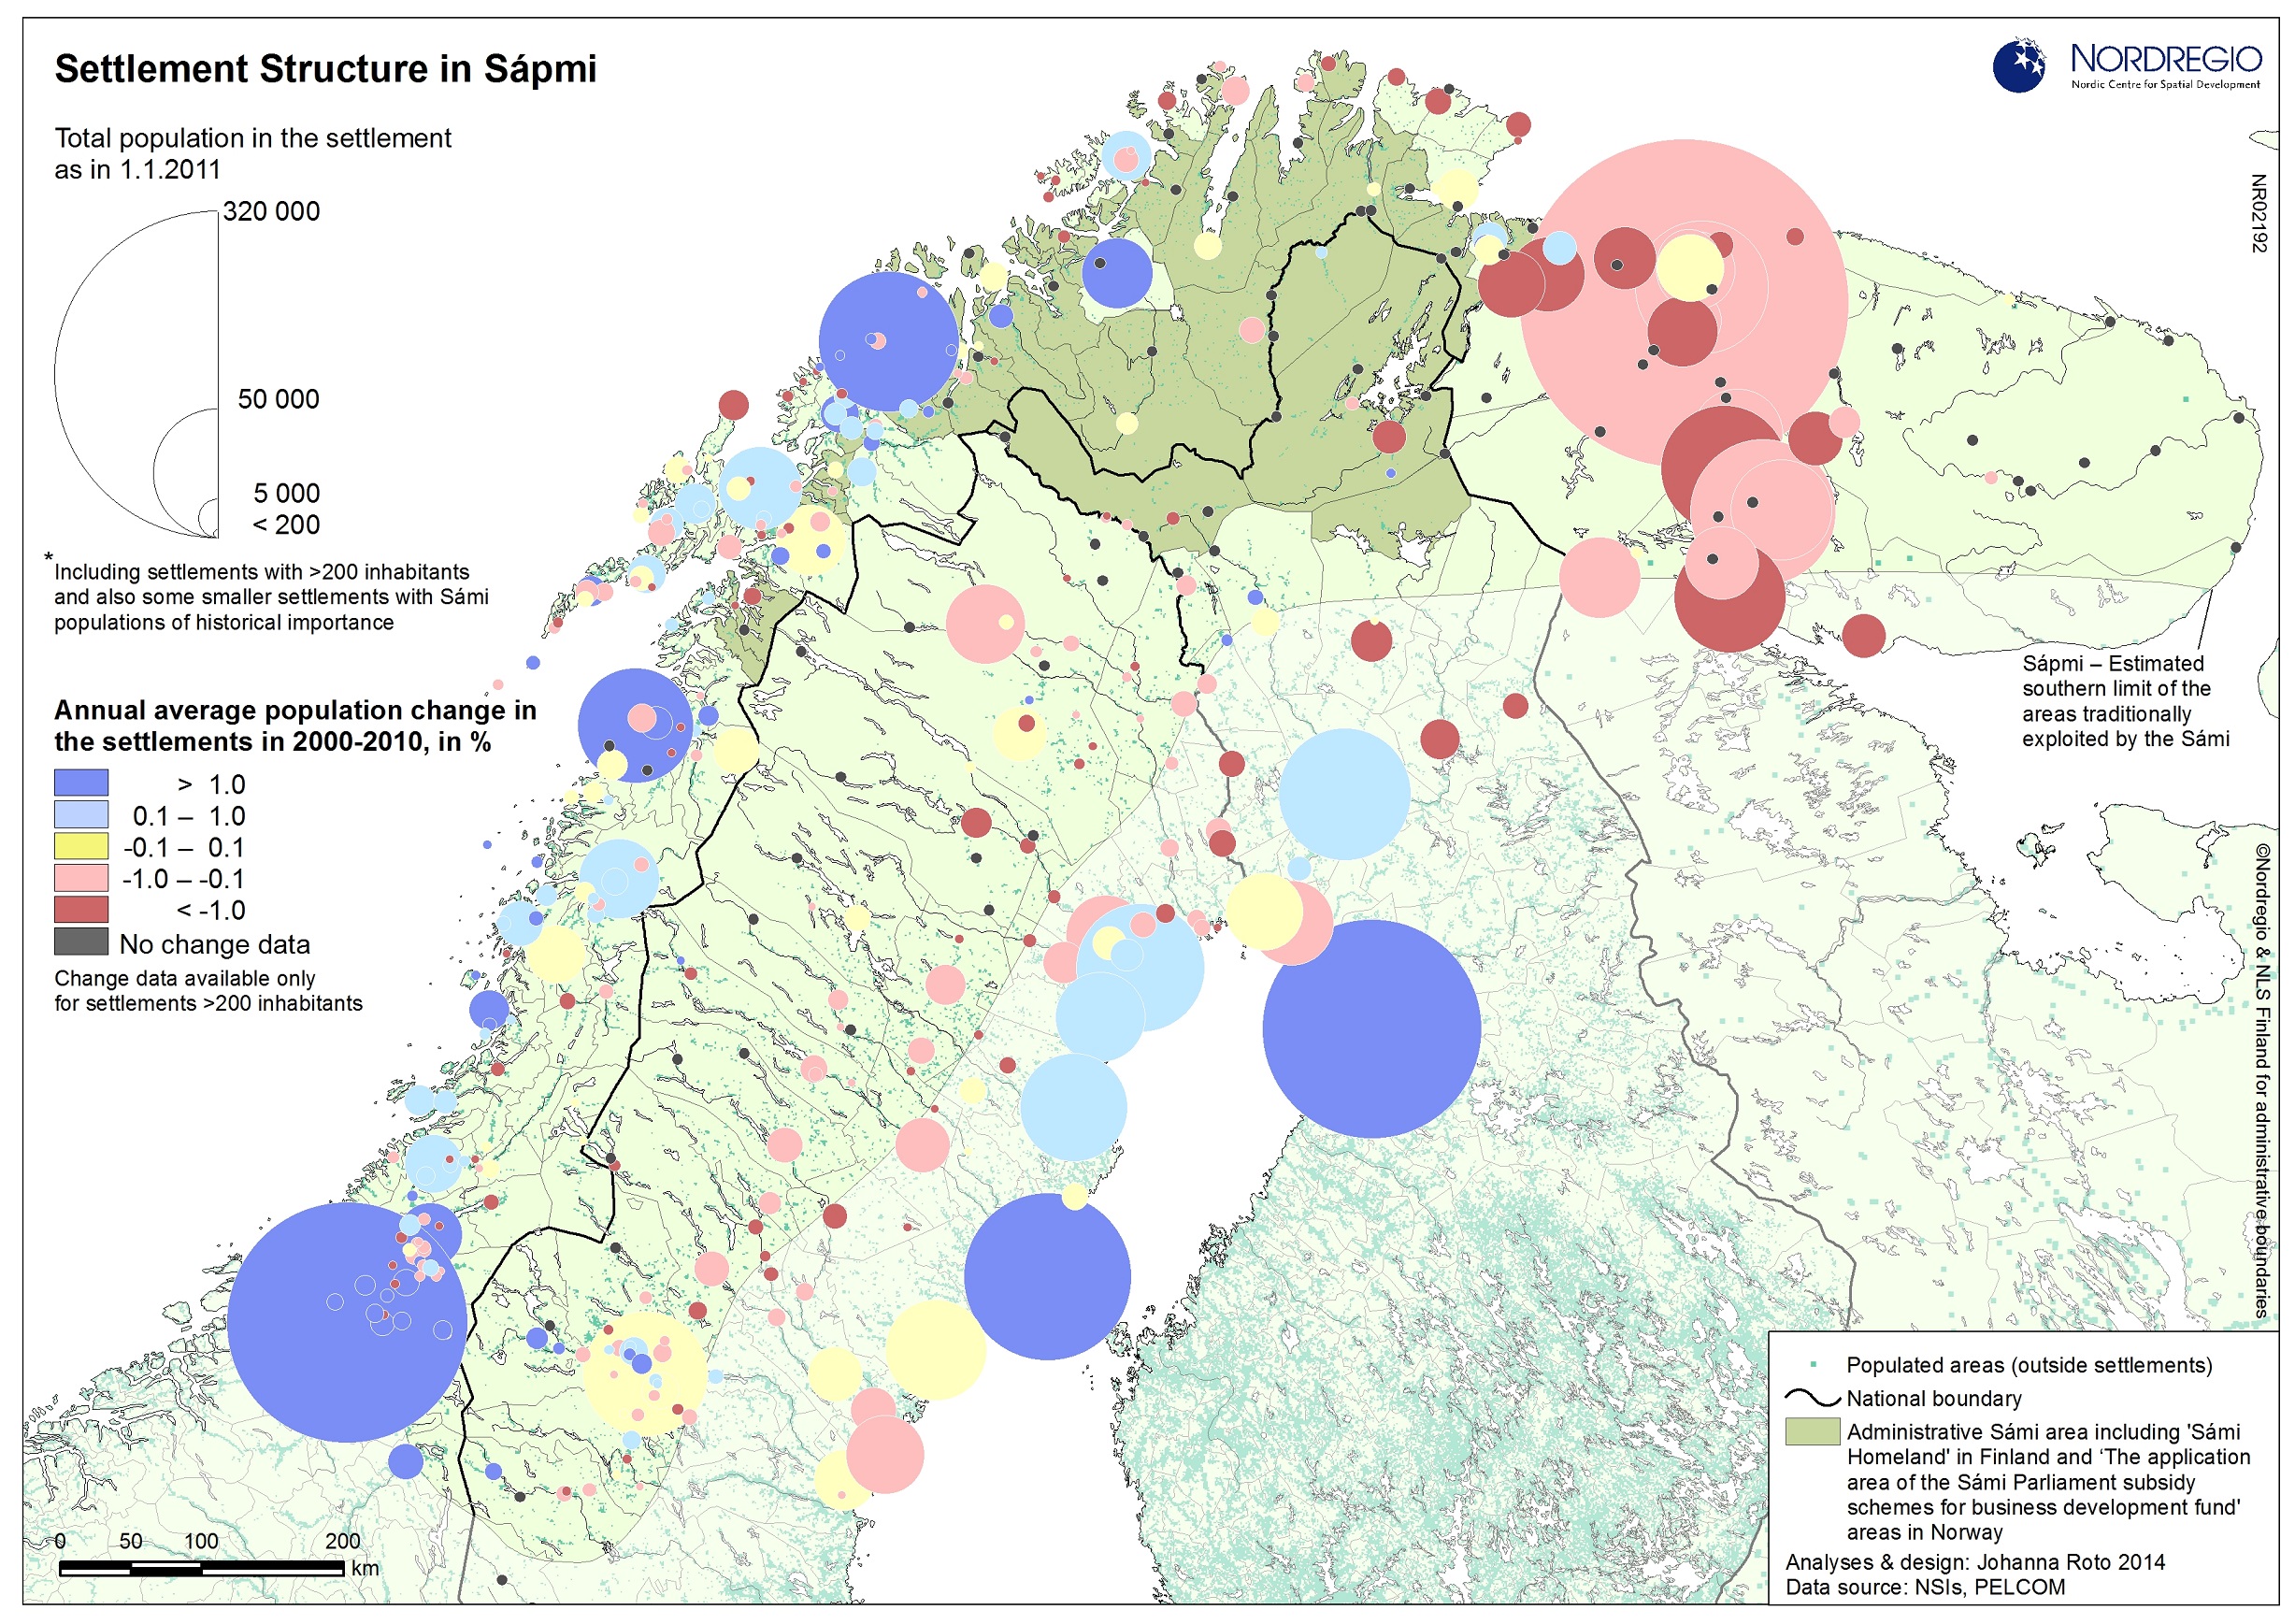
Location of settlements and annual average population change in the settlements in 2000-2010, in %
Map Facts
The Sápmi is home to some 2 million people, who, in a geographical sense, inhabit rather unevenly a large land area. The division of the population can be seen from three different perspectives or spatial dichotomies, between west and east, coastal and inland and urban and rural areas. The East –West divide results from the differences in settlement pattern between the Nordic Countries with relatively many small and medium size cities and the Kola Peninsula where almost one million people live in a small number large settlements. The coastal and inland division reflects traditional or, historical, settlement patterns where major settlements where located in coastal areas or along main rivers while inland areas were mainly uninhabited or populated only by a limited number of small, permanent, settlements. Finally, the urban-rural divide reflects rather more current population dynamics where more and more people are now living in the cities and the rural areas are struggling to combat outward migration. Currently some 65% of the population in Sápmi live in settlements with at least 10 000 inhabitants and in the Kola Peninsula the share of those living in such settlements is over 85%. During the last 20 years the total population in Sápmi has decreased by 14%. This decrease has taken place primarily in the rural areas and in small settlements. Many of the larger cities and some smaller settlements have however experienced a population increase. In this context, the Norwegian cities of Tromsø, Bodø and Alta in particular, as well as some smaller settlements with good regional assets like tourism and fishing, have experienced positive demographic development.
All images are the property of Nordregio. They may be freely used as long as the logo of Nordregio is clearly visible and the source is cited accordingly. Please give also the cartographer/designer/author credit and give full recognition to the data sources if named in the graphic.
