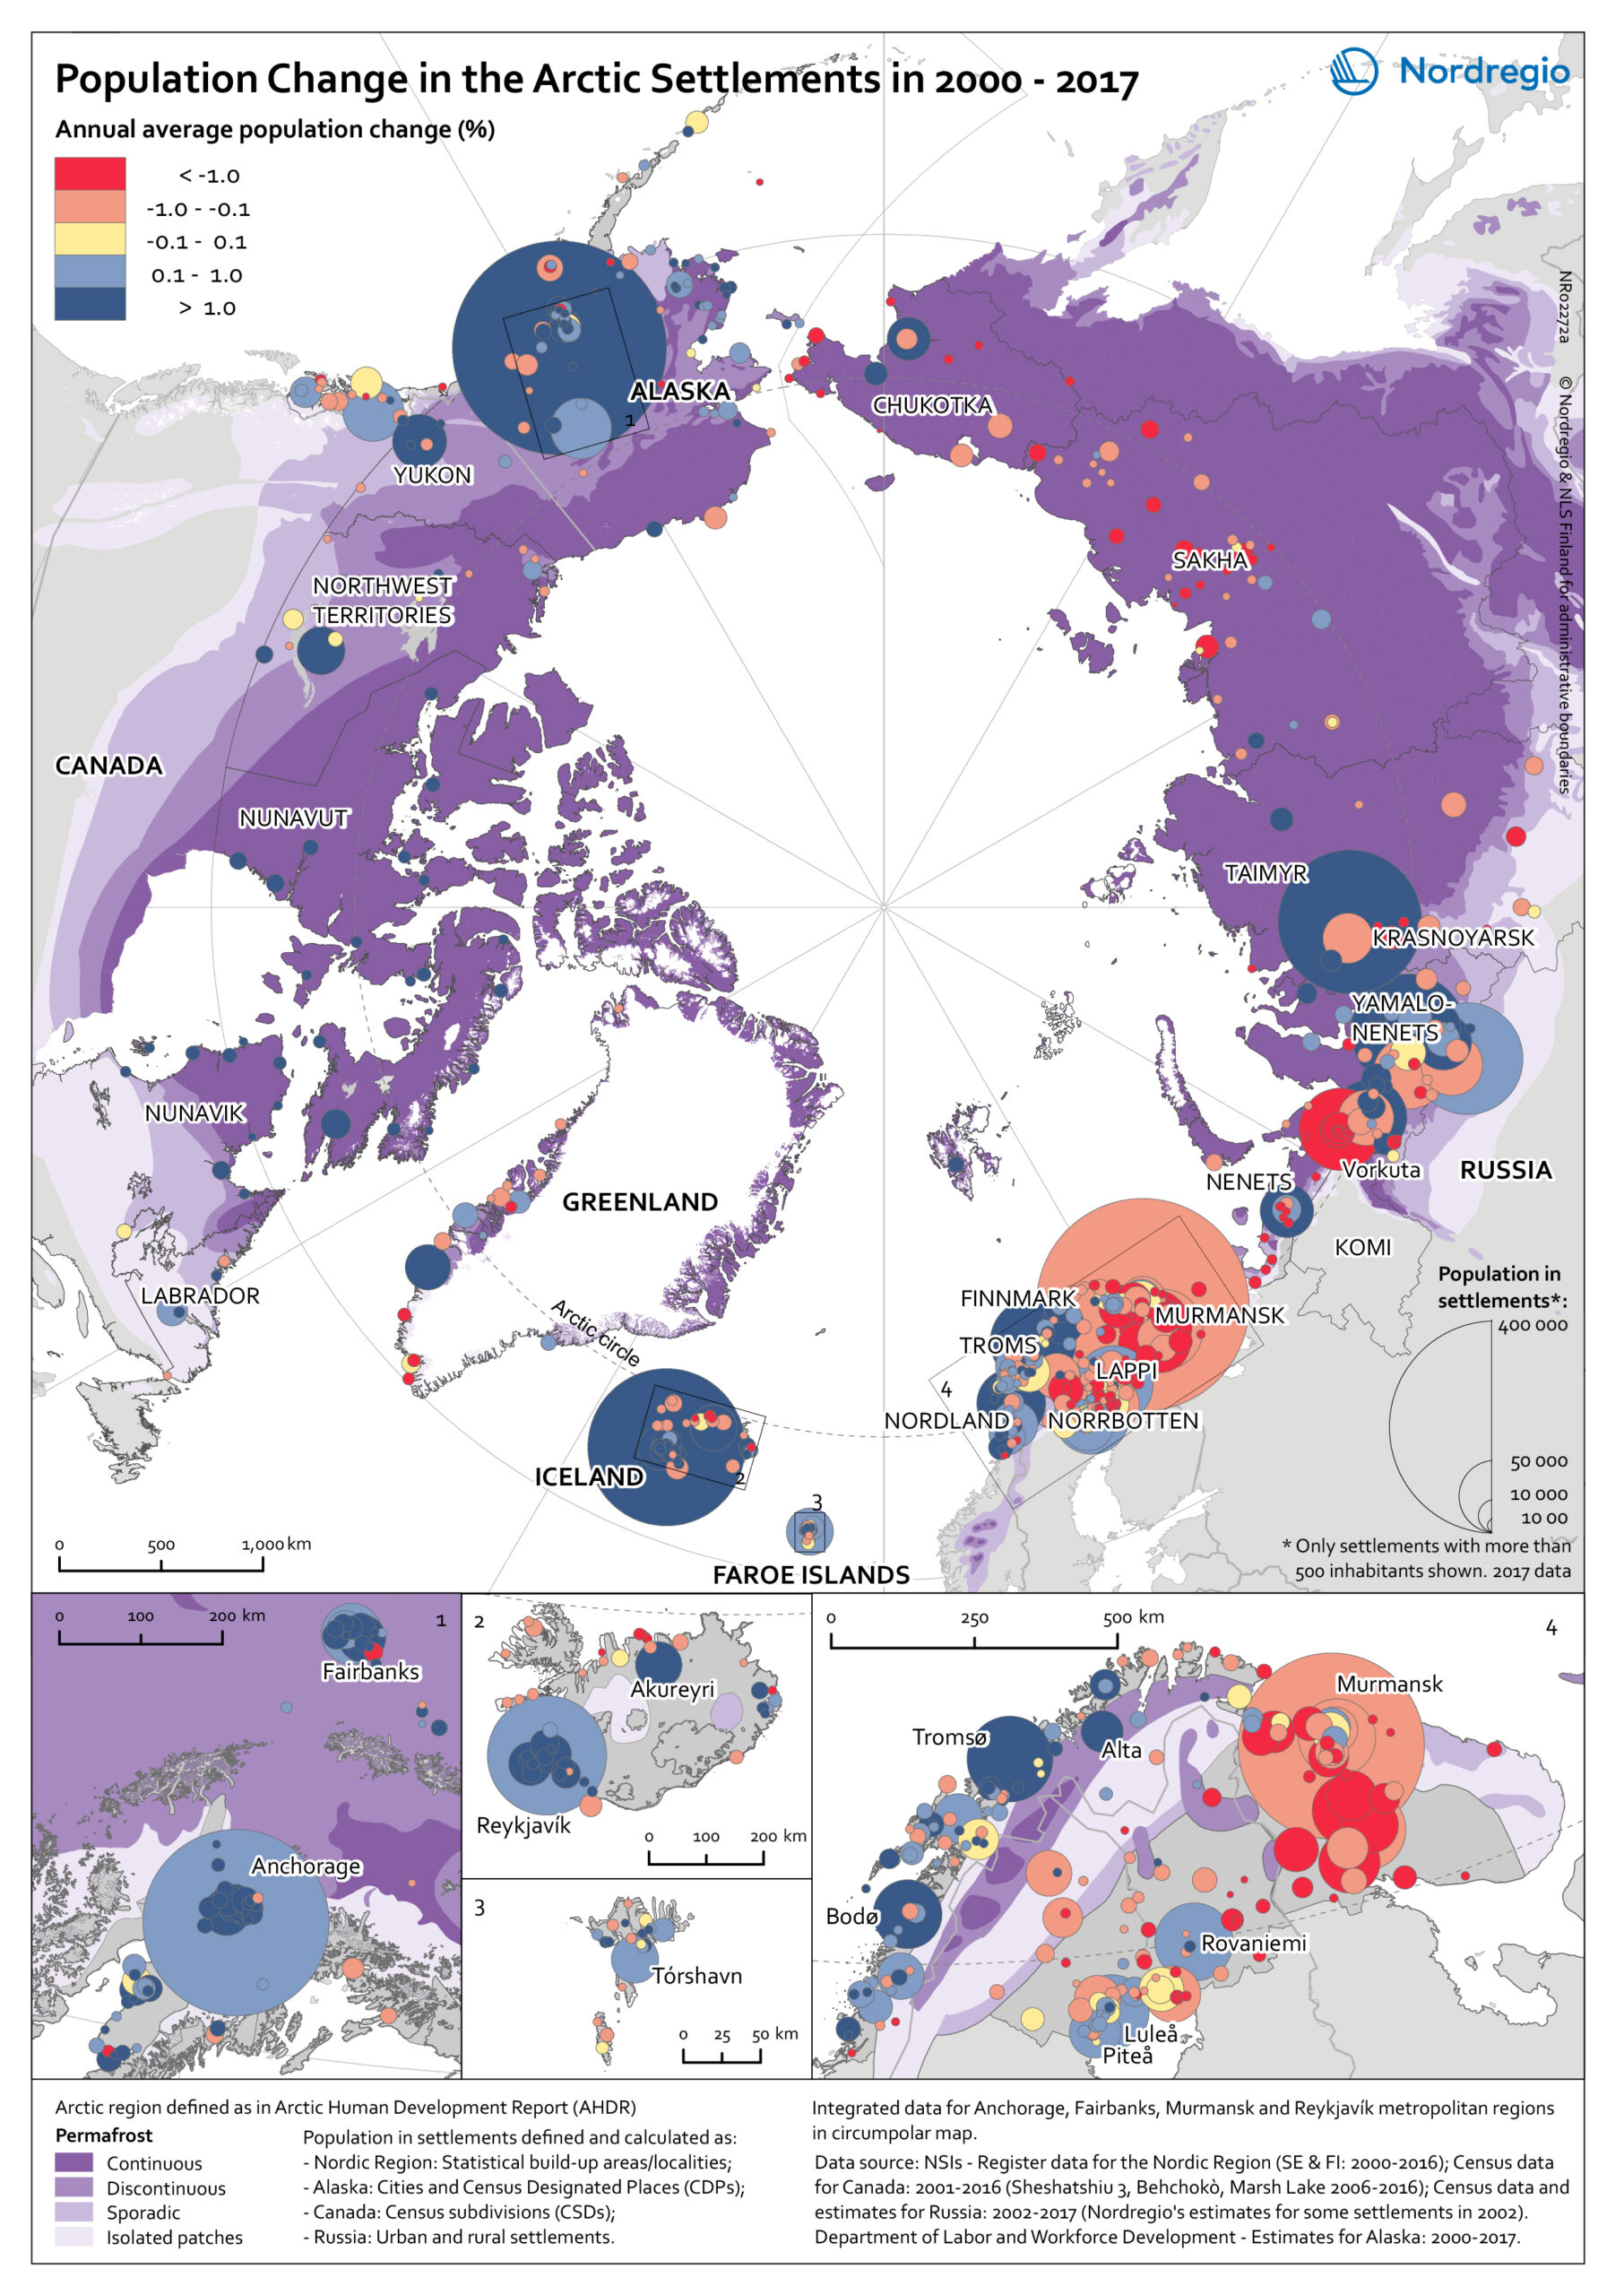
The map provides an overview of the population change in Arctic settlements with 500 inhabitants or more during the period 2000 to 2017.
The purple underlaying layer shows the extent of permafrost across the Arctic. The circles indicate settlements with 500 inhabitants or more and are proportional to the total population in 2017. Blue tones indicate population growth between 2000 and 2017, while red tones indicate population decline. Four zoomed-in maps show areas with high settlement density – Arctic Fennoscandia, Iceland, the Faroe Islands, and Alaska.
In Alaska, population increased in the largest settlements between 2000 and 2017. The population decline in small settlements located far from the two large cities – Anchorage and Fairbanks – has been caused by outmigration, which has cancelled out the positive natural population growth. In the Canadian Arctic, most people live in a few settlements. Similar to Alaska, the population increased in the largest settlements and decreased in small settlements.
Most of the smaller settlements in Arctic Fennoscandia have witnessed a population decline between 2000 and 2017, except in Norway. The dominant pattern in Fennoscandia is a population growth in larger settlements and a population decline in surrounding smaller settlements. This is similar to the pattern observed in the other Nordic Arctic countries – Iceland, Greenland, and the Faroe Islands. New inhabitants settled in the capitals (Reykjavik, Nuuk, and Torshavn) and regional centres, from both domestic and international locations, while settlements in sparsely populated areas are becoming less attractive to incomers.
In the Russian Arctic, the regions can be divided into the oil and gas areas of the Khanty-Mansi and Yamal-Nenets, and other areas. The population is growing in the oil and gas areas and declining slowly in the others. Over 75% of the settlements have been shrinking throughout the 21st century, mainly because of outmigration.