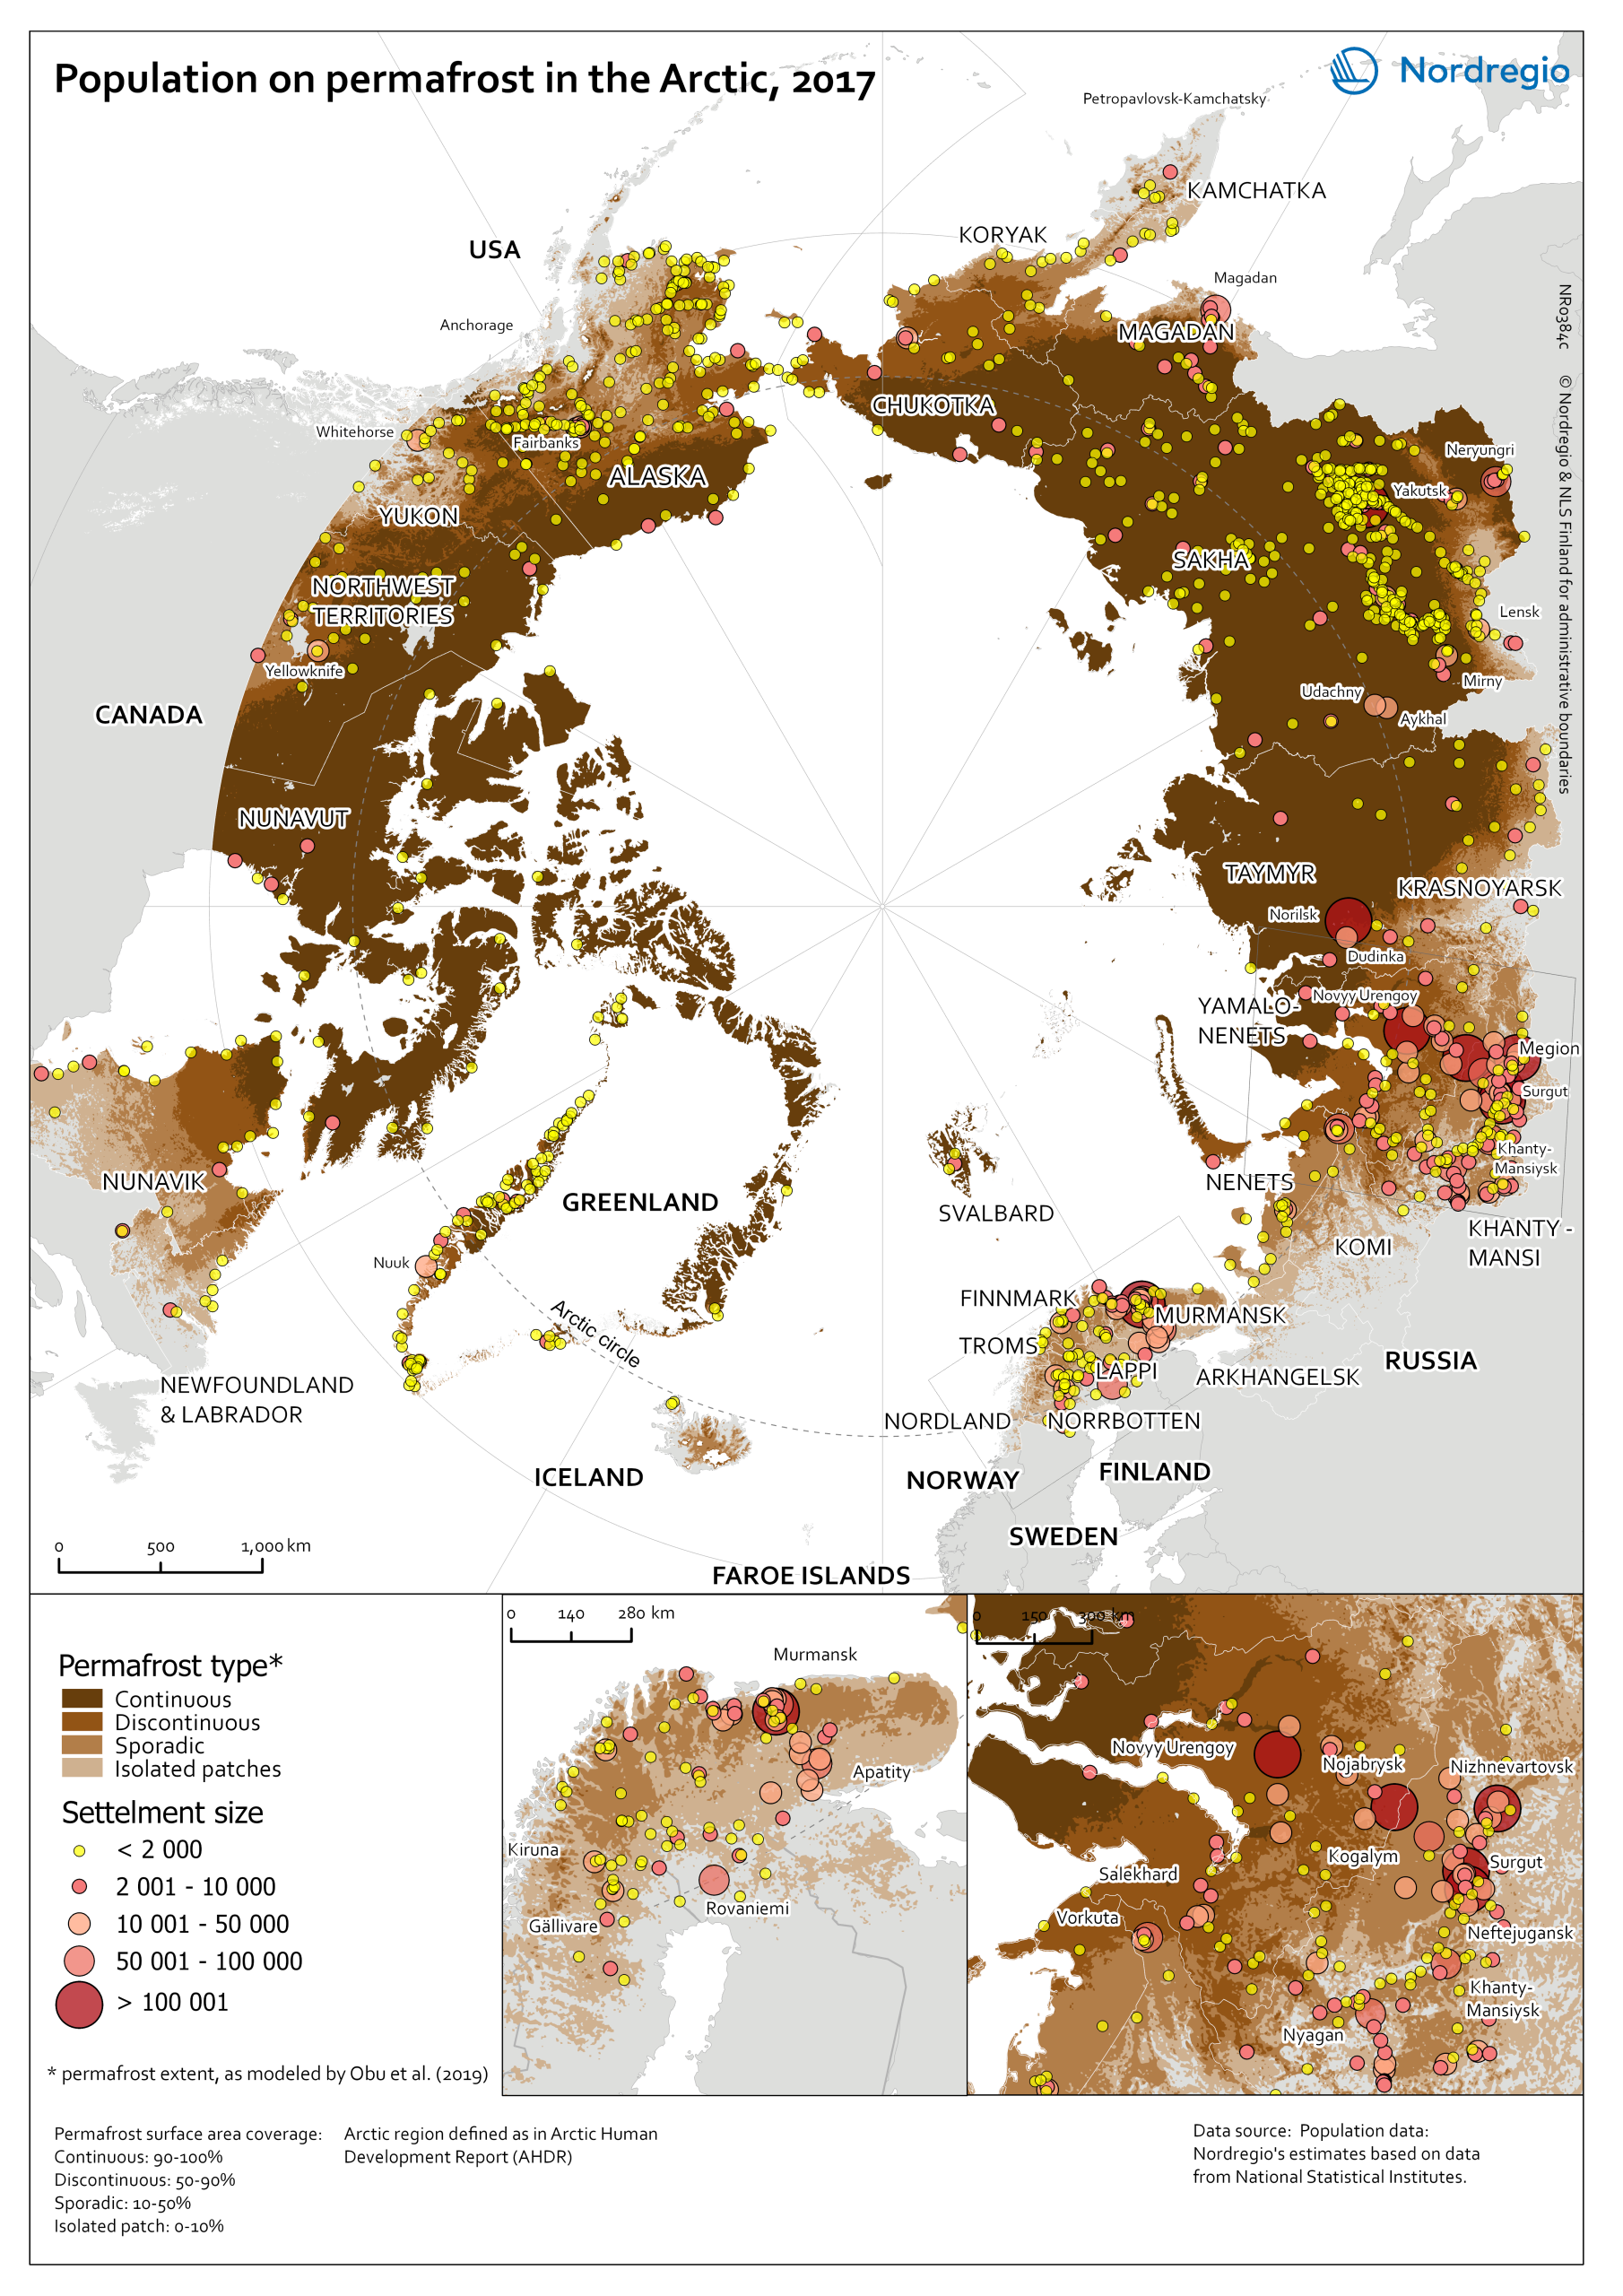
The map shows the share of the population by settlements and by type of permafrost in the Arctic region in 2017.
12 September, 2025
The colors and size of the circles indicate the settlement size. The Settlements with less than 2 000 inhabitants are shown in yellow, larger settlements are shown in shares of red color. The size of the circle corresponds to the total population in 2017.
The shades of the brown color represent the permafrost type, as modelled by Obu at al. (2019). The darkest shade of brown stands for the continuous permafrost, less dark for the discontinuous permafrost, less dark for the sporadic permafrost, with the most pale brown color representing territories where permafrost found in the isolated patches.
The Arctic region definition is applied from the “Arctic Human Development Report(AHDR)”.
Cartographer / GIS Analyst
All images are the property of Nordregio. They may be freely used as long as the logo of Nordregio is clearly visible and the source is cited accordingly. Please give also the cartographer/designer/author credit and give full recognition to the data sources if named in the graphic.
Source: Nordregio at www.nordregio.org