68 Maps
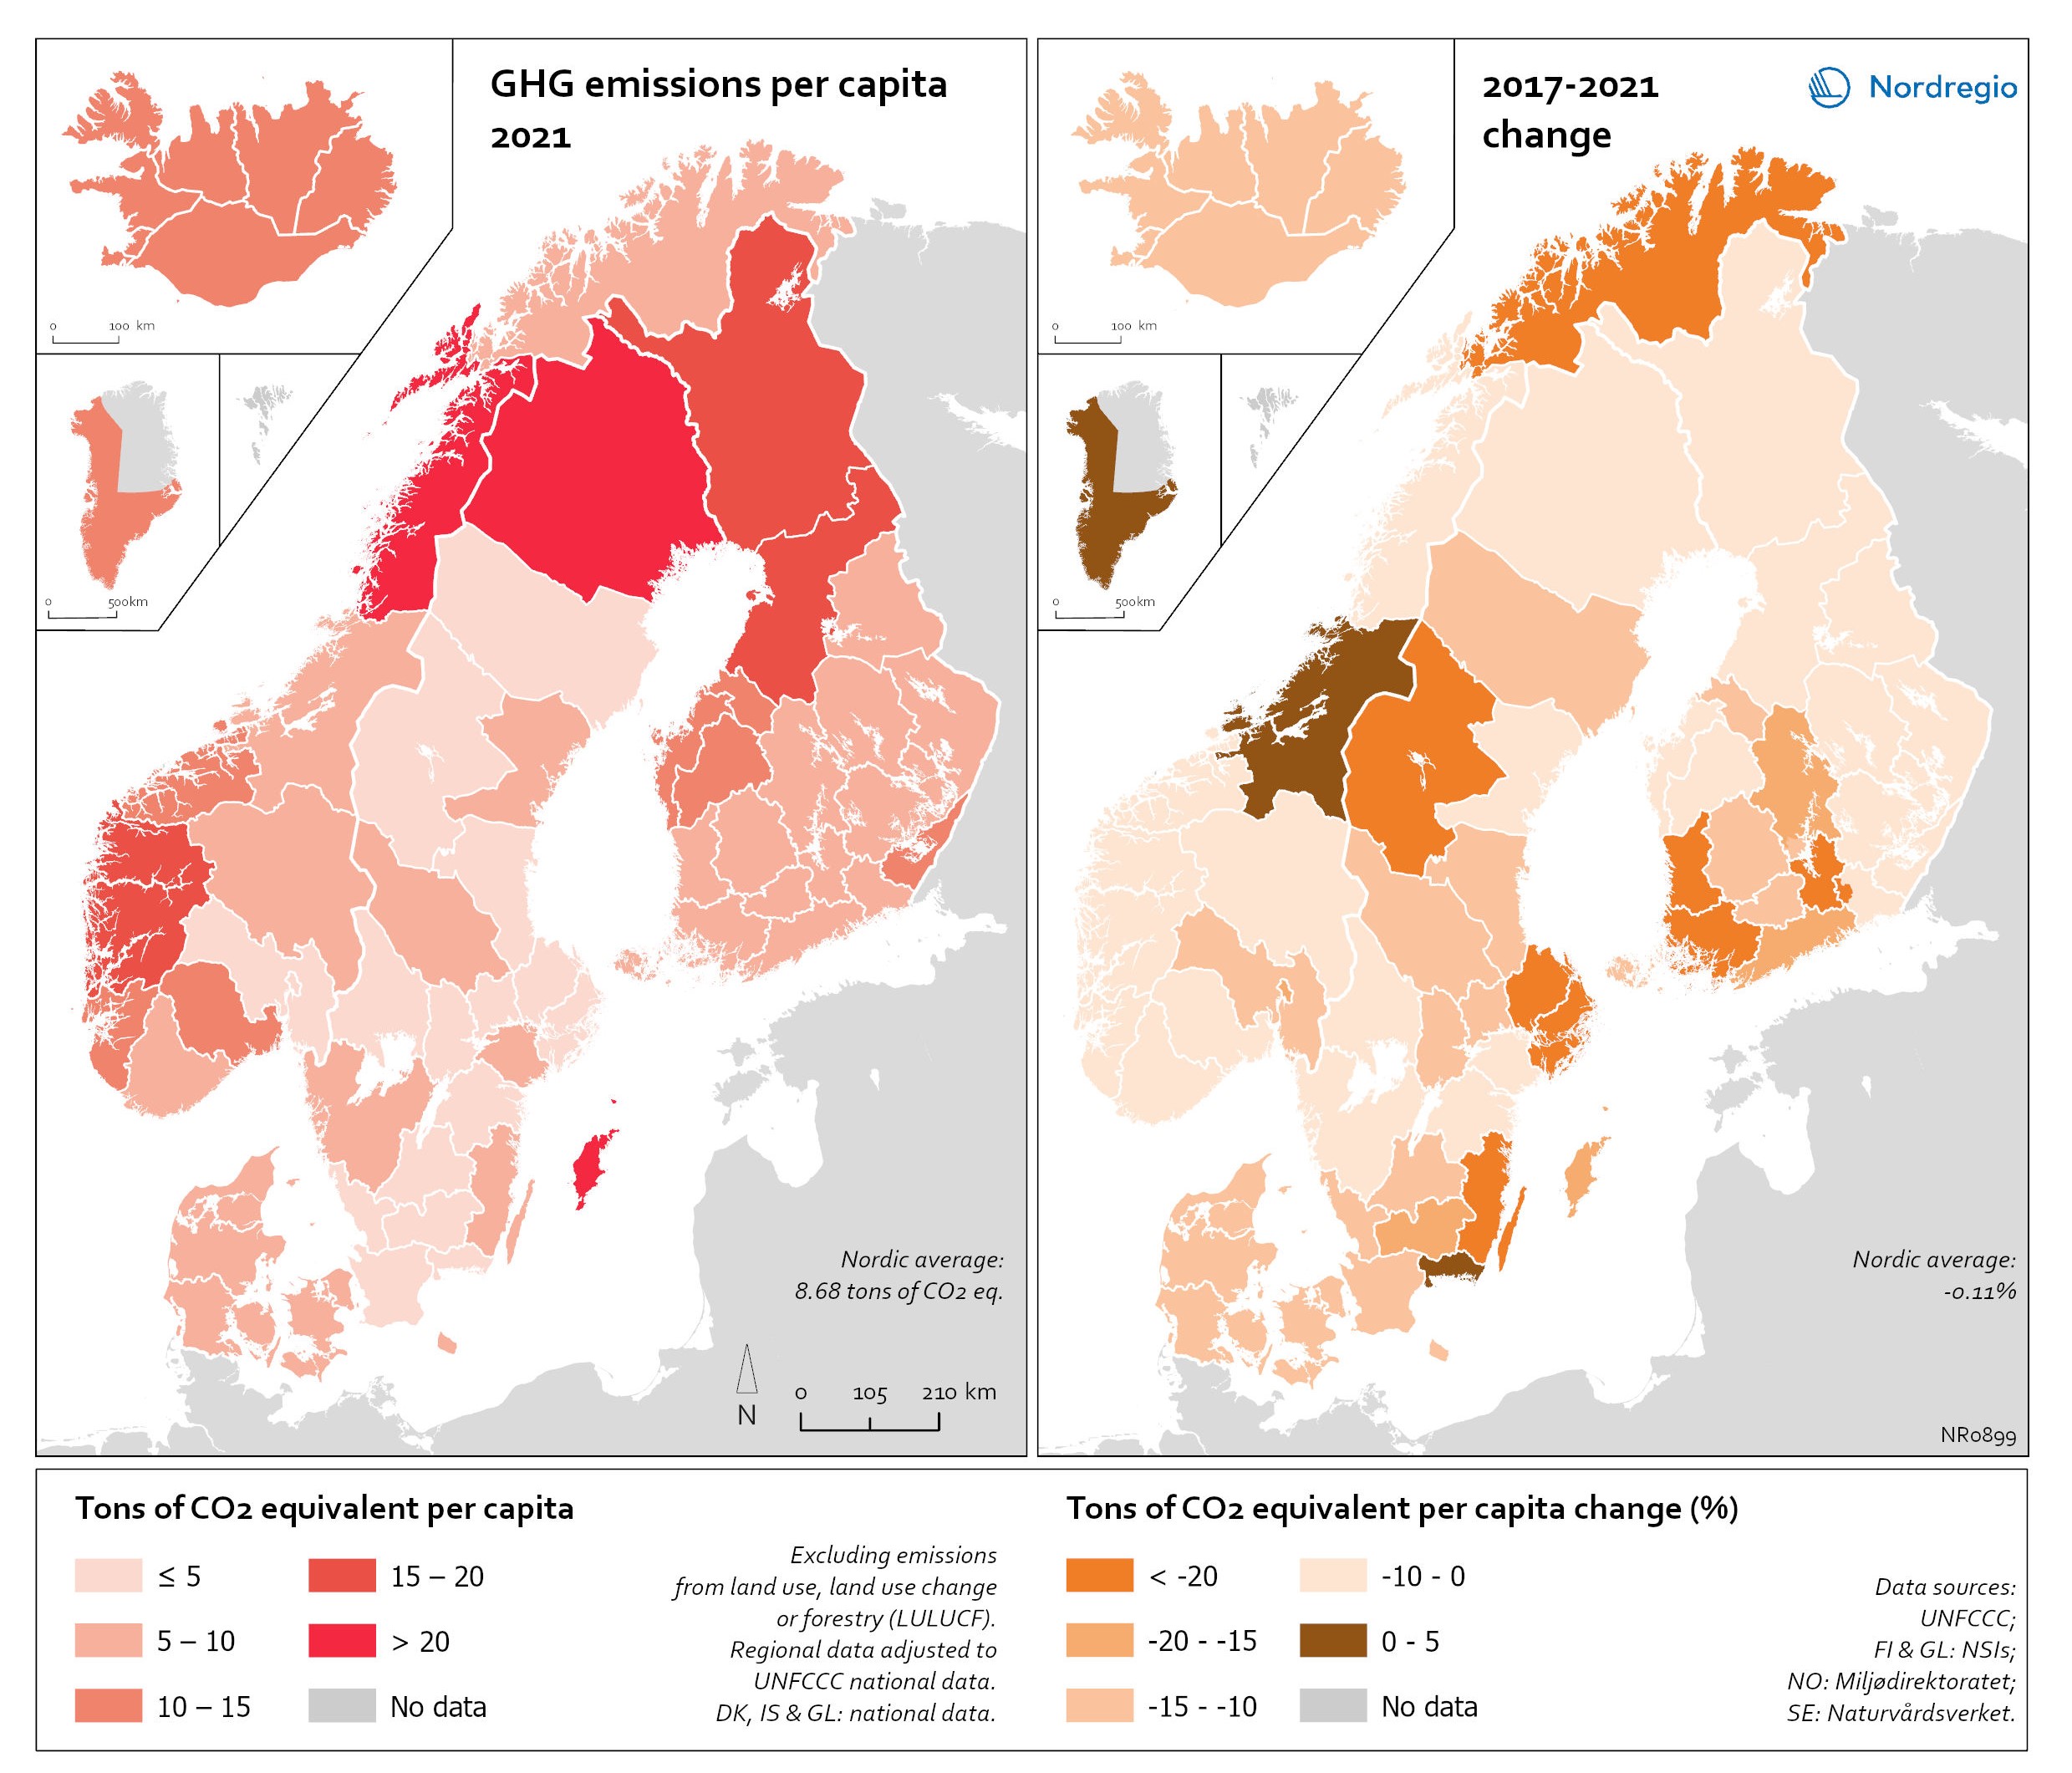
Regional GHG emissions per capita in 2021 and change 2017-2021 on a territorial basis
The data excludes emissions from land use, land use change or forestry (LULUCF). The regional data has been adjusted to UNFCCC national data. The data for Denmark, Iceland and Greenland is on national level. It should be noted that displaying emissions on a territorial basis may be skewed due to the inter-regional dynamics of energy processes, natural resource distributions and concentrations of industrial activities. From 2017 to 2021, the Nordic regions cut their per-capita GHG emissions by on average 11.3%, with an overall Nordic average fall of 8.7% over the same period. In regions historically reliant on fossil fuels for heat and power generation, emissions have continued to decline. This trend is evident in Denmark, as well as in Southern Sweden and Southern Finland – densely populated areas that have taken steps toward expanding district heating coverage and reducing carbon intensity. The largest decrease in GHG emissions per capita was found in Troms and Finnmark, with a 42.3% decrease, Satakunta with a 30.2% decrease and Päijät-Häme – Päijänne-Tavastland with a 29.2% decrease. Only three regions (Greenland, Trøndelag and Blekinge) saw an increase in GHG emissions per capita. At an aggregated level, industrial-related emissions decreased throughout the Nordic Region, but this trend does not hold true for regions in Norway with intensive offshore oil and gas operations. For instance, Nordland, Vestland, Møre og Romsdal, Vestfold and Telemark exhibited the highest per capita emissions in 2021. Between 2017 and 2021, emissions were increasing in many Norwegian regions with intensive offshore oil and gas activity, but also in Norrbotten in Sweden (21.2 tonnes of CO2 equivalent per capita) and Gotland (33.6 tonnes of CO2 equivalent per capita) due to intensive activity in the metal and cement industries, respectively, as well as in several Finnish regions. At the other end of the scale, the…
 2025 April
 - Environment
- Nordic Region
Electricity production 2021
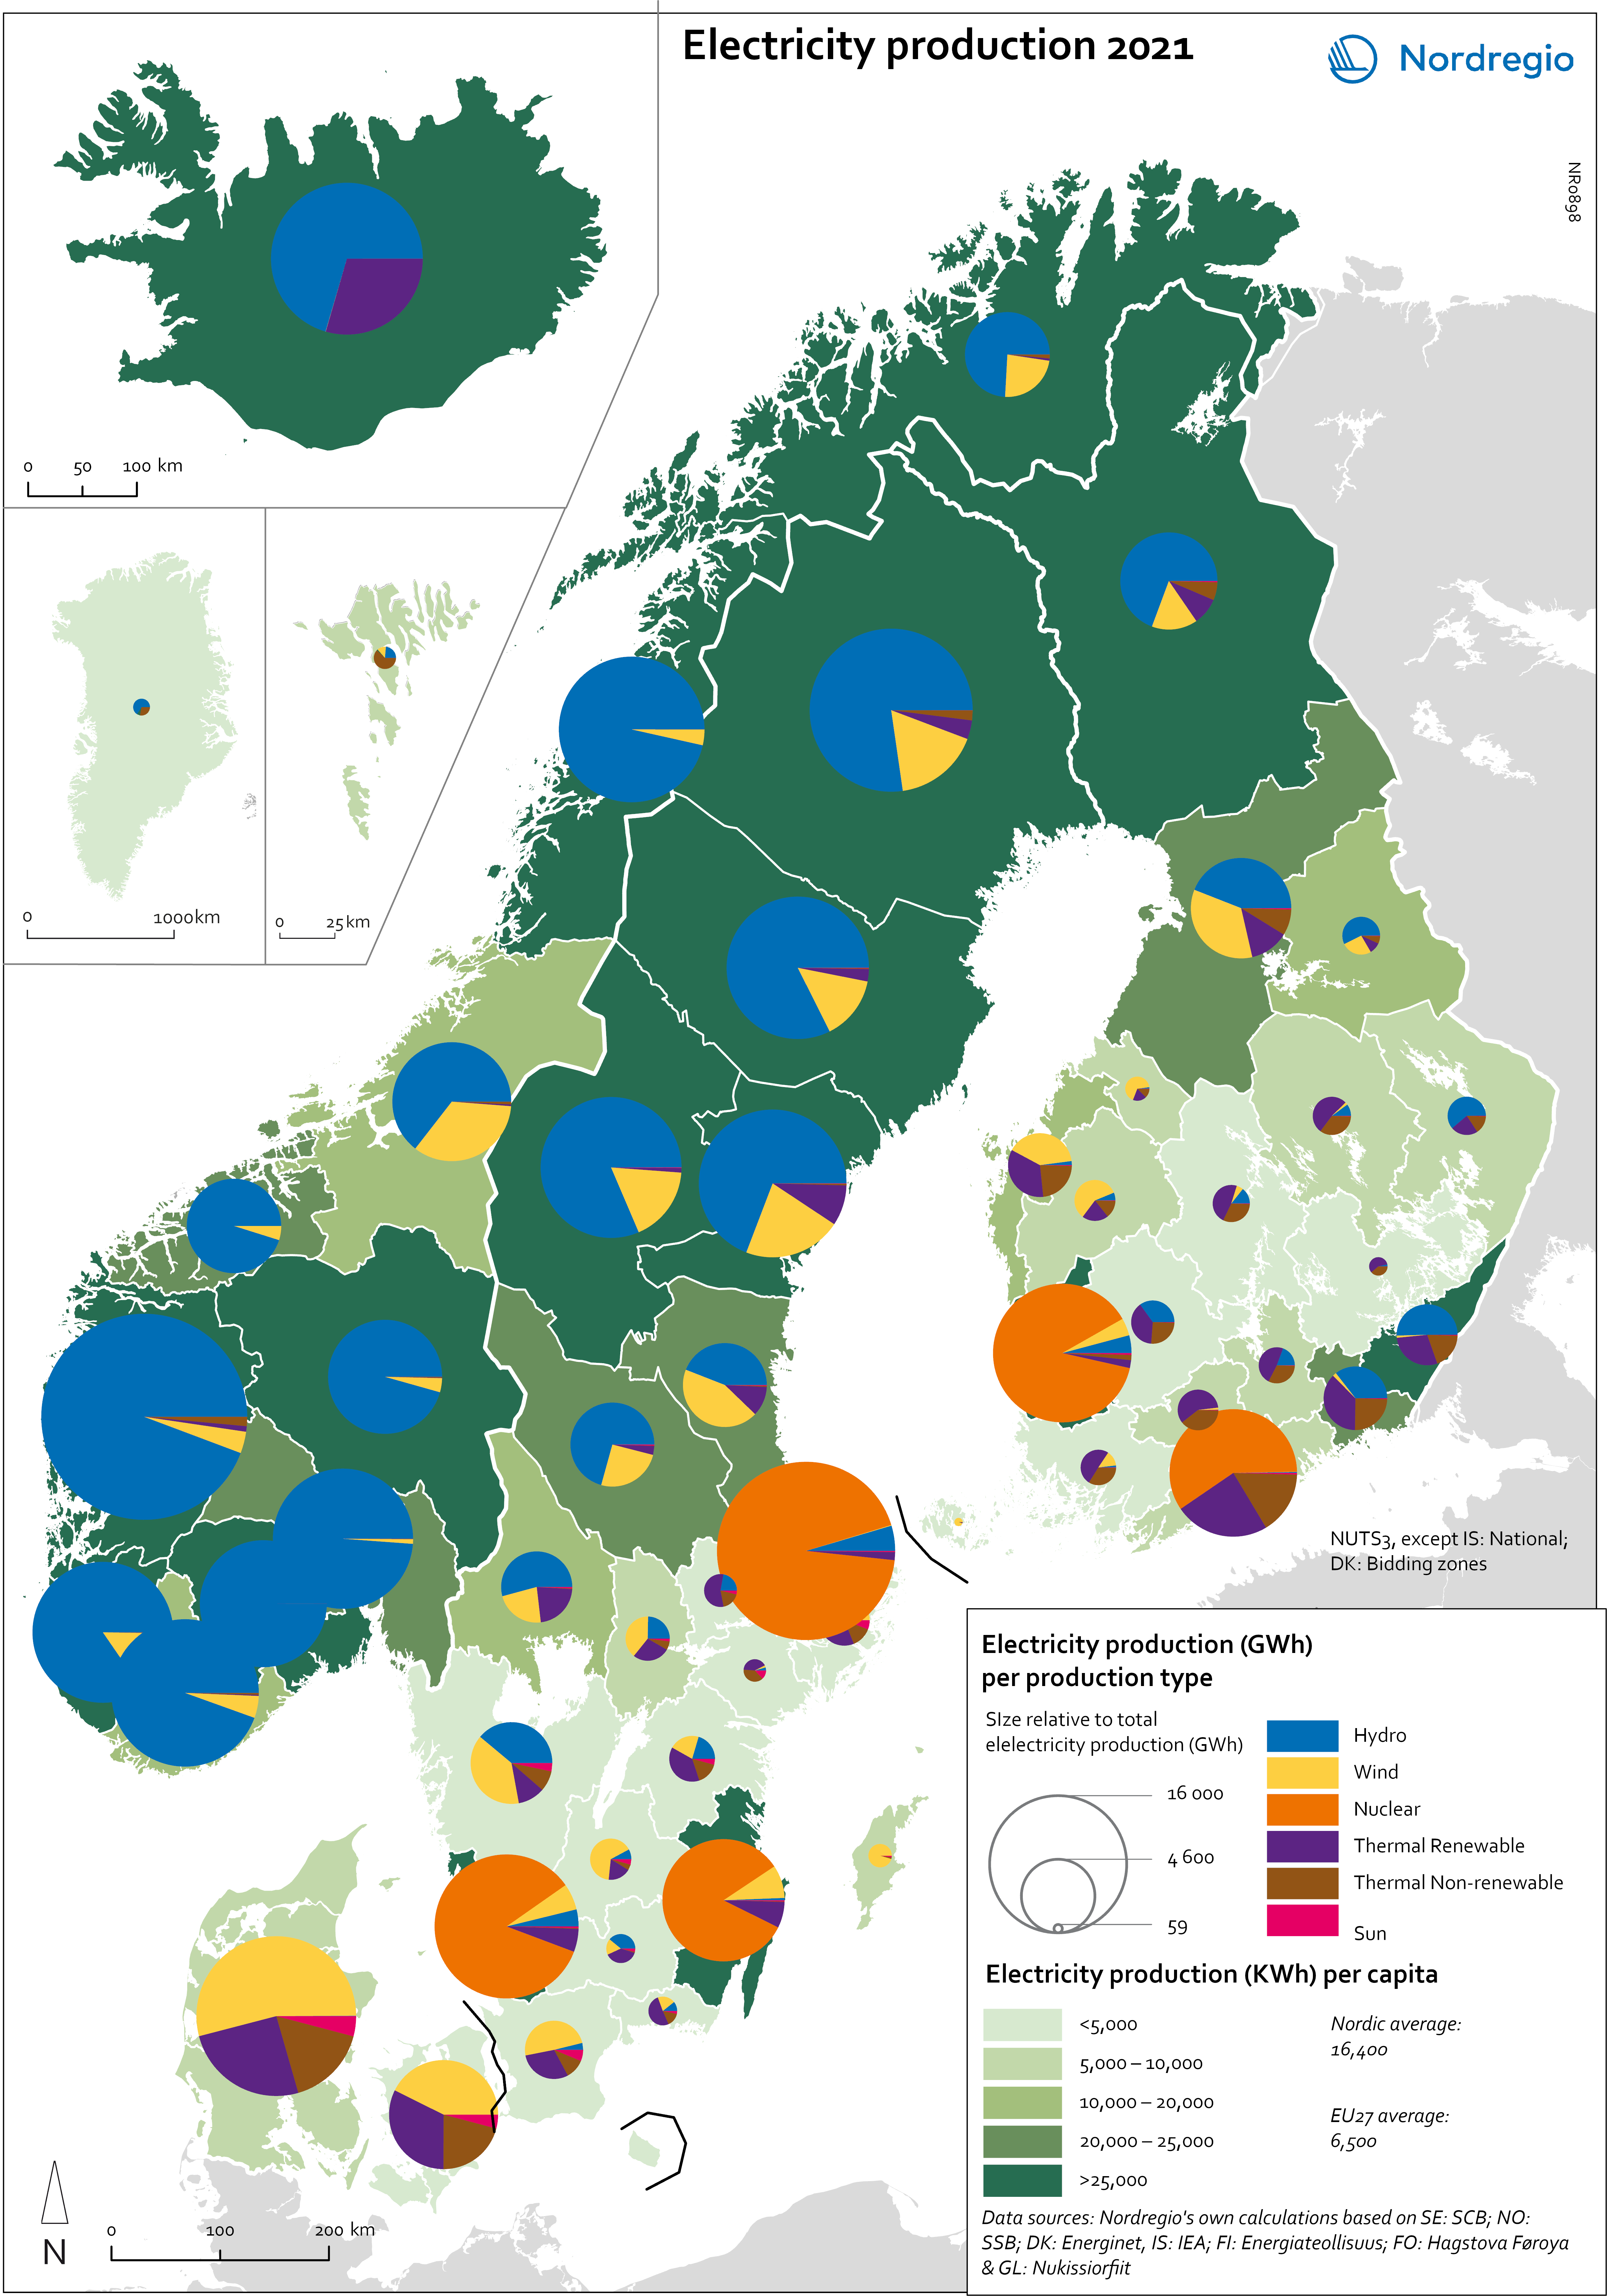
This map shows the spatial distribution of Nordic electricity production per capita, by volume and source type in the Nordic Region in 2021. The data is presented at a regional level, except for Iceland (national level) and Denmark (bidding zones). The circles represent electricity production in GWh, while the green shades indicate electricity production per capita (kWh). Finally, the colour of the circles denotes the source of electricity. The Nordic Region overall has a high electricity production per capita; in fact, Iceland and Norway have the world’s highest electricity production per capita. The electricity mix in 2021 was 96% fossil-free – 73% from renewables (mainly hydropower) and 17% from nuclear power. In 2000 85% of the electricity production was fossile-free. Still there are clear spatial differences in the electricity production. Firstly, we see the high amount of electricity being produced for the five nuclear facilities in Sweden and Finland. Secondly, a substantial volume of hydro-electricity is produced in southern Norway, throughout Iceland, Northern Sweden and Northern Finland. As a result, over half of Nordic electricity is produced from hydropower. Wind power is the source of electricity that has been growing the most during the last two decades, from 1.2% in 2000 to 14% in 2021. The regions with the highest electricity production per capita are in Iceland, Northern Sweden, and Northern and Western Norway. Both Finland and Denmark are net importers of electricity, but both countries have rapidly transitioned away from fossil fuels. Cheap and fossil-free electricity is a prerequisite for the green transition and with growing industries within e.g. battery production, green steel and mining, the need for fossil-free electricity is expected to increase in the coming decades.
- 2025 April
- Environment
- Labour force
- Nordic Region
Greenhouse gas emissions intensity of employment in 2022
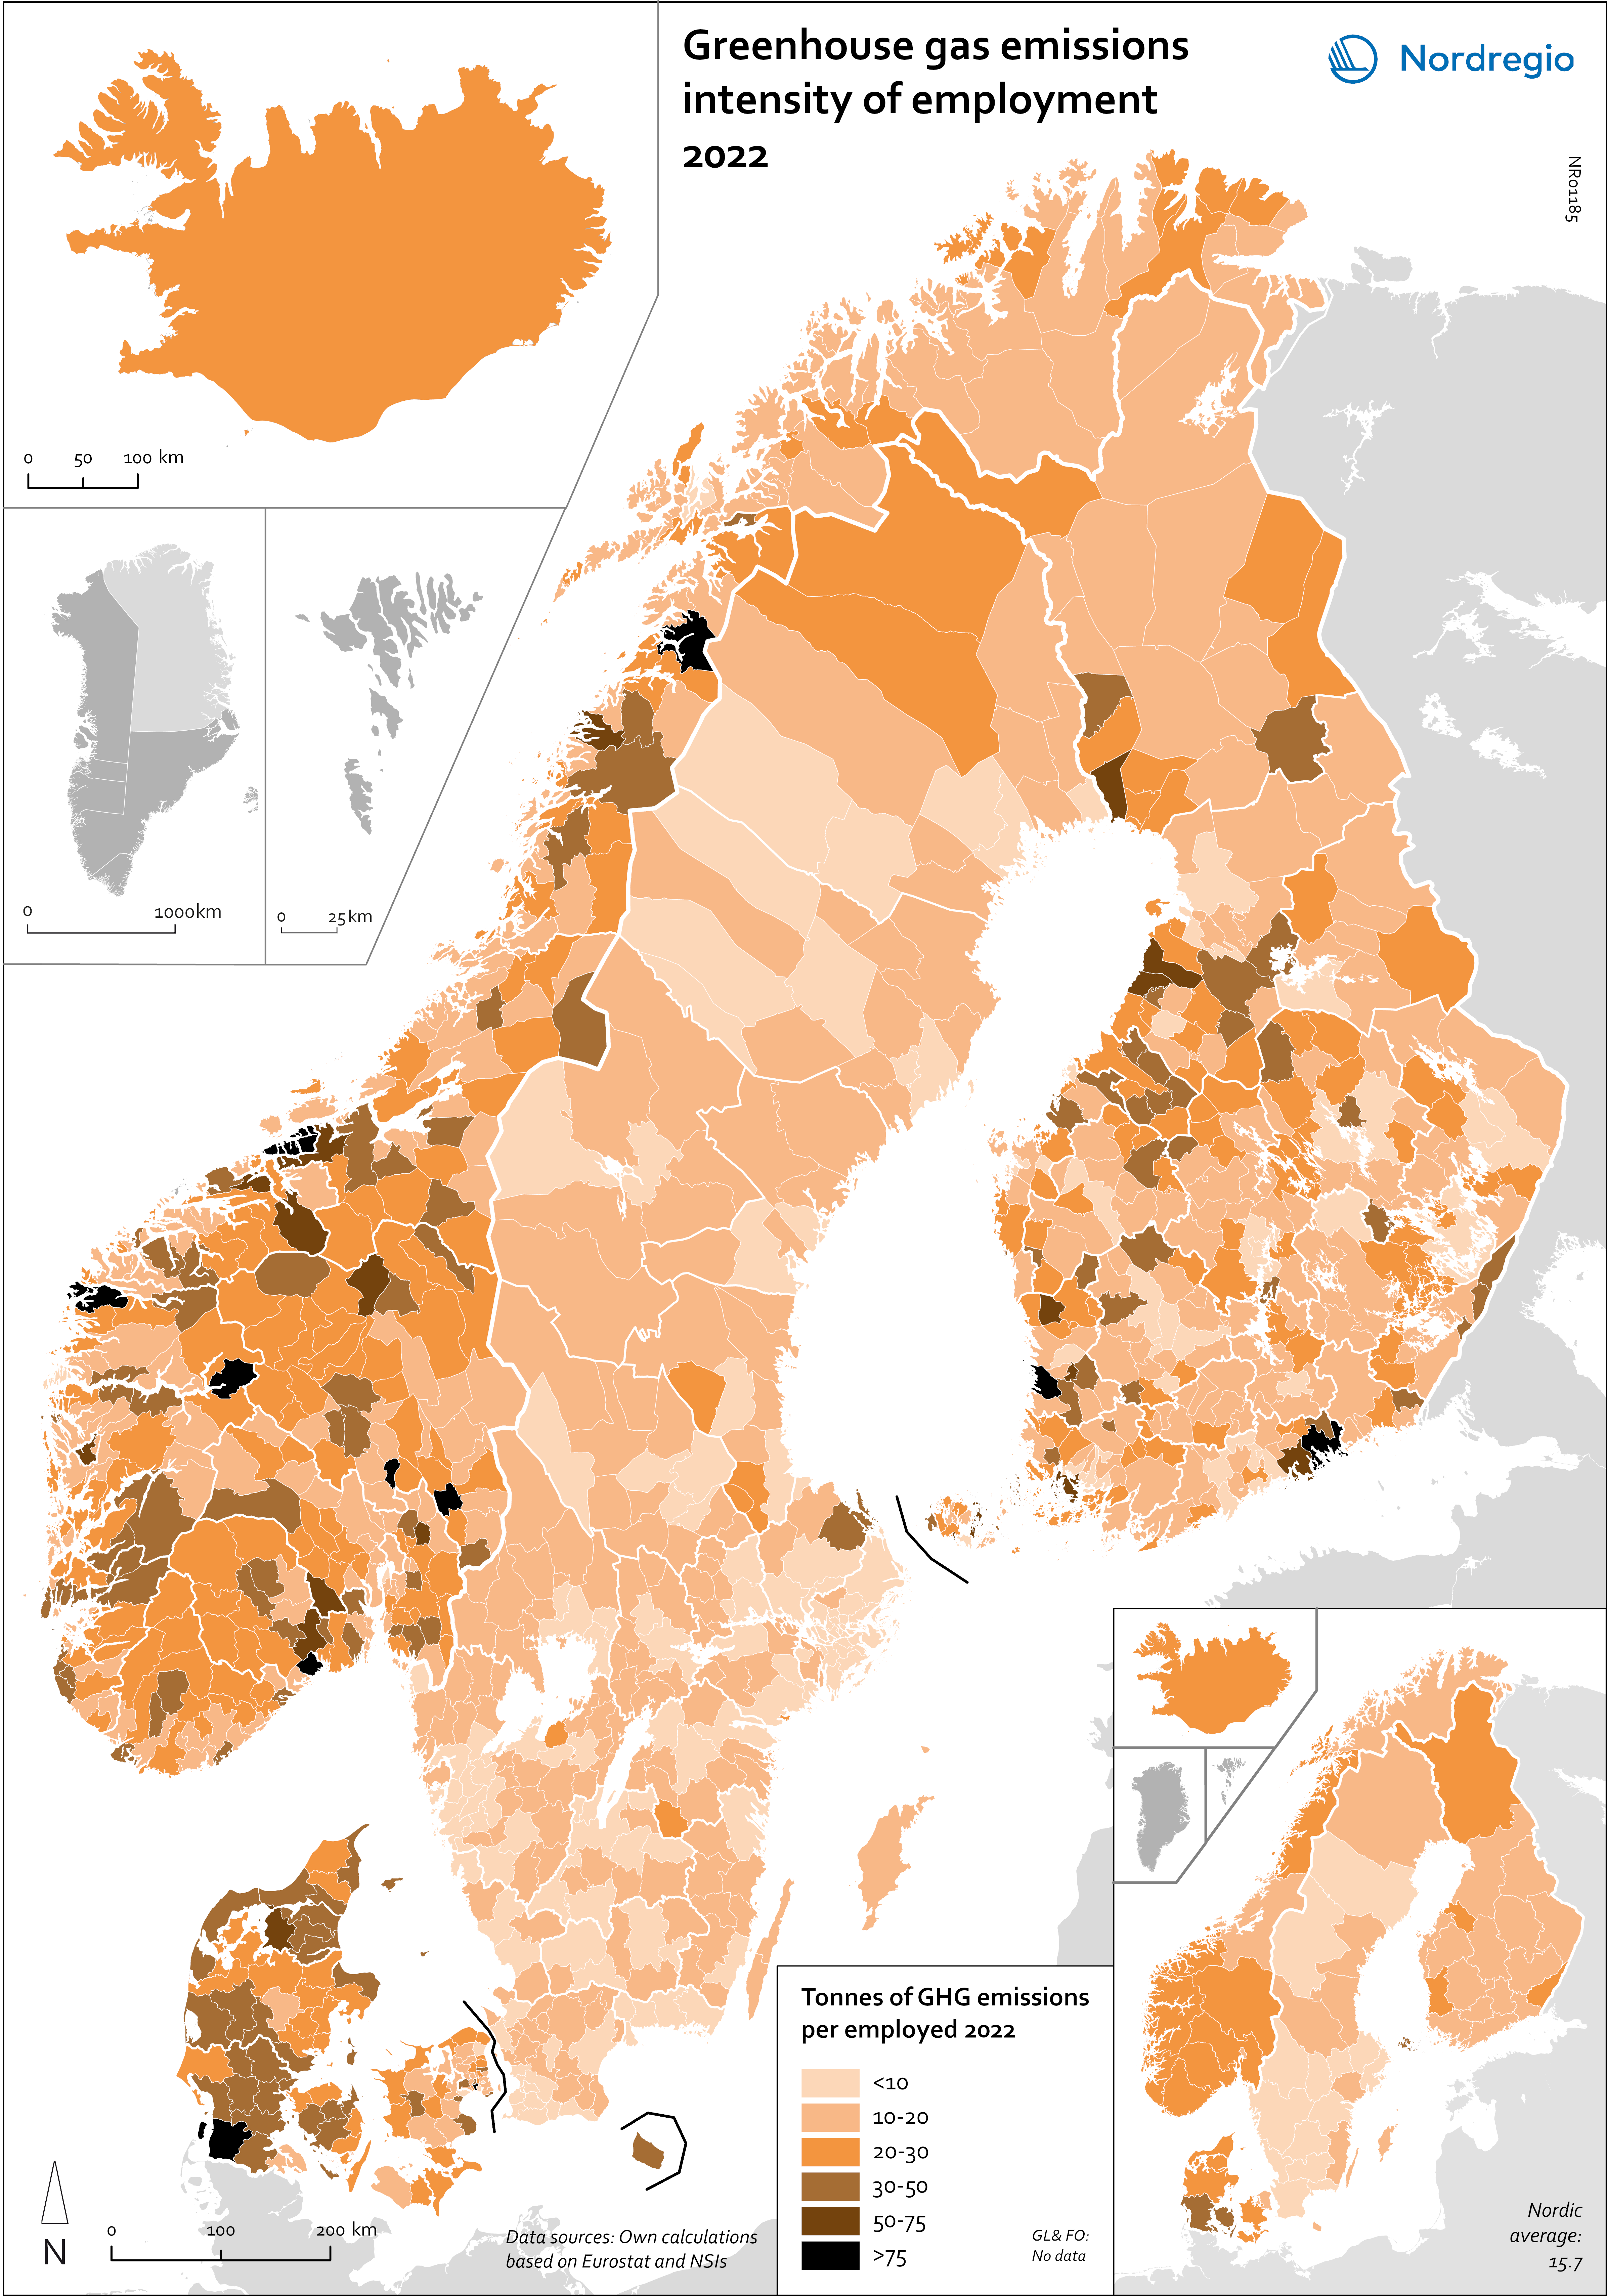
This map shows the tonnes of greenhouse gas emissions per person employed in Nordic municipalities (big map) and regions (small map) in 2022. The data for Iceland is presented at the national level, while no data was available for the Faroe Islands and Greenland. The map is based on data on emissions per sector and country from Eurostat and detailed employment by sector data from the Nordic statistical offices. By calculating the average emissions per person employed and per sector we could use municipal employment by sector data to assess the average emissions per person employed in each municipality. The results are an estimation based on the assumption that all jobs in the same sector have the same GHG emissions. In 2022, greenhouse gas (GHG) emissions per person employed in the Nordic Region were 15.7 tonnes. This is higher than the EU average of 13.5 tonnes. There are also fairly big differences between the Nordic countries, with higher emissions per person employed in Iceland (28.6), Denmark (23.1) and Norway (20.5) and lower emissions in Finland (15.7) and Sweden (8). On the other hand, the emissions per person employed have decreased faster in the Nordic Region than for the EU as a whole. In the last decade, emissions per person employed fell by 24% in the Nordic Region compared to the EU average of 22%. The biggest decrease (32%) was in Finland. The sectors with the highest emissions per worker vary slightly between the countries. In Sweden and Norway, the sector with by far the highest emissions per worker was the manufacture of petroleum coke and refined petroleum products. However, it should be noted that the number of workers in this sector is small. In Denmark, the highest emissions by person employed could be found in water transport; in Finland, in…
- 2025 April
- Environment
- Labour force
- Nordic Region
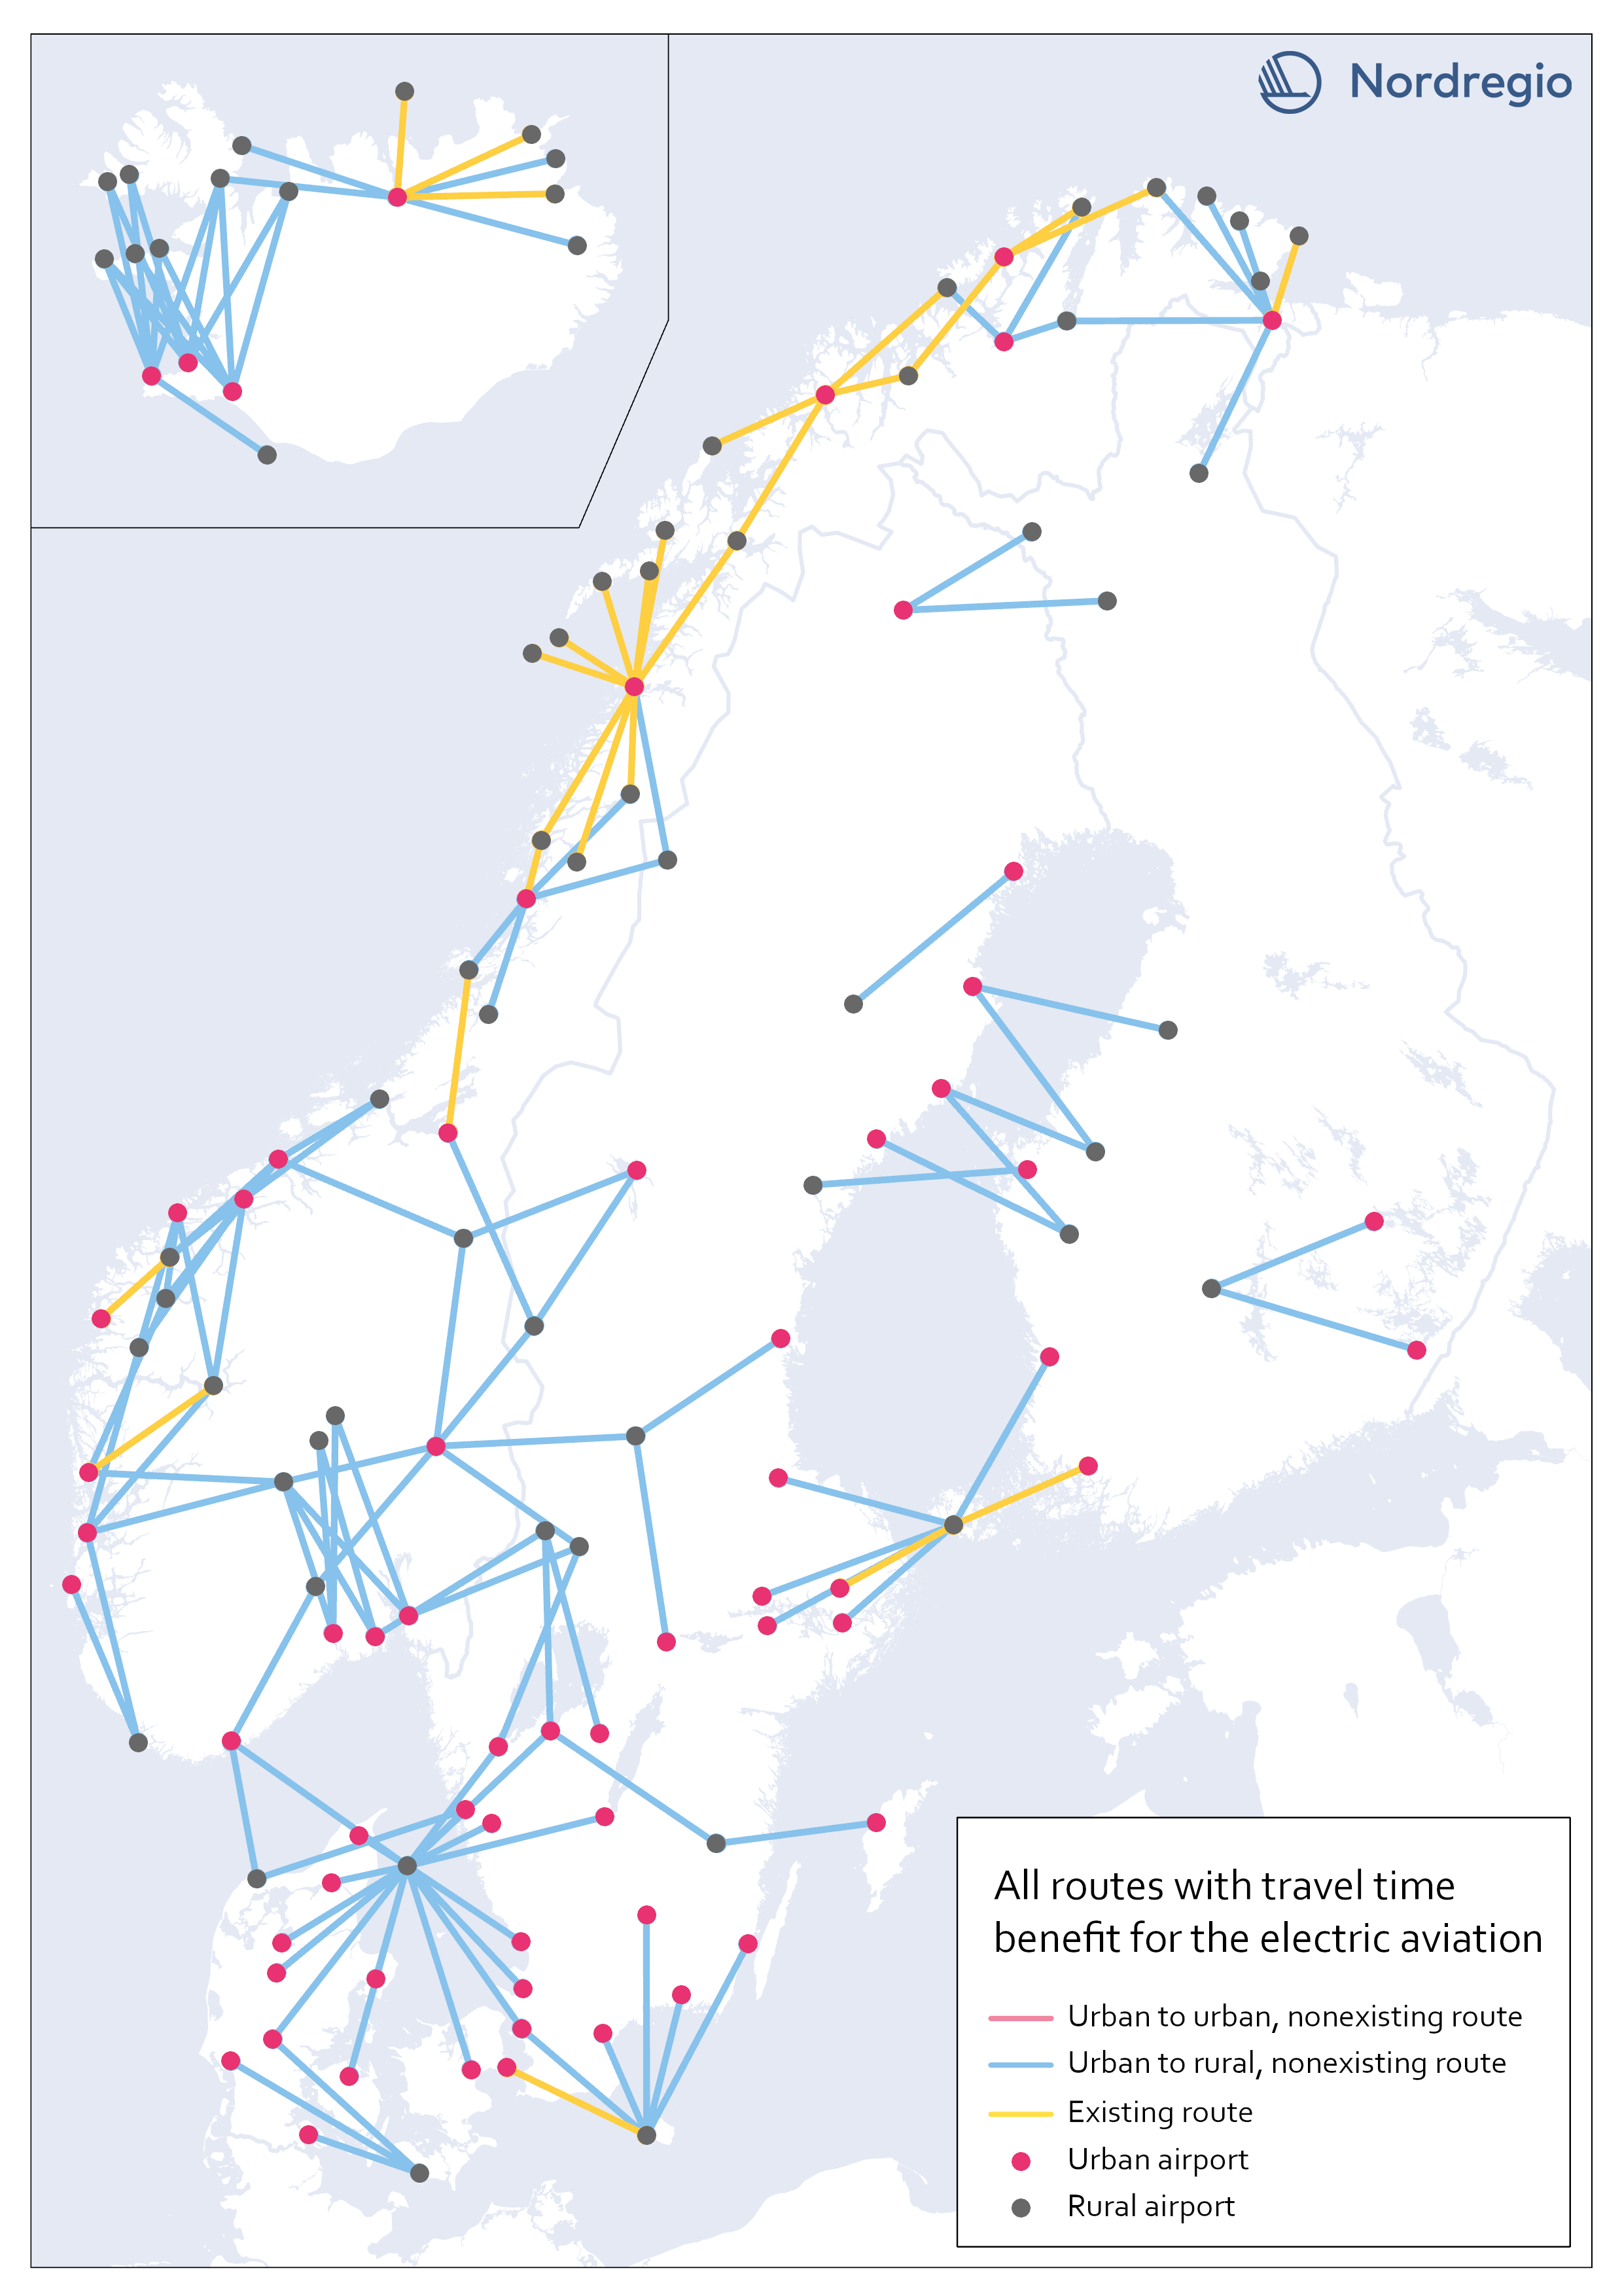
All routes with time benefit for electric aviation
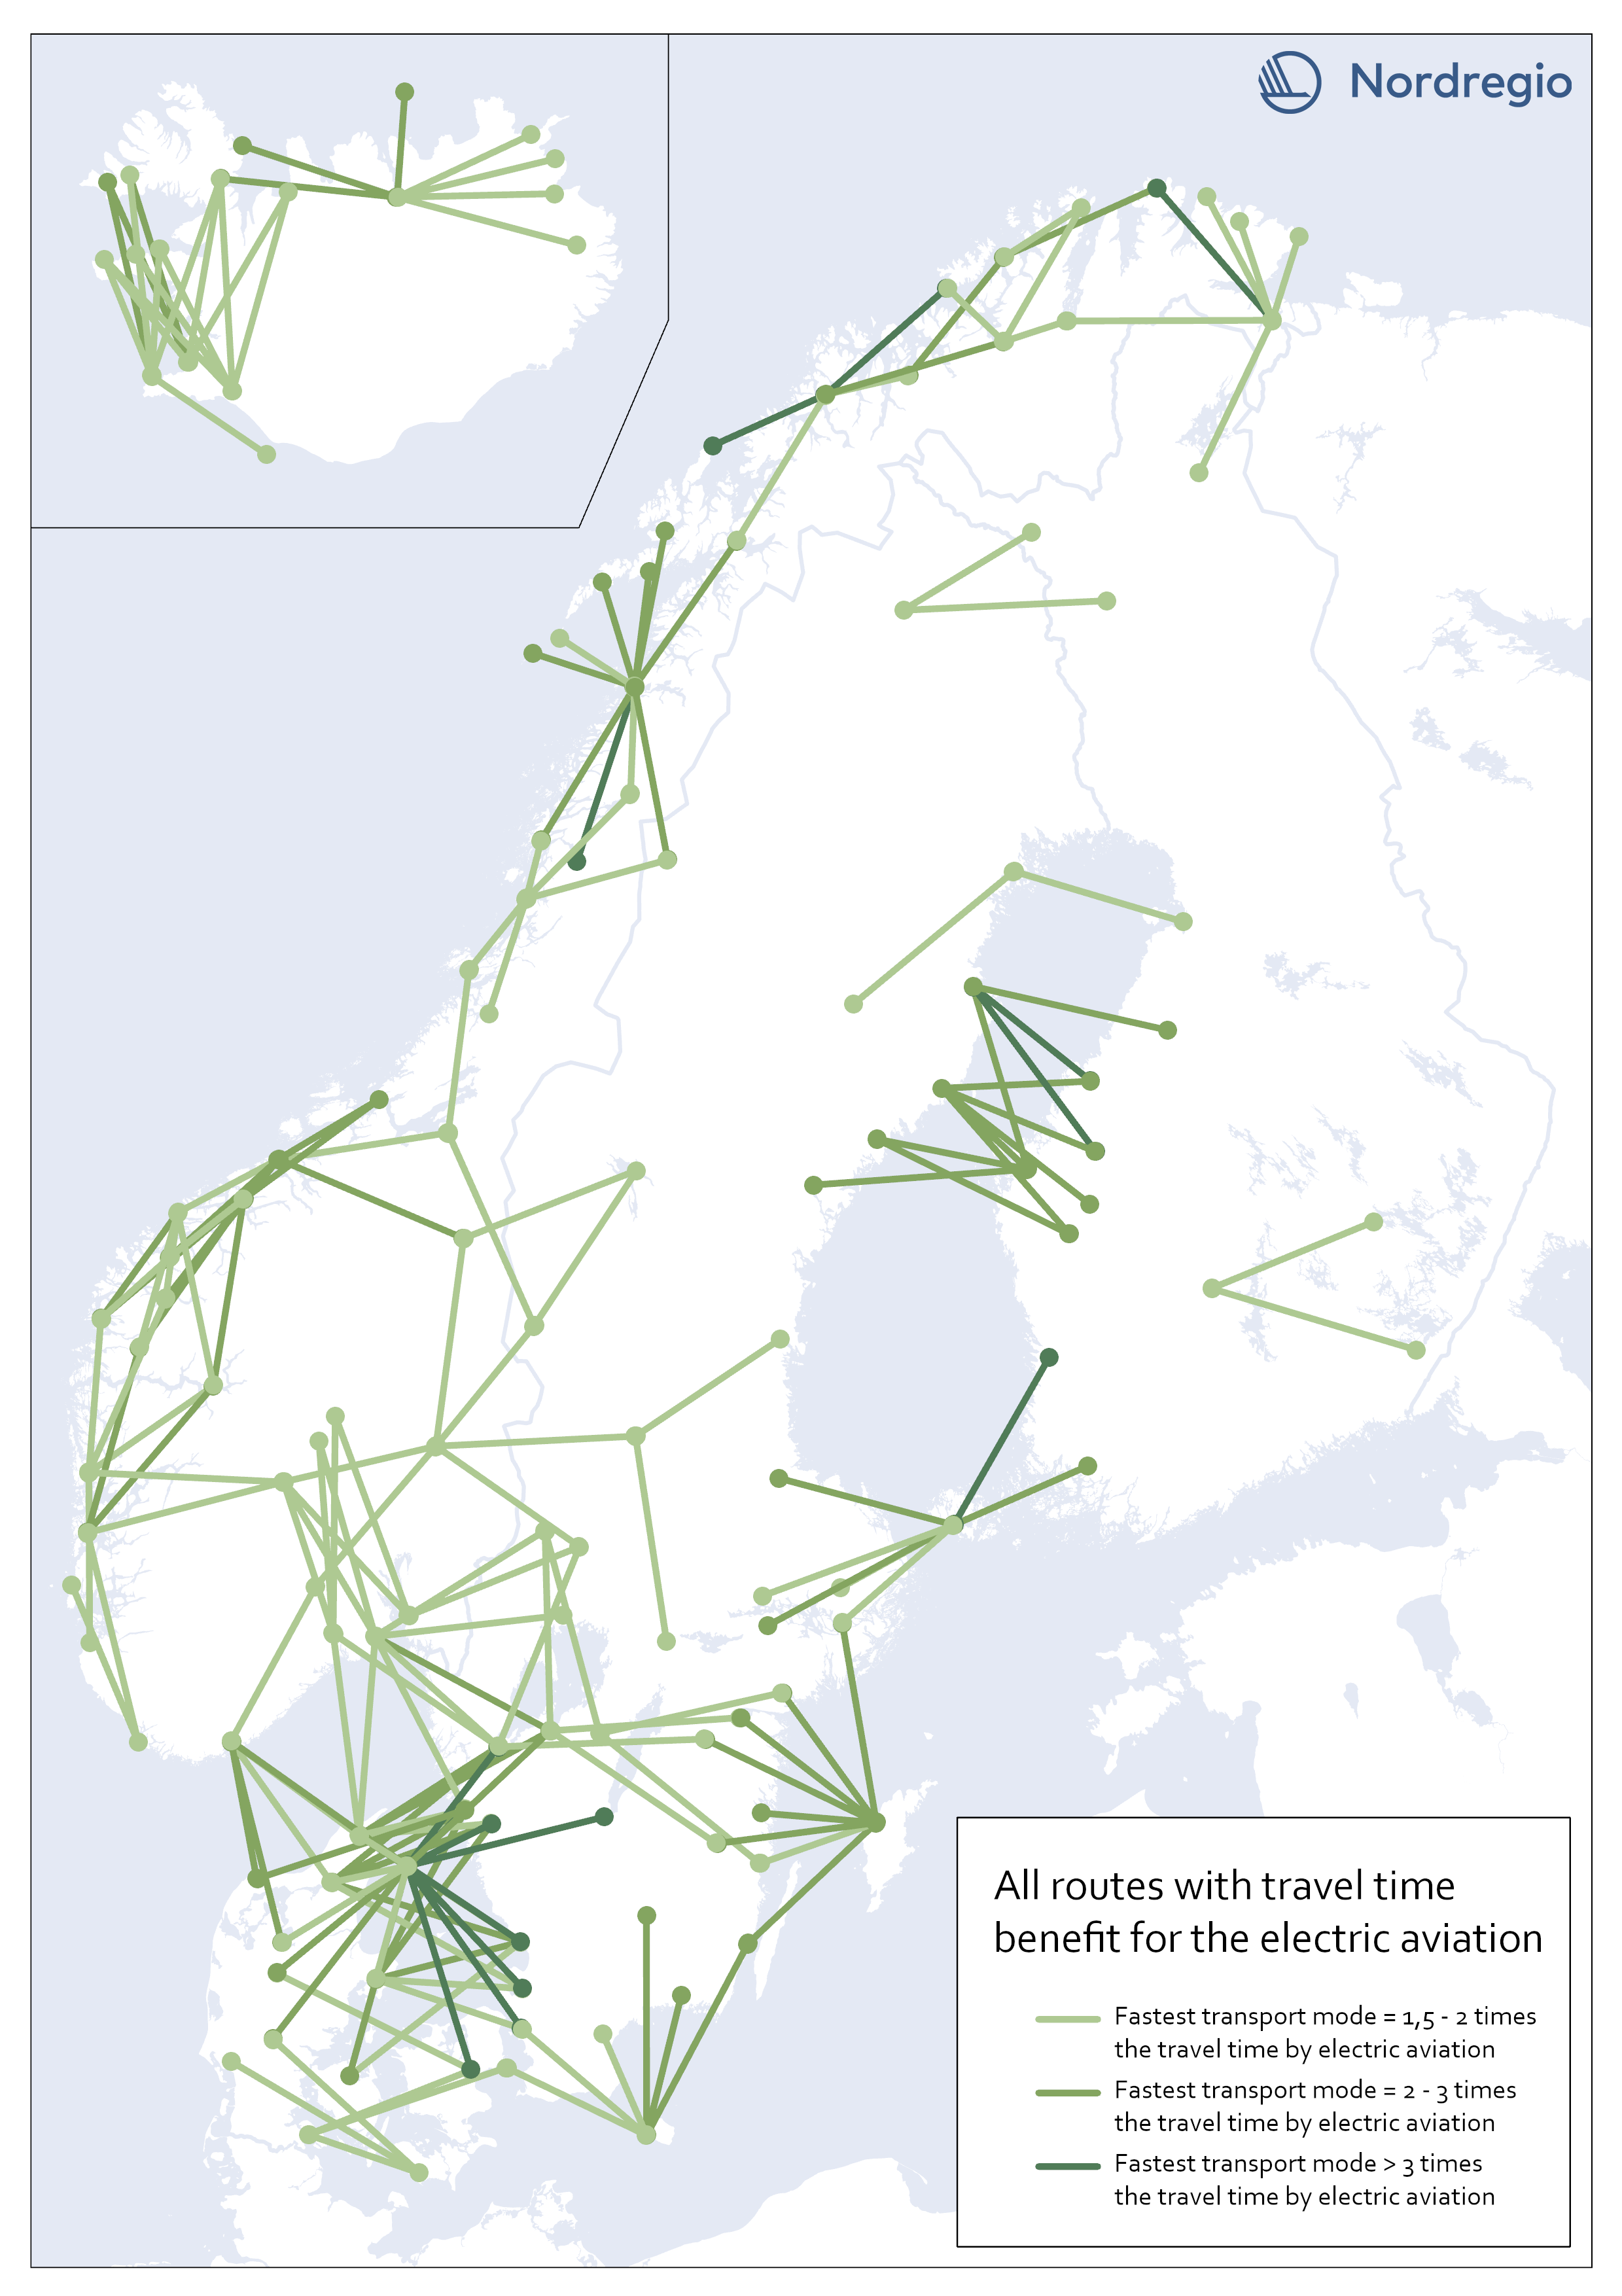
The map shows all routes in our sample with significant travel time benefit for electric aviation. They are 203 in total. A route has a significant travel time benefit if the travel time for both car and public transportation exceeded 1,5 times the travel time for electric aviation. I.e., if one of the existing transport modes is faster or up to 1,5 times the travel time for electric aviation, electric aviation does not have the potential to improve accessibility between the two destinations, according to our analysis.
- 2023 February
- Nordic Region
- Transport
Electric aviation time benefits between urban and rural areas
The map shows all routes between urban and rural areas where electric aviation has significant time benefits compared to other traffic modes. Yellow lines are already served by aviation, while blue color indicates non-existent routes where electric flight would reduce the travel time between destinations. Our motivation for focusing on urban-rural routes was based on the assumption that electric aviation can increase the access for rural areas to public facilities and job opportunities, as well as the possibility of connecting remote areas with national and international transport systems. The result, though, can only be understood in terms of travel time benefits between the areas, and thus reveals little about accessibility to mentioned opportunities. The following are examples of themes to be investigated further within the main project. Identify regional hubs Among others, the project FAIR (2022) has addressed the need to update the flight system to a more flexible aviation network, that meet travelers’ needs with smart mobility. This can be done by identifying demands and establishing regional hubs for electric aviation, which can serve remote and regional areas. The potential of Hamar and Bodö in Norway as regional hubs should be studied more closely.
- 2023 January
- Nordic Region
- Transport
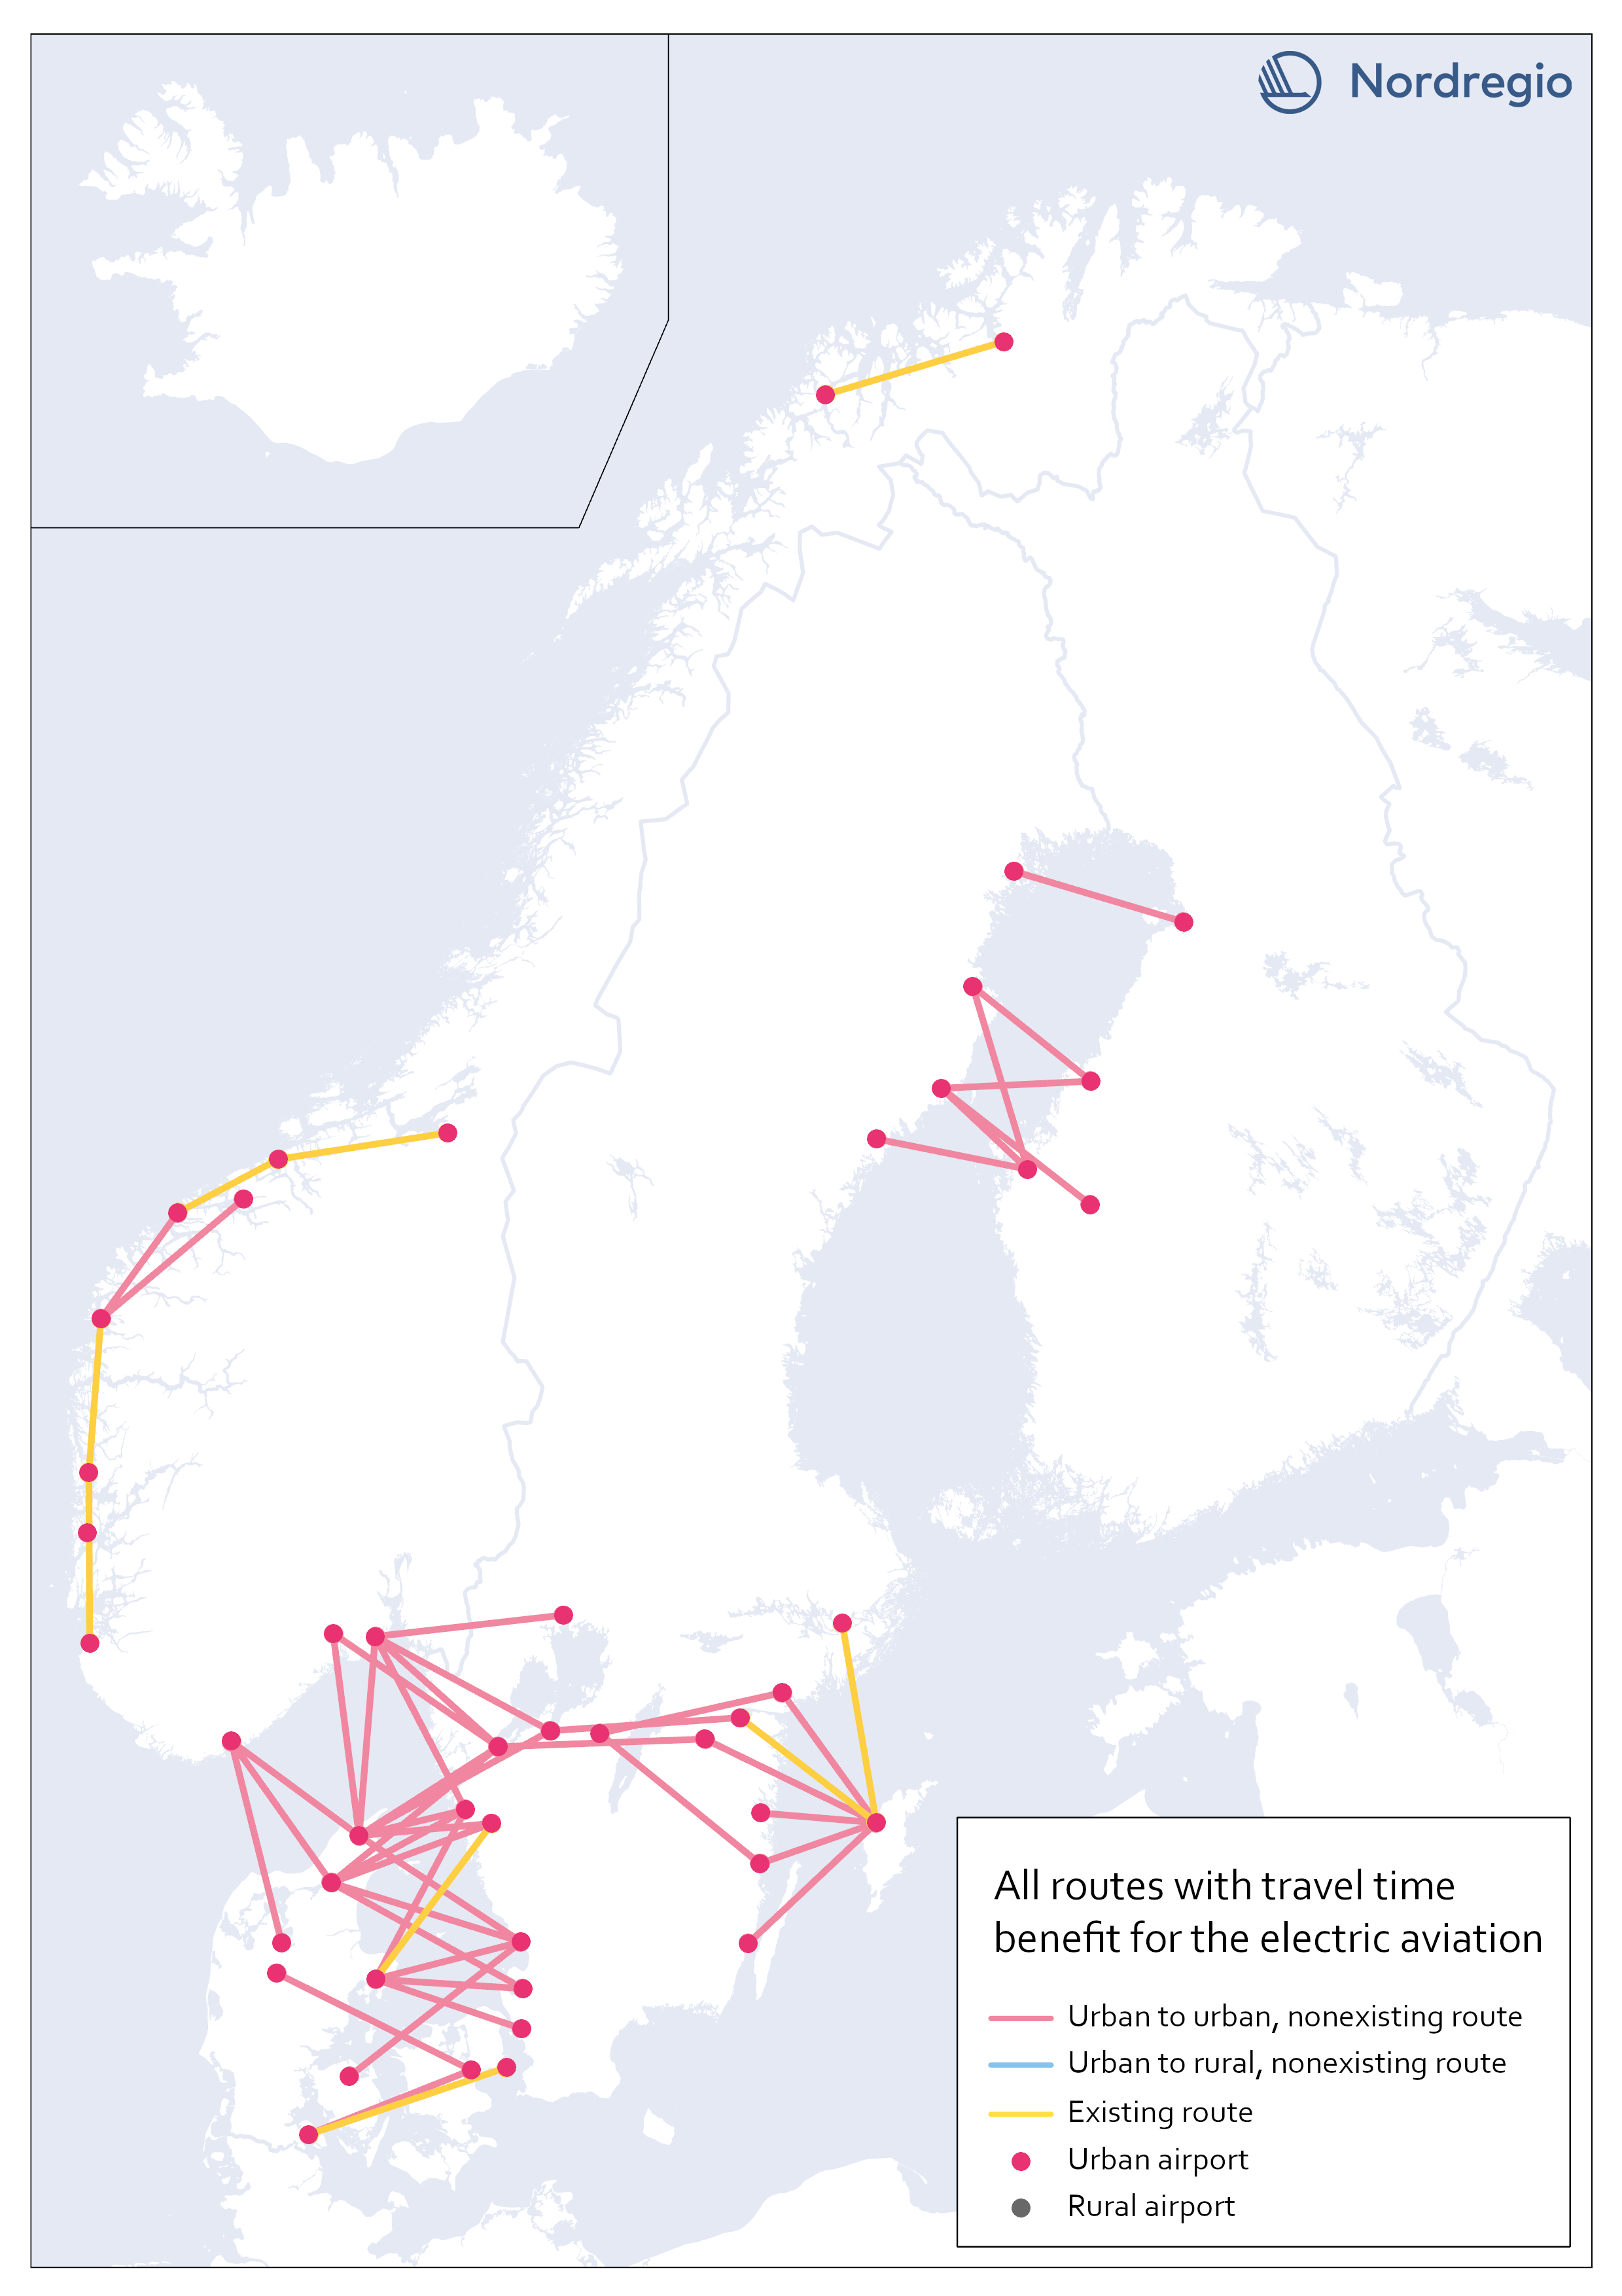
Electric aviation time benefits between urban areas separated by water
The map shows all routes between urban areas separated by water, and where electric aviation has significant time benefits compared to the fastest traffic mode. Yellow lines are already served by aviation, while red color indicates non-existent routes where electric flight would reduce the travel time between destinations. The result is in line with our assumptions, that there is a lack of fast connections between potential labor markets in urban areas, which are geographically close but separated by open water.
- 2023 January
- Nordic Region
- Transport
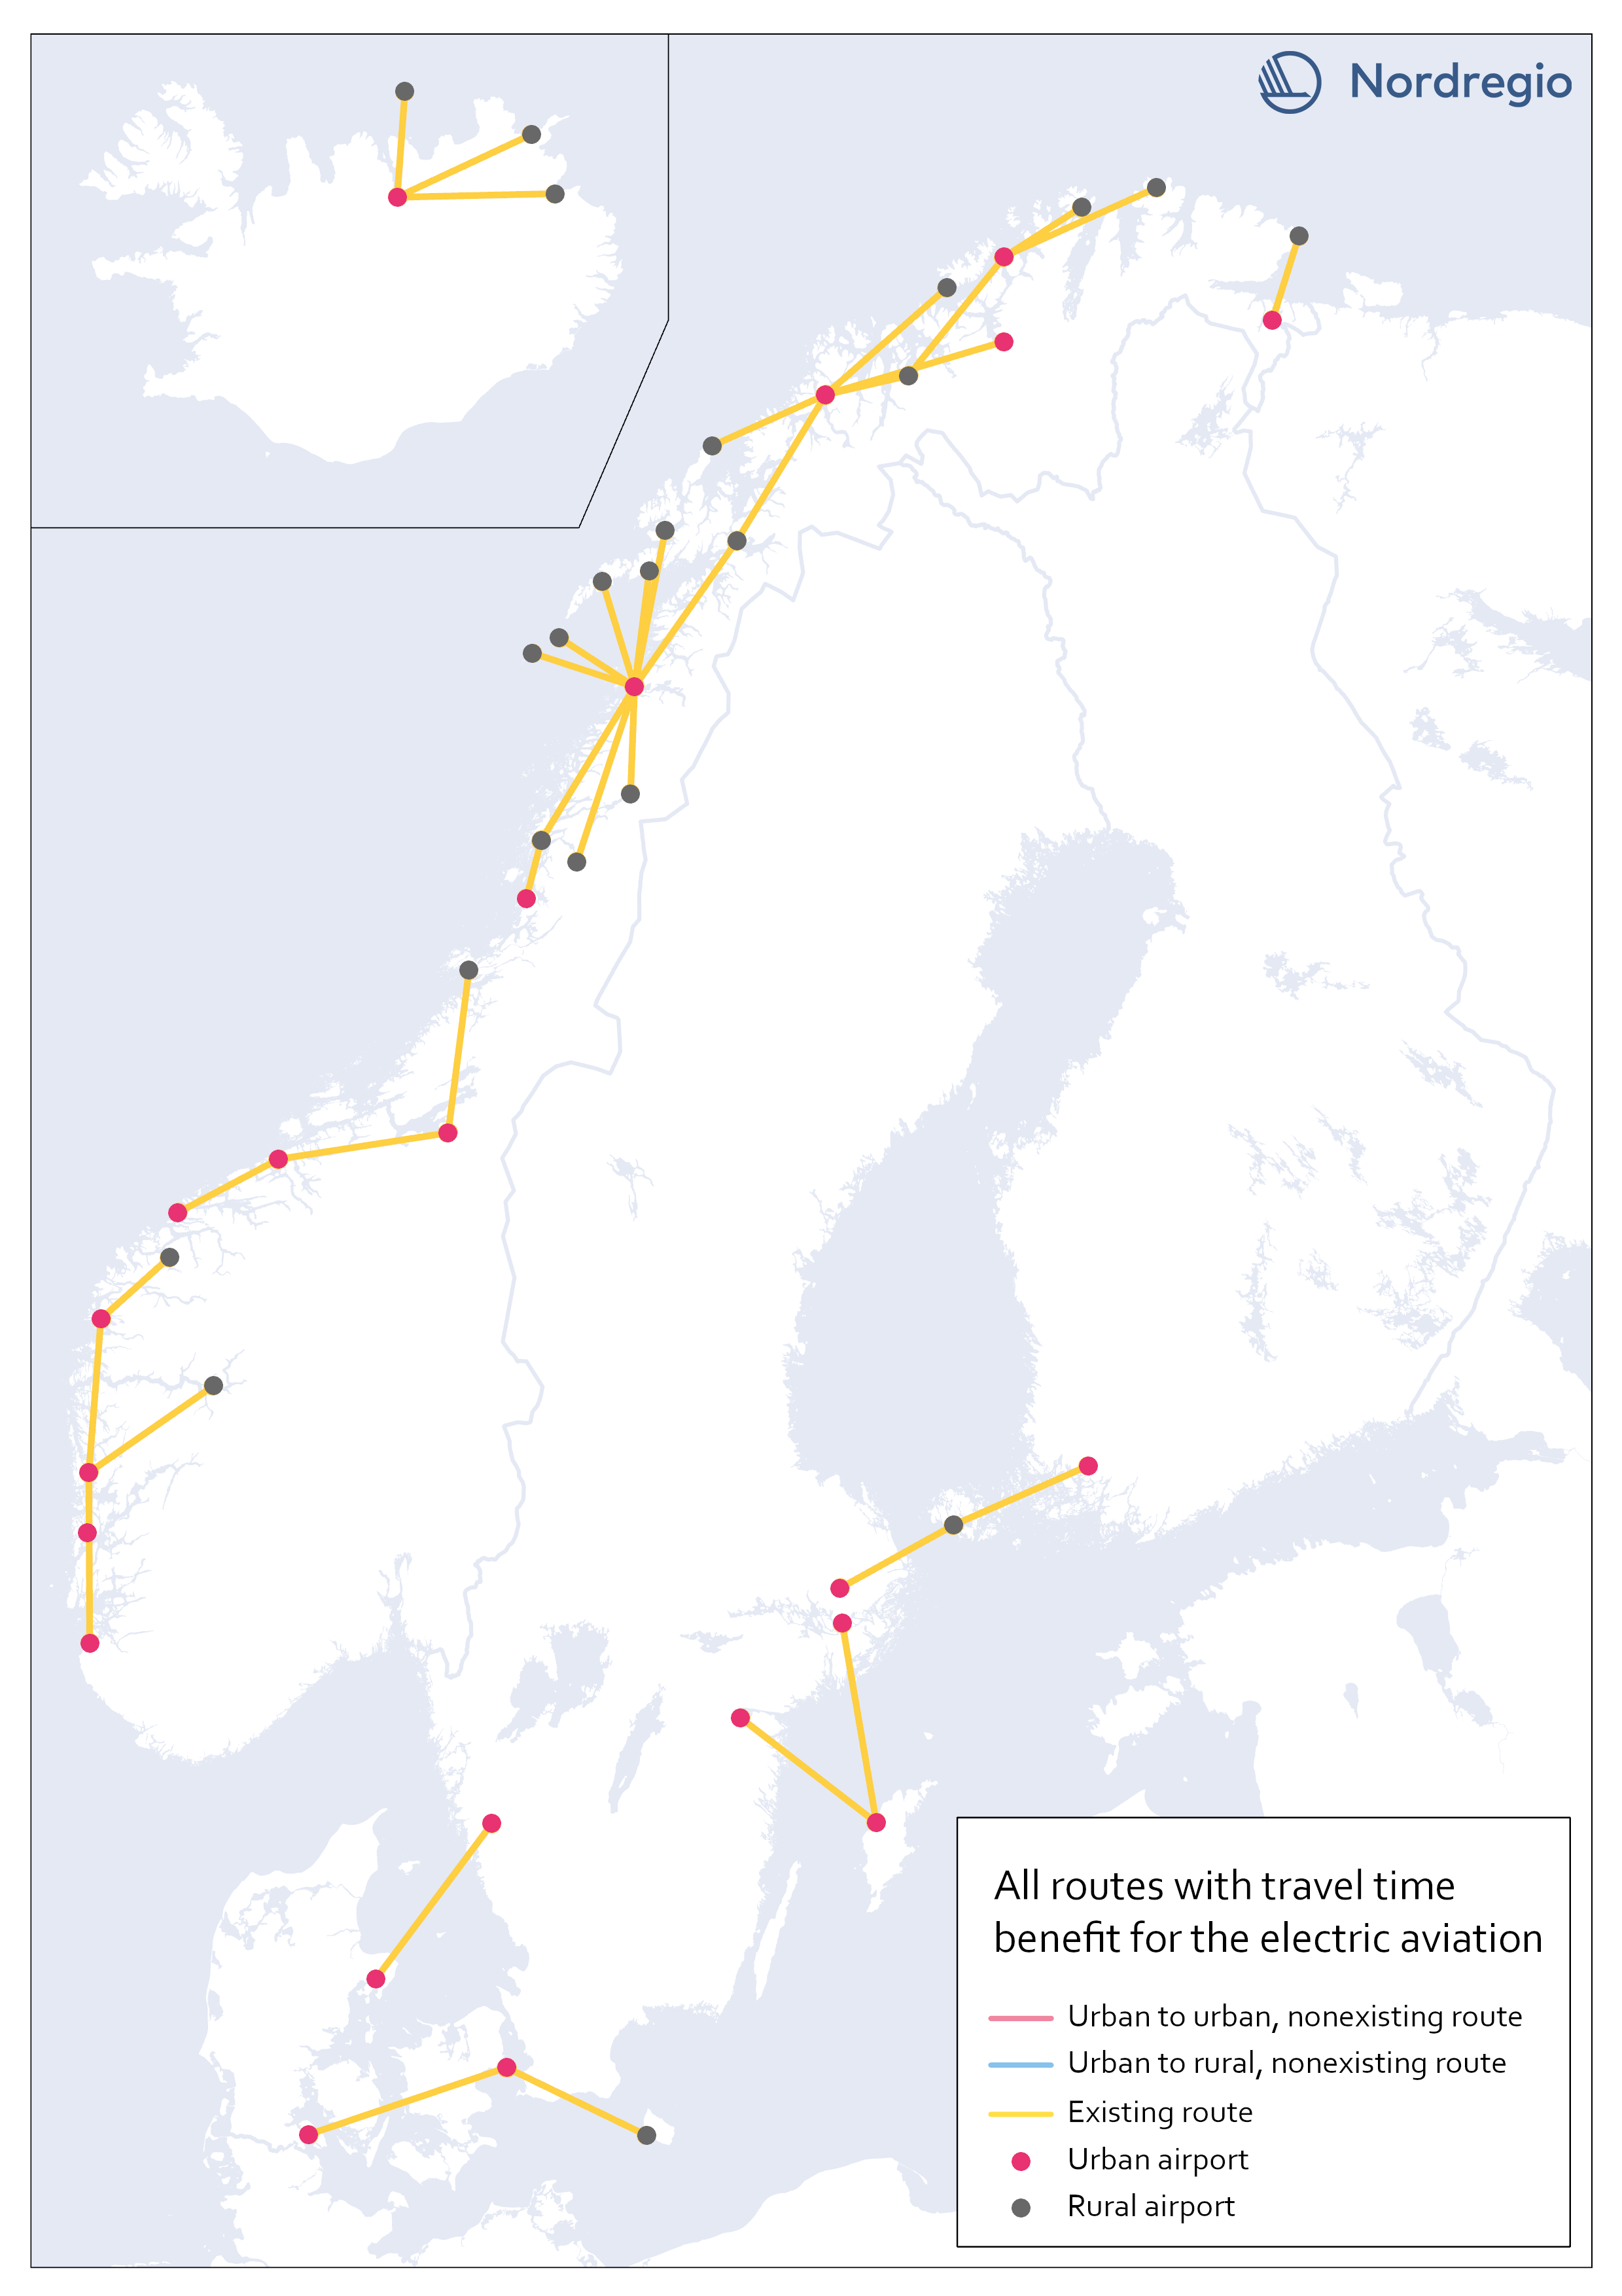
Existing routes with time benefit for electric aviation
The map visualizes all routes with significant travel time benefit, which are already served with commercial flights. Information on existing routes has been obtained from the report Nordic Sustainable Aviation (Ydersbond et al, 2020) and applies to the year 2019. Since then, routes may have been added or removed, which is important to bear in mind in future investigations. However, choosing a later year risk giving equally misleading results, as flights decreased drastically during the pandemic. Statistics for 2019 provide a picture of the demand that existed before the pandemic, which is the latest stable levels that can be obtained. Whether air traffic will ever return to the same levels as before the pandemic is too early to say. The majority of routes are found in Norway, along the coastline, which confirms earlier knowledge that Norway has a more extensive and coherent aviation network than the rest of the Nordic region.
- 2023 January
- Nordic Region
- Transport
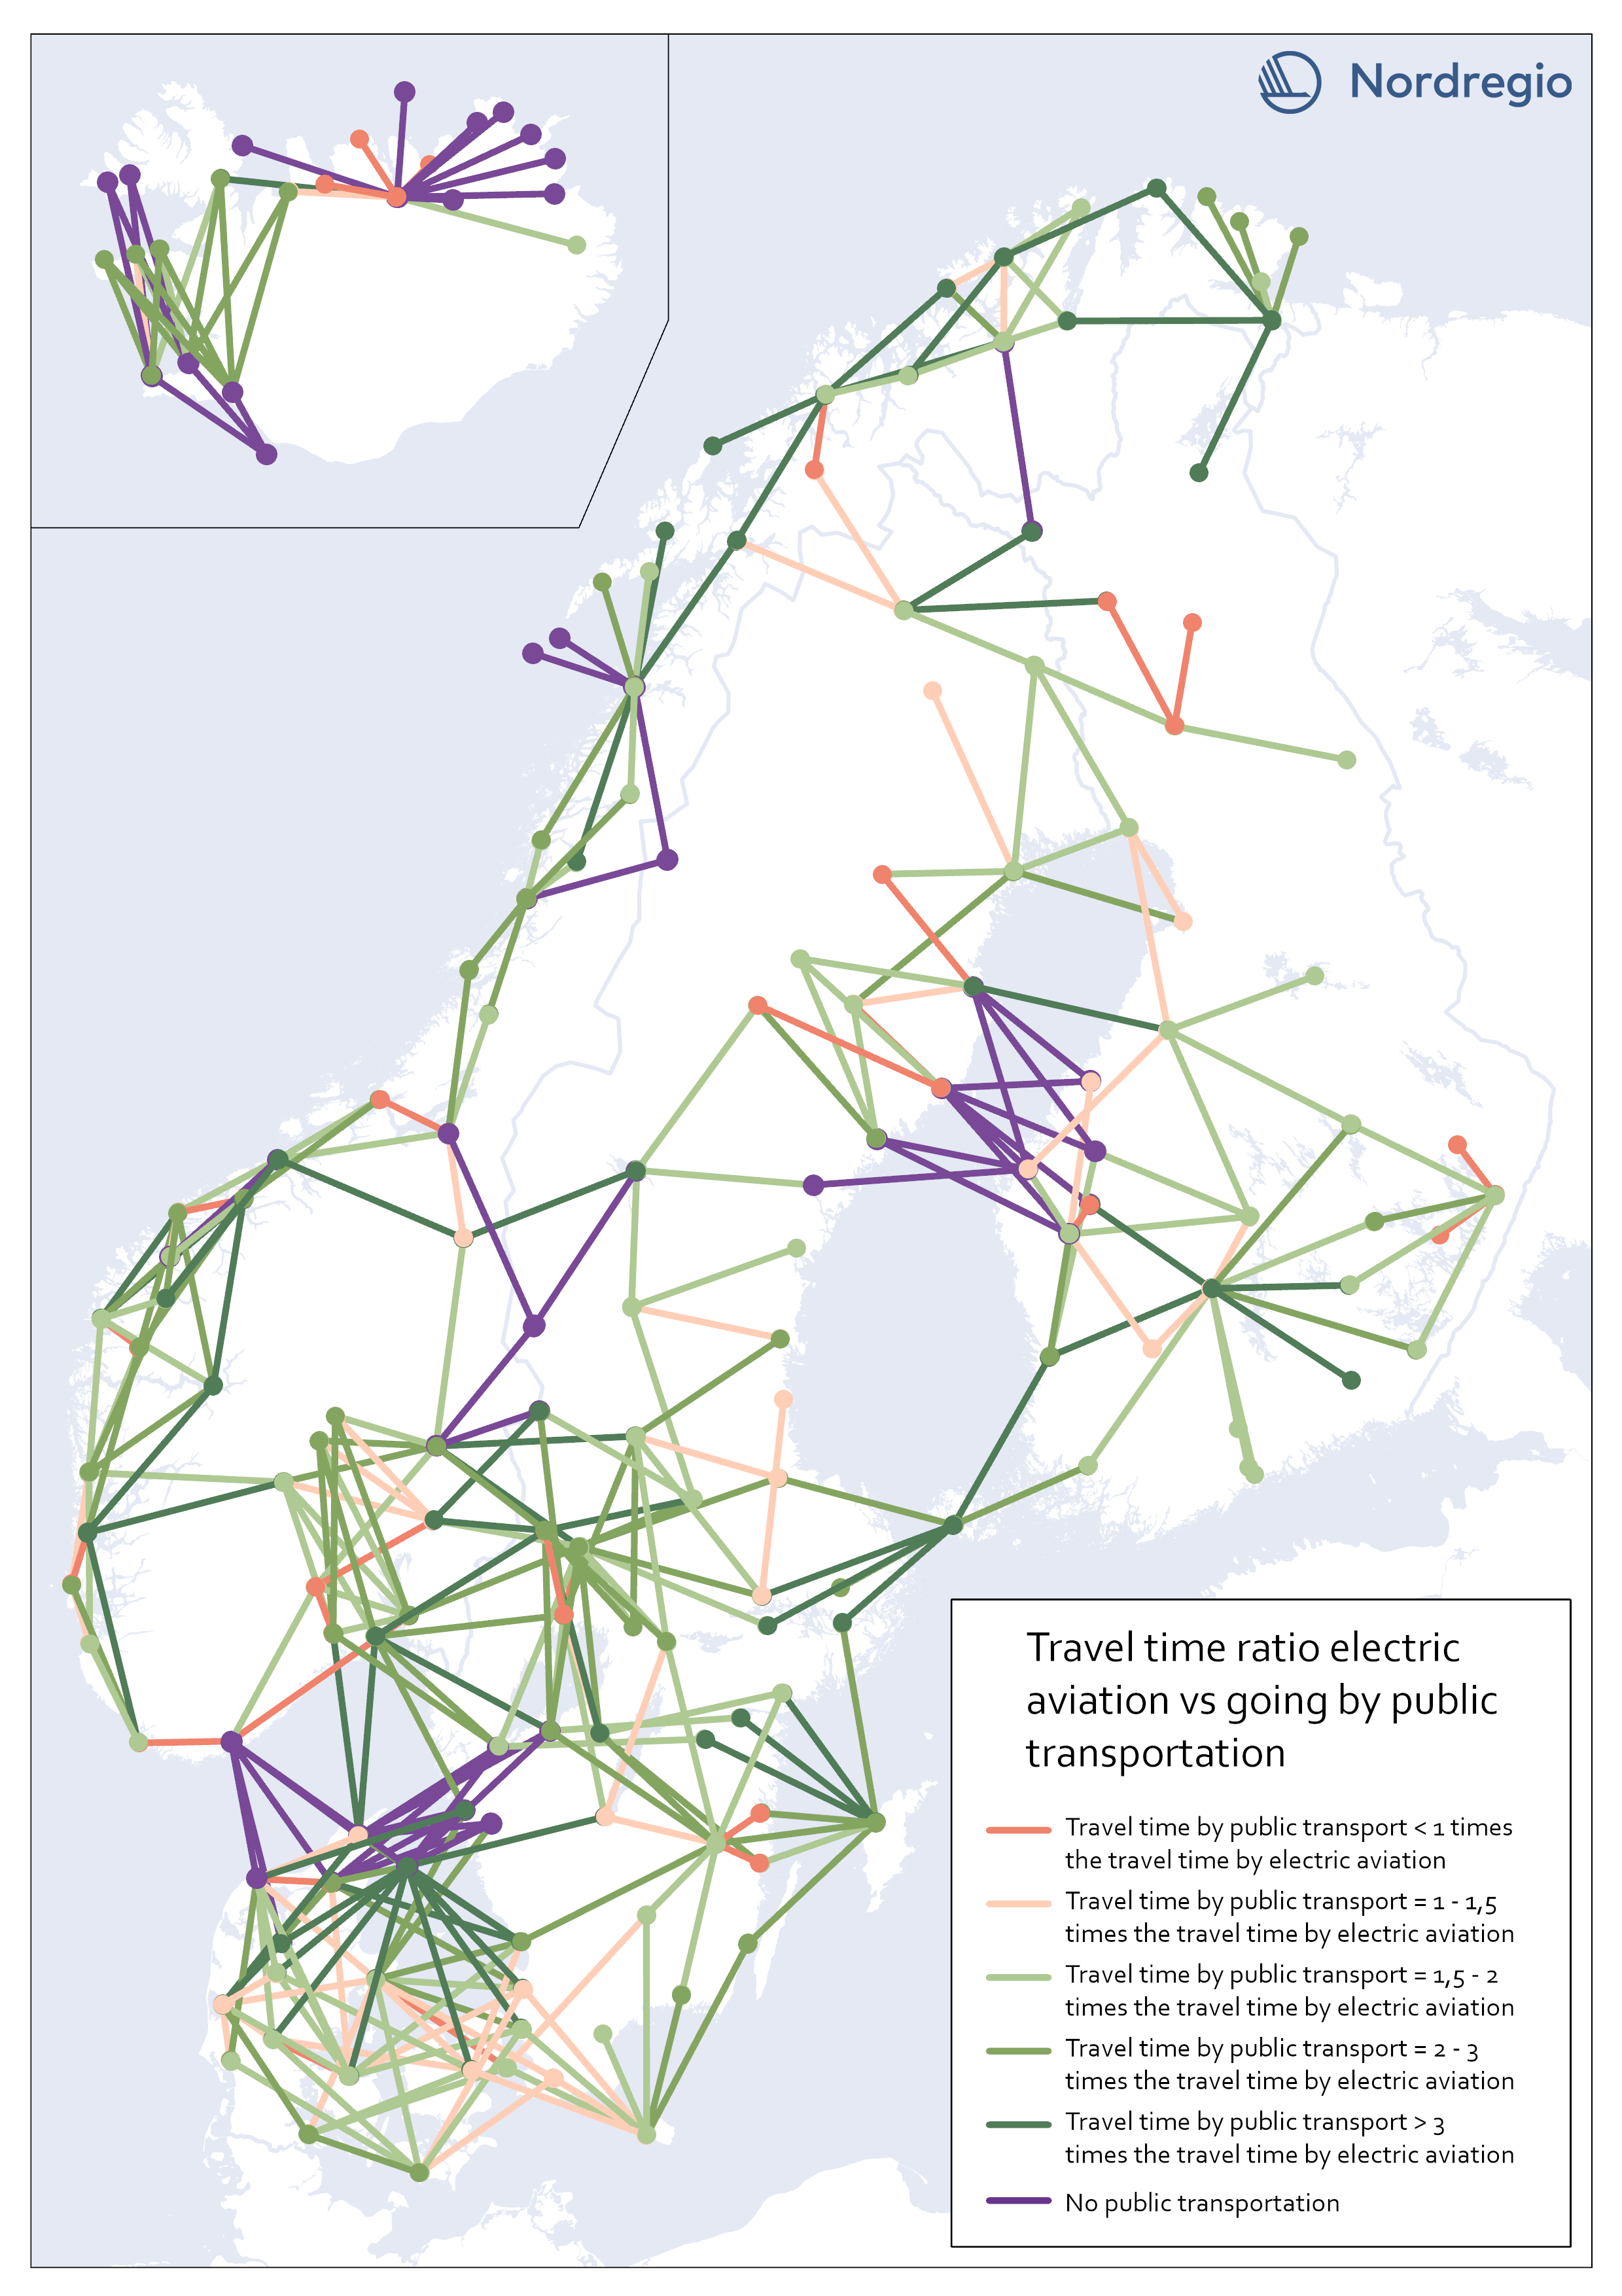
Travel time ratio – electric aviation vs public transportation
This map shows the travel time calculations for electric aviation versus travelling by public transportation. Routes represented by any nuance of green, are routes with significant travel time benefits for electric aviation in comparison with public transportation. The darker the nuance of green, the larger time benefit for electric aviation. The beige color represents routes where the travel time for public transportation is the same or up to 1,5 times the travel time for electric aviation. The red color represents routes where public transportation is faster than electric aviation. Purple lines represent routes where no public transportation is available. These were also routes where we could see significant time benefits for electric aviation. The number of changes when commuting with public transport may have a negative impact on perceived accessibility. In this accessibility analysis, however, we stay with the same criteria for public transport as for travel by car. For future research, the number of changes when commuting by public transport could be considered in the comparison.
- 2023 January
- Nordic Region
- Transport
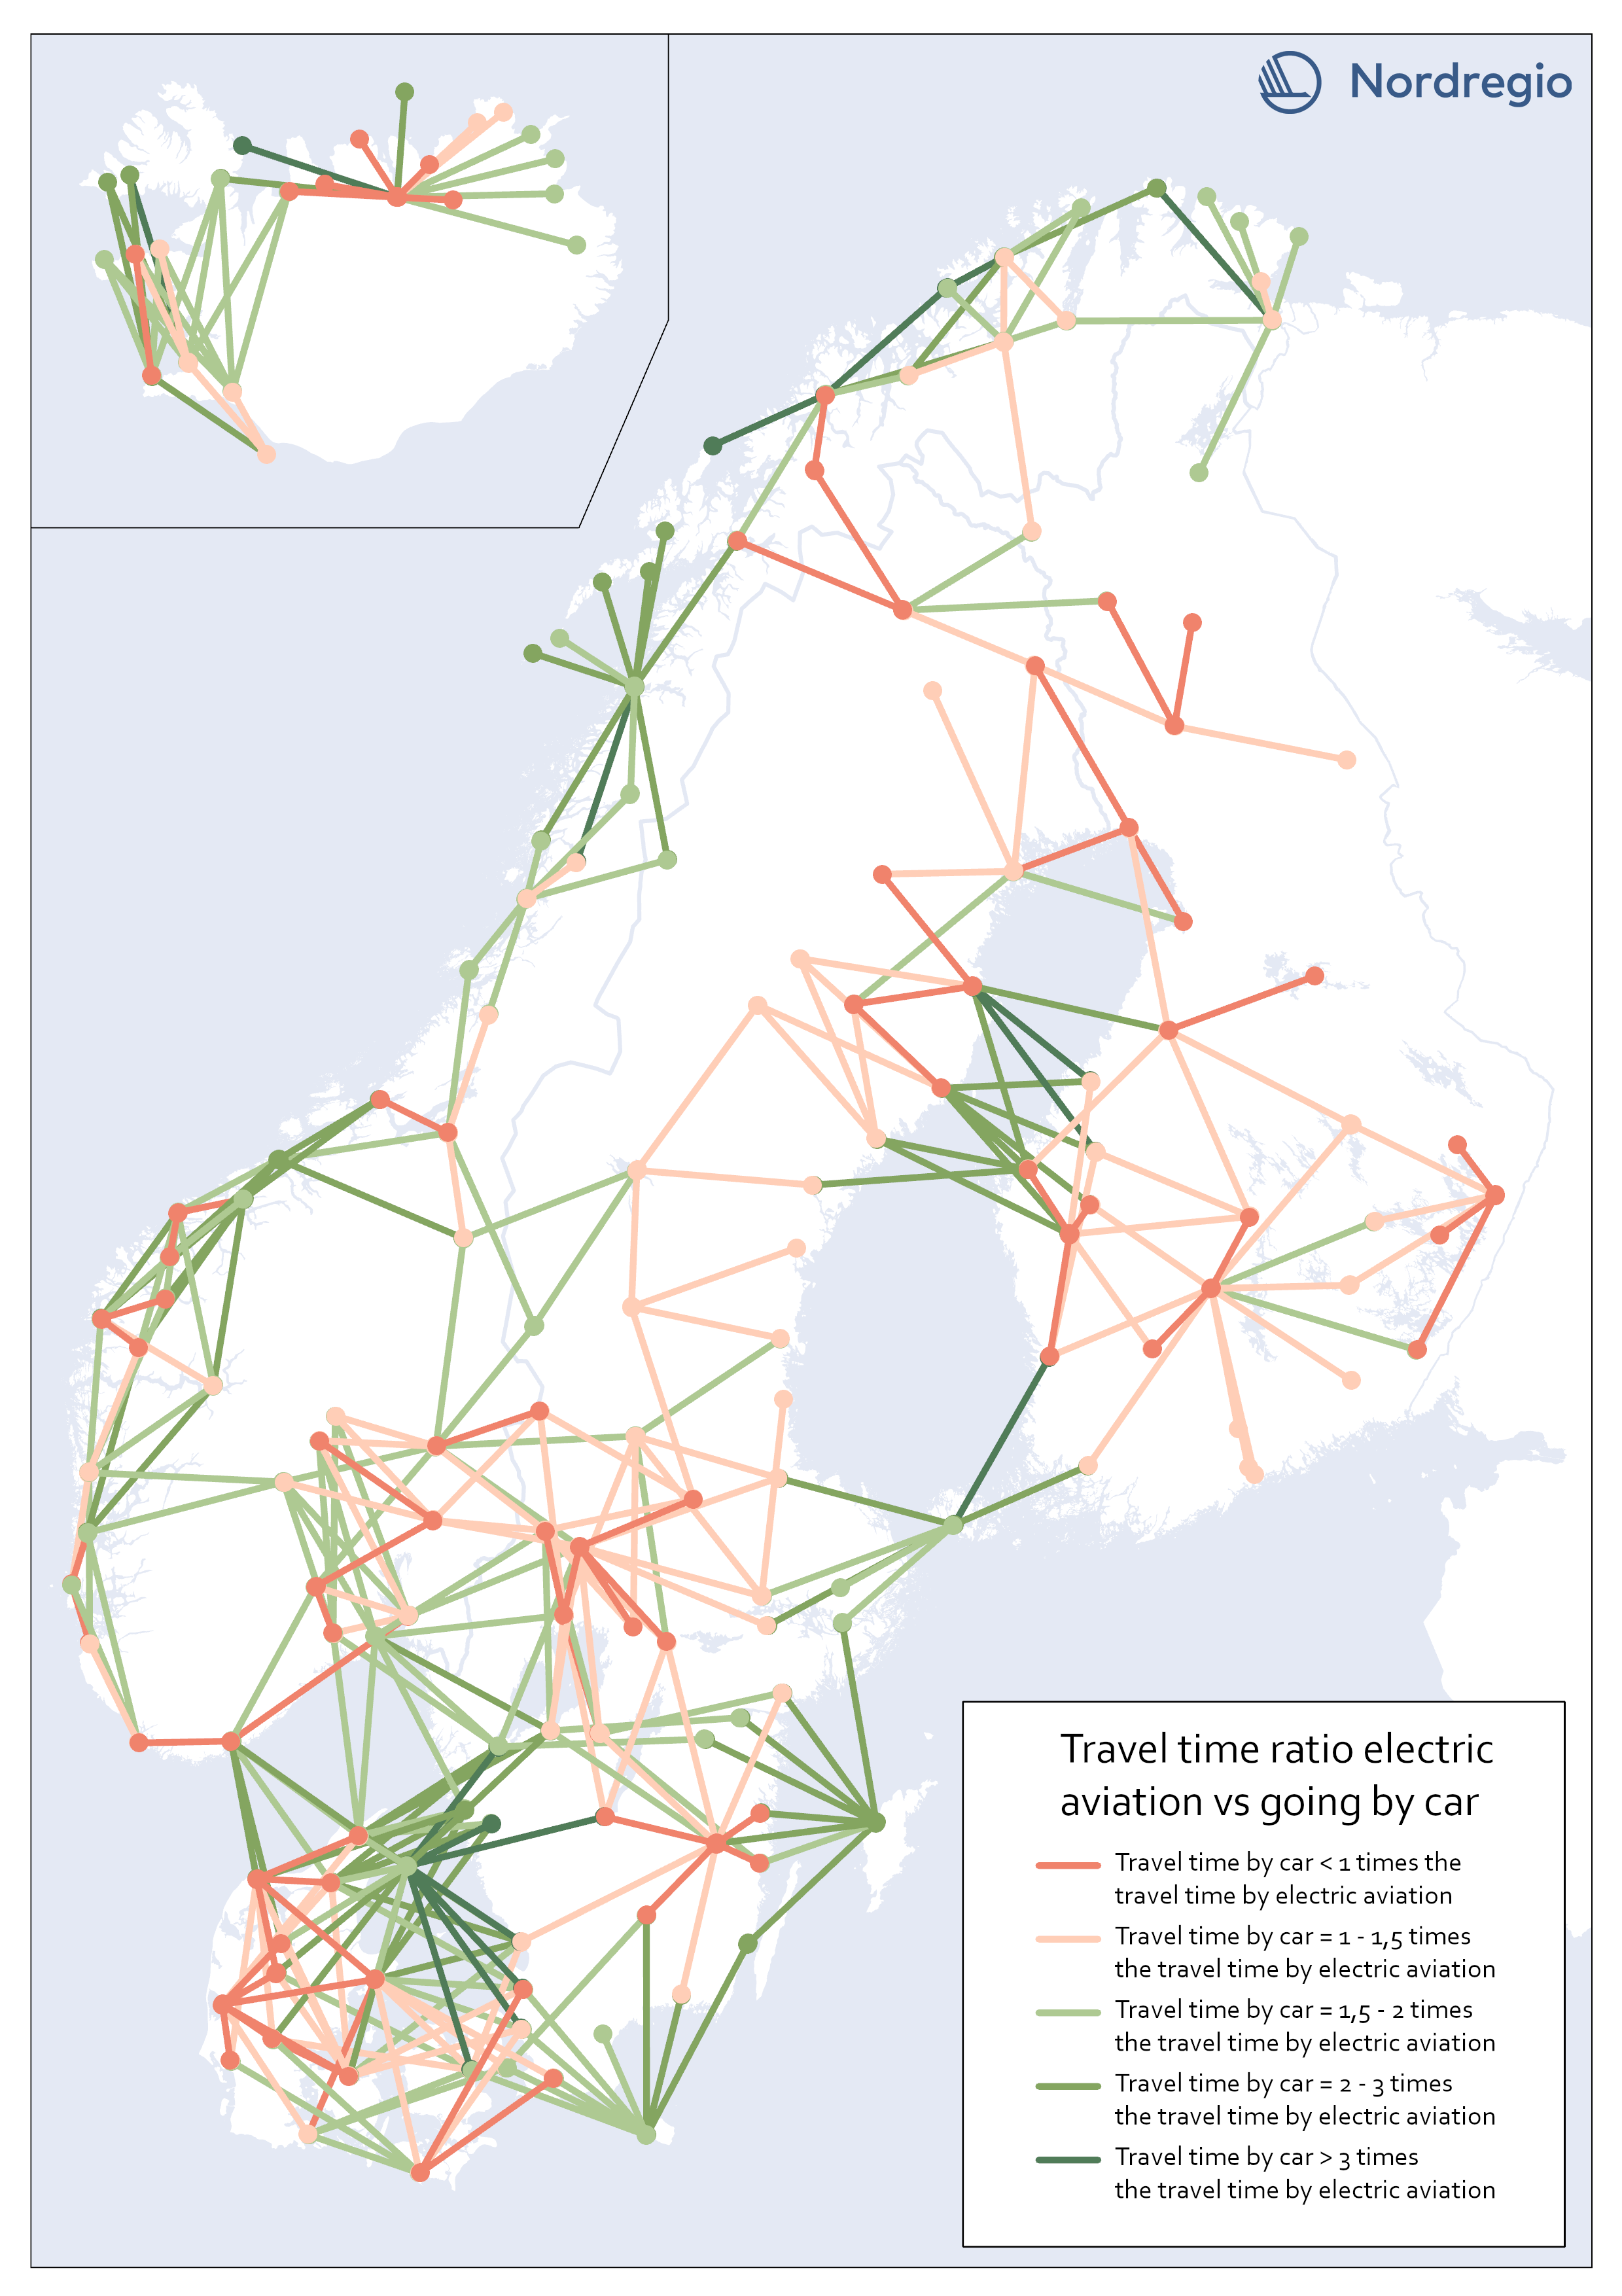
Travel time ratio – electric aviation vs car
This map shows the travel time calculations for electric aviation versus traveling by car. Routes represented by any nuance of green, are routes with significant travel time benefits for electric aviation in comparison with car. The darker the nuance of green, the larger time benefit for electric aviation. The beige color represents routes where the travel time for car is the same or up to 1,5 times the travel time for electric aviation. The red color represents routes where car is faster than electric aviation.
- 2023 January
- Nordic Region
- Transport
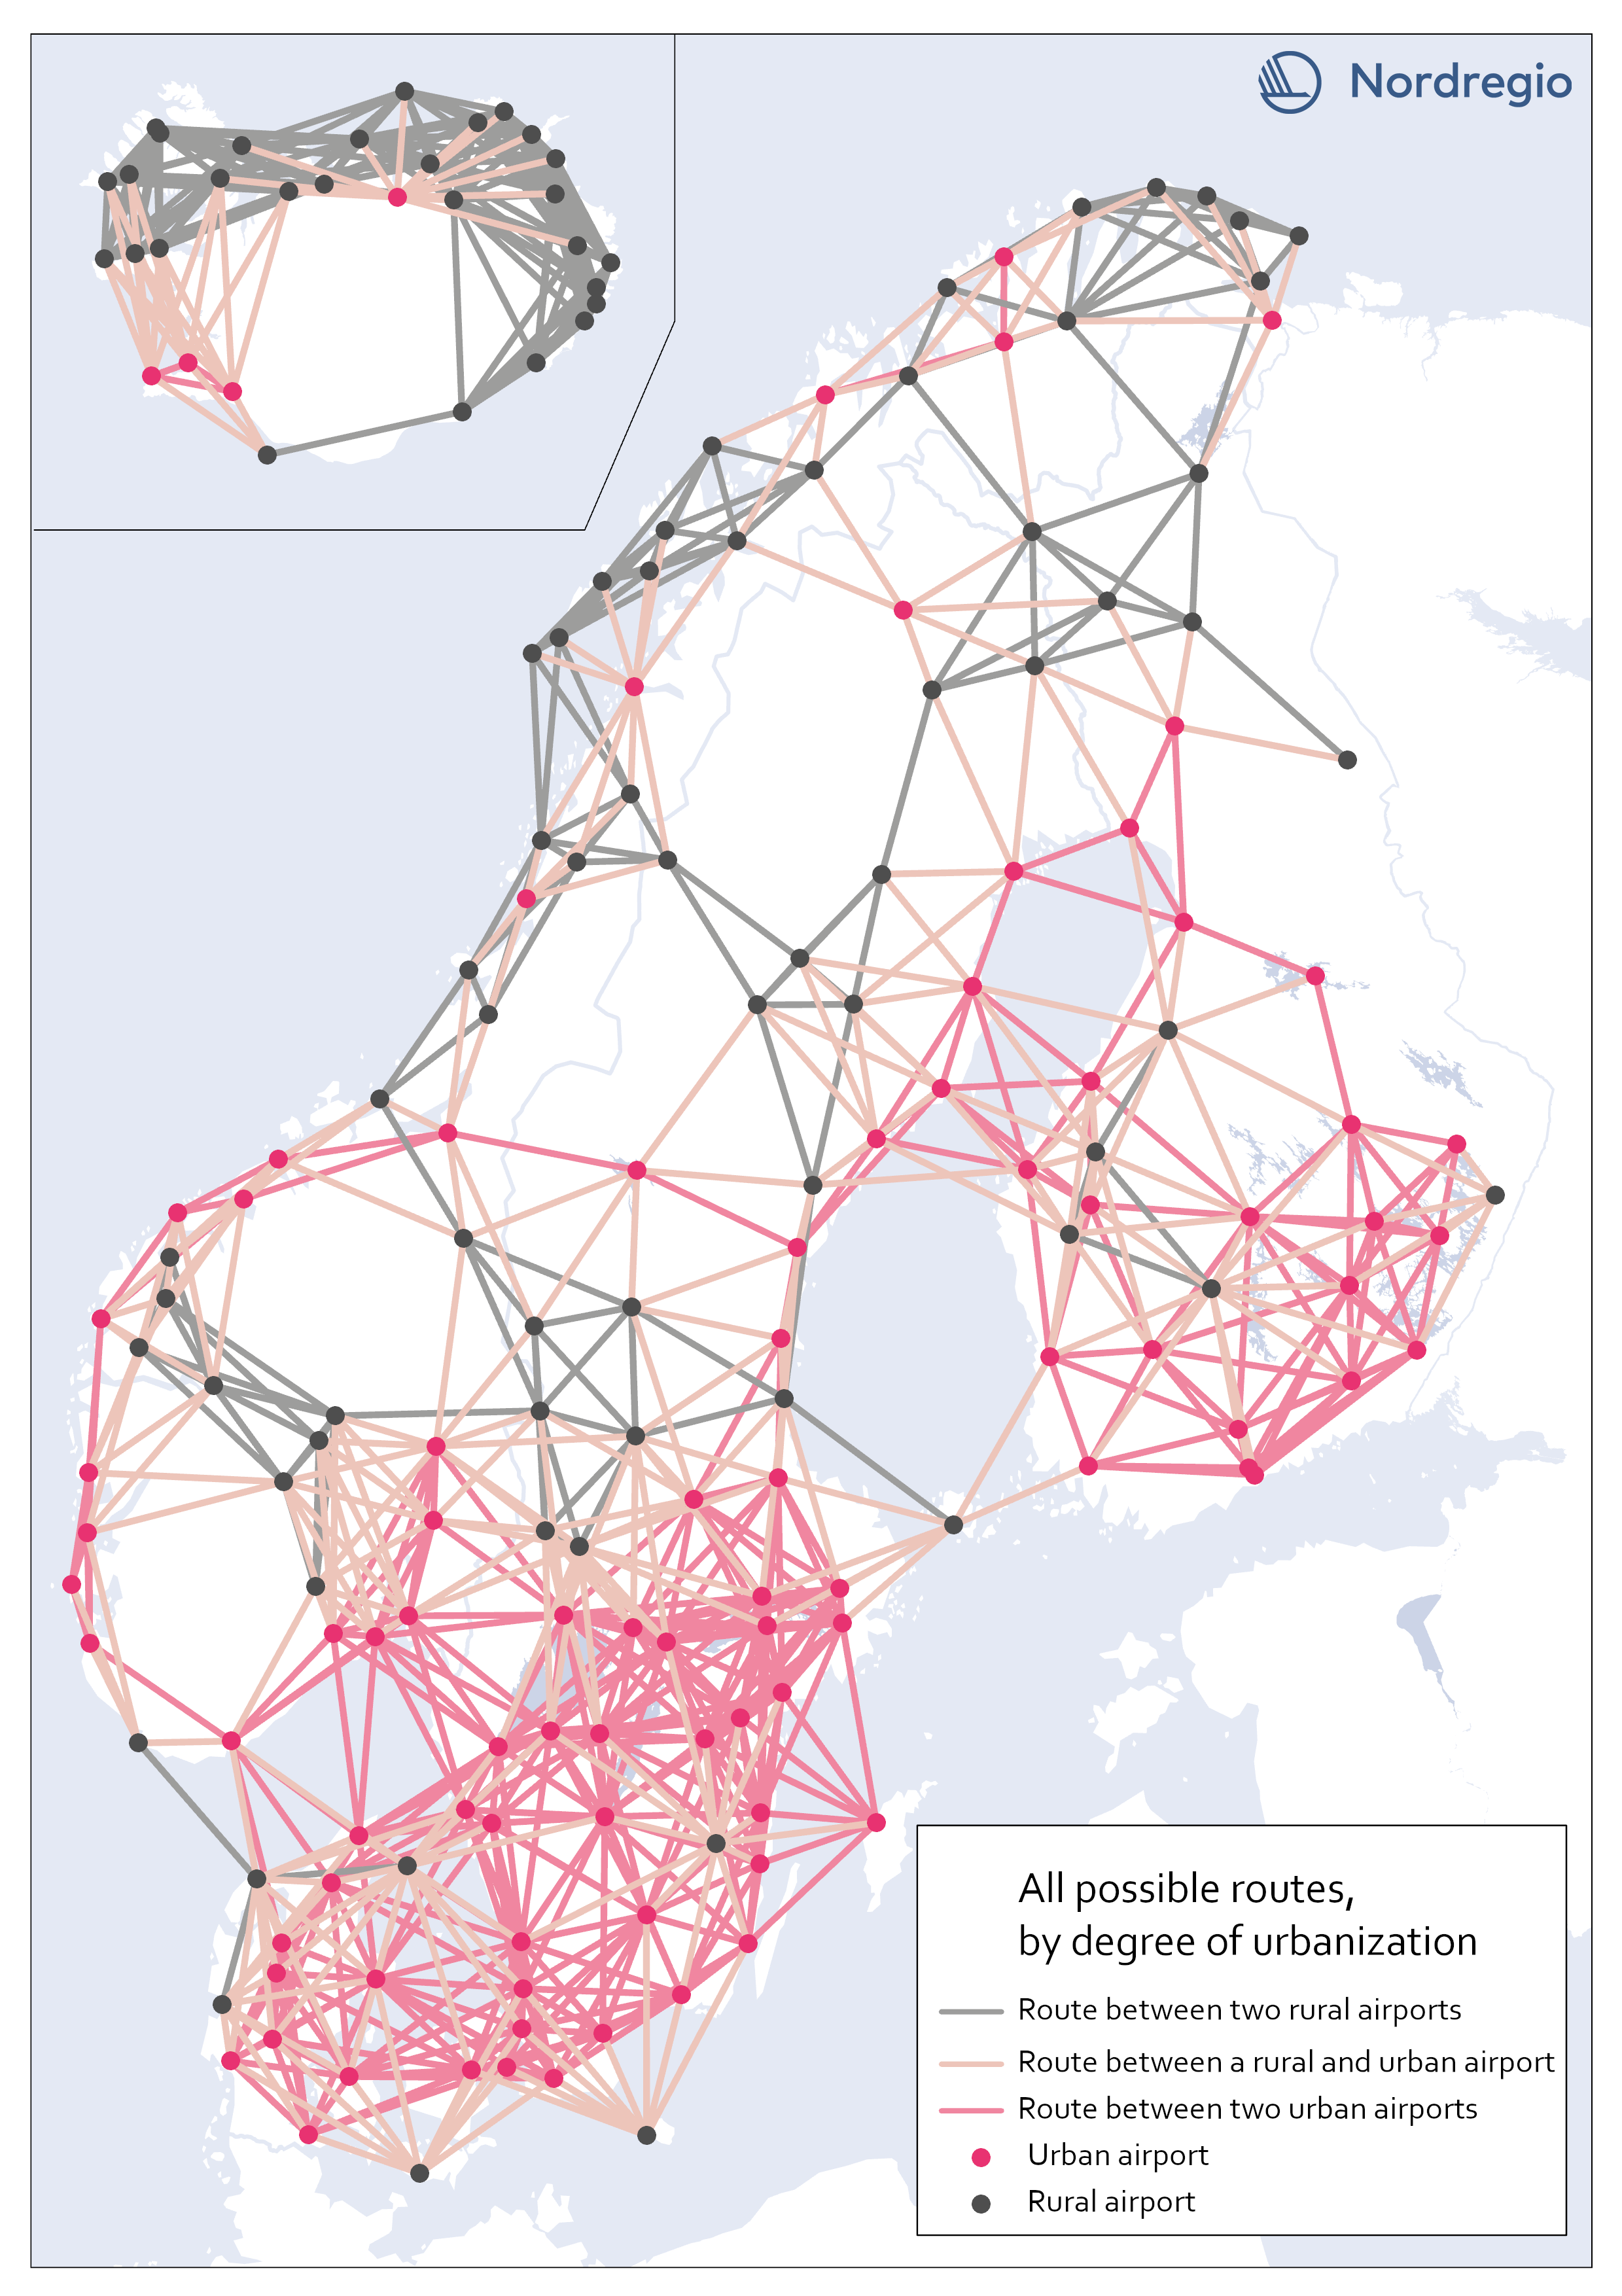
All possible electric aviation routes by a degree of urbanisation
The map shows all routes with a maximum distance of 200 km divided into three categories, based on the airports’ degree of urbanization: Routes between two rural airports, routes between one rural and one urban airport and routes between two urban airports. The classification is based on the new urban-rural typology. We restricted the analysis to routes between rural and urban areas as well as routes between urban areas that are separated by water. Those are 426 in total. We based our criteria on the assumption that accessibility gains to public services and job clusters can be made for rural areas, if better connected to areas with a high degree of urbanization. Because of possible potential to link labor markets between urban areas on opposite sides of water urban to urban areas that cross water are also included. This is based on previous research which has shown the potential for electric aviation to connect important labor markets which are separated by water, particularly in the Kvarken area (Fair, 2022). Our choice of selection criteria means that we intentionally ignore routes where electric aviation may have a potential to reduce travel times significantly. There might also be other important reasons for the implementation of electric aviation between the excluded routes. Between rural areas, for example, tourism or establishing a comprehensive transport system in the Nordic region, constitute reasons for implementing electric aviation. Regarding routes between urban areas over mainland, the inclusion of more routes with the same rationale as above – that significant time travel benefits could be gained between labor markets with electric aviation (for example between two urban areas in mountainous regions where travel times can be long) – can be motivated. Some of those routes can be important to investigate at a later stage but are outside the…
- 2023 January
- Nordic Region
- Transport
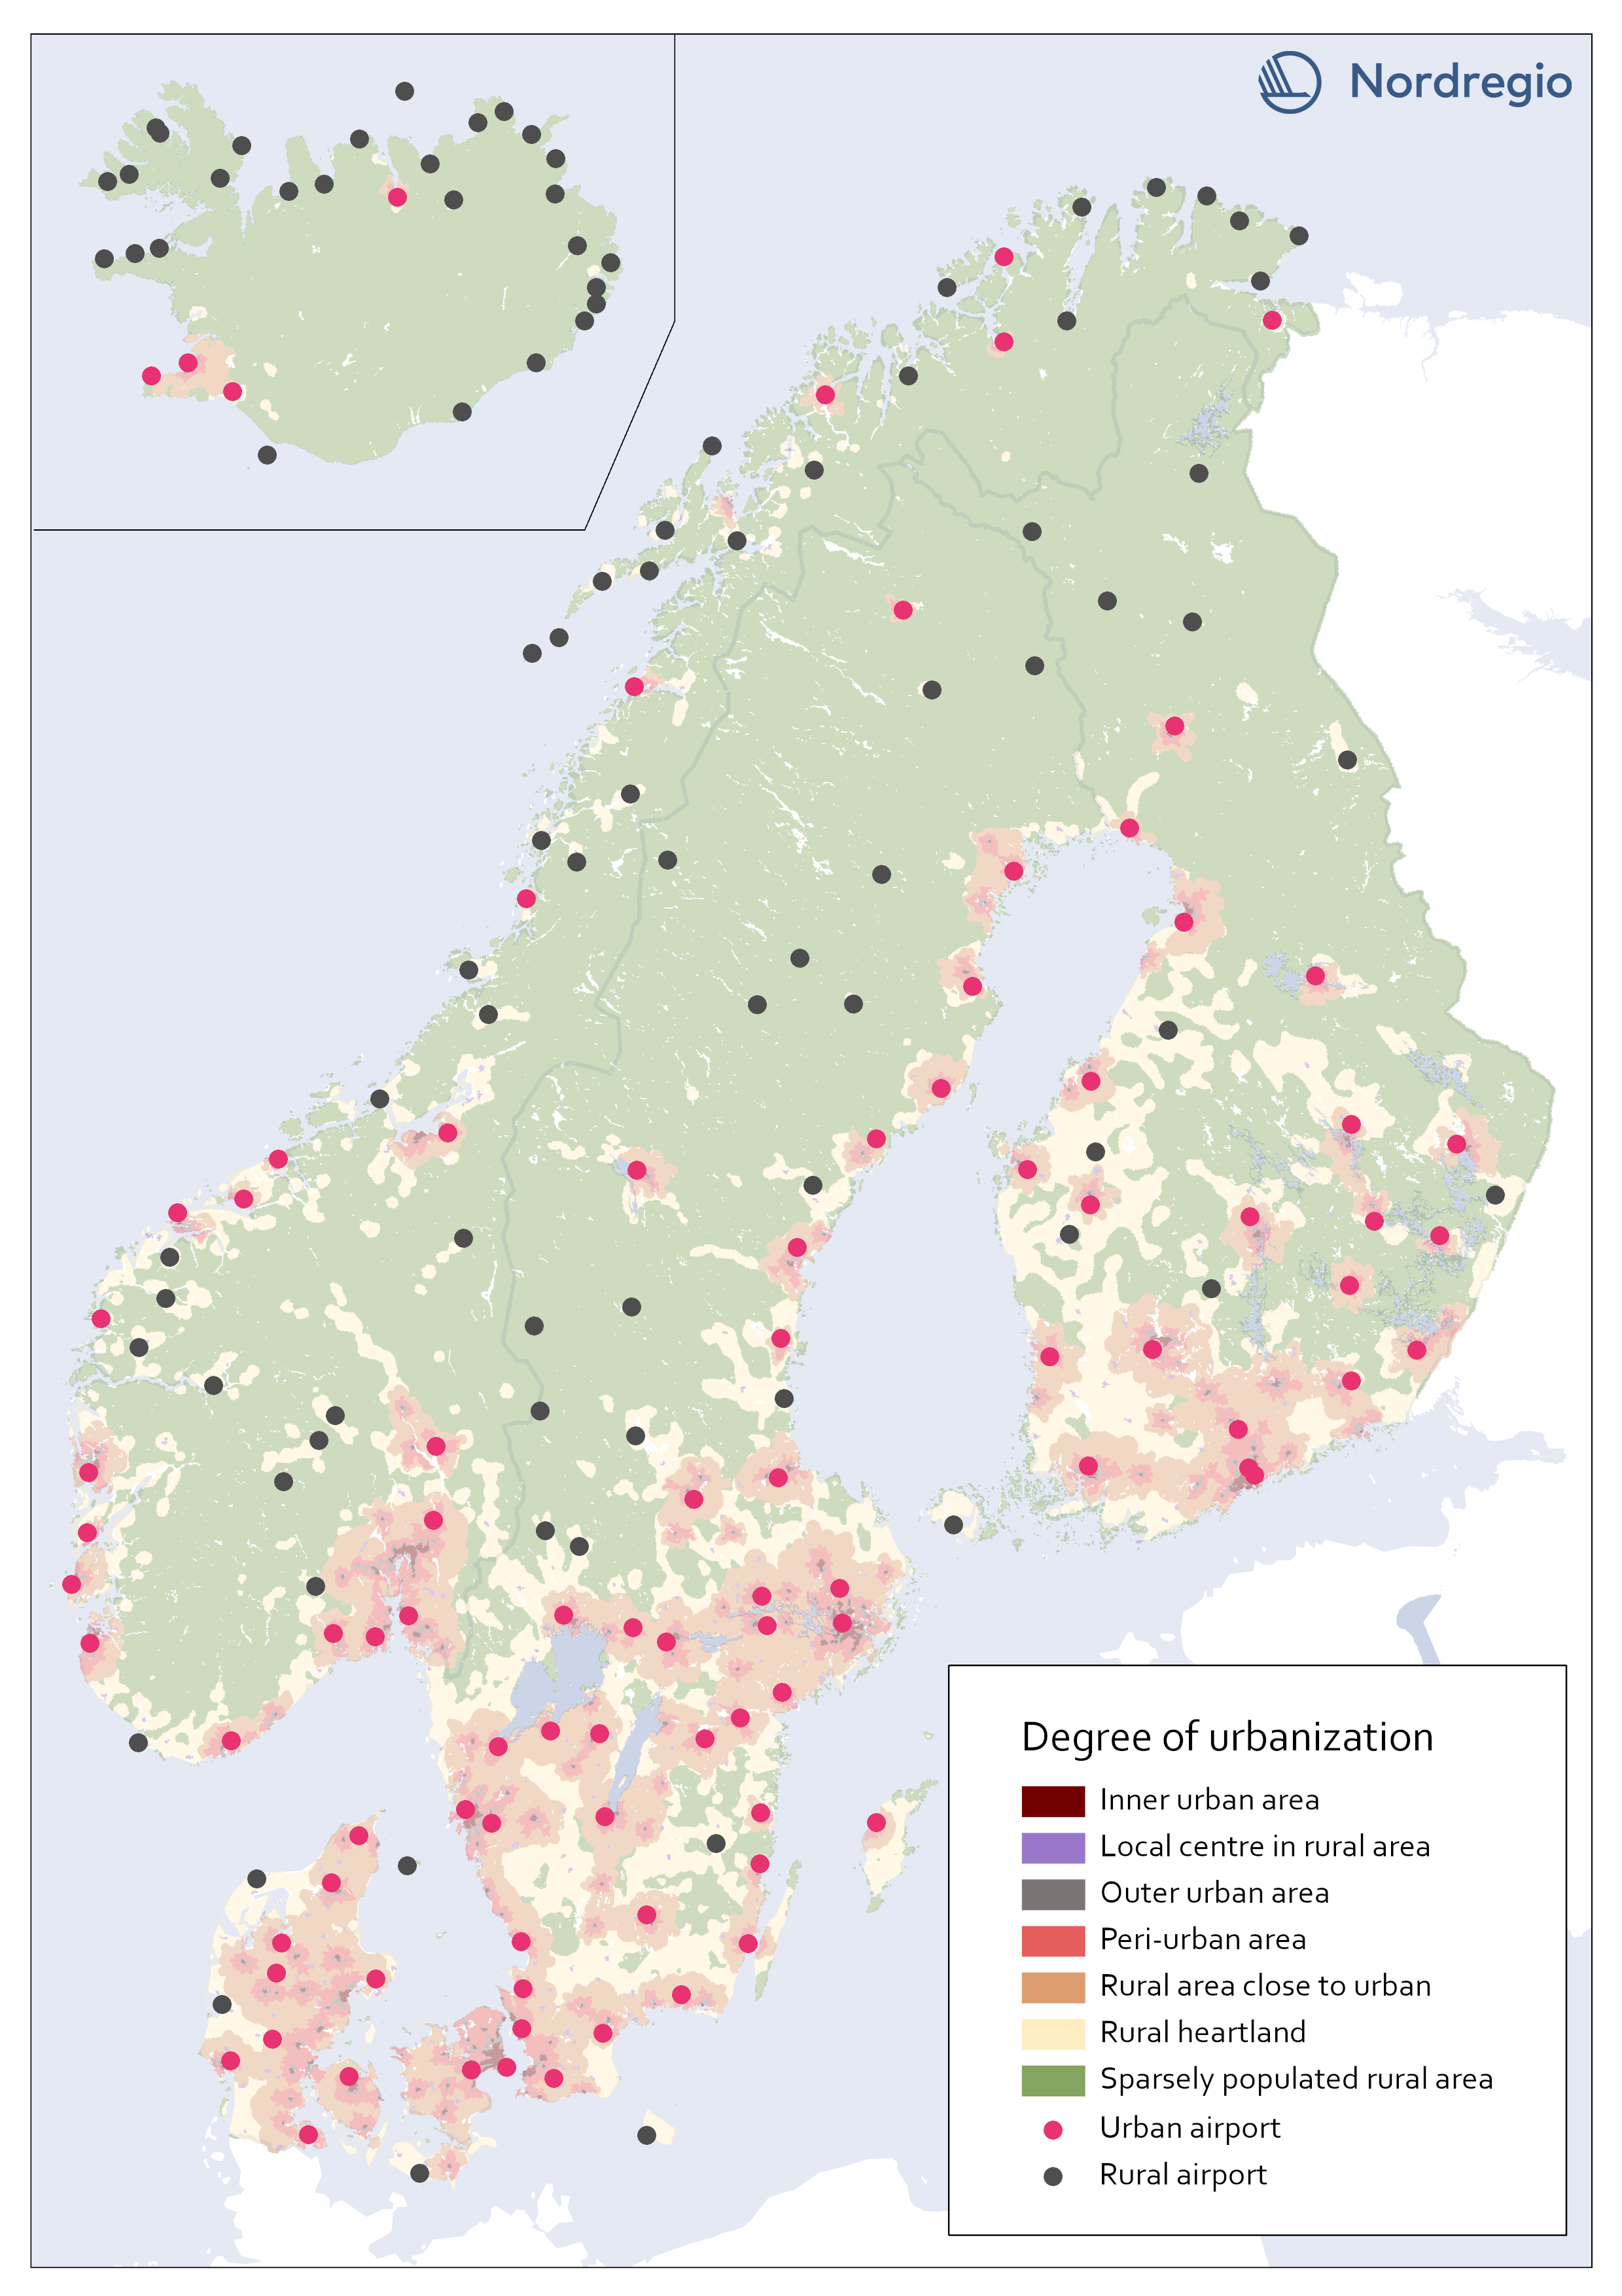
All airports in the Nordic region by a degree of urbanisation
This map classifies all airports by a degree of urbanisation. The classification is based on the new urban-rural typology. We classified all airports localized within any of the top five urbanization classes (Inner urban area, Local center in rural area, Outer urban area, peri-urban area, or Rural area close to close to urban) as Urban. All other airports, localized within the bottom two classes (Rural heartland or Sparsely populated rural area) were classified as Rural. No adjustments were made based on the proximity of the airports to urban areas. During the process we considered adjustments in the categorization based on the airports’ potential catchment area from a close urban area. For example, one can assume that Gällivare Lappland airport in the north of Sweden, has its main catchment area from Gällivare which is classified as a local center in rural area (i.e. Urban). The airport, though, is localized within the category Rural heartland. Yet, we decided to let the typology determine to which category each airport belong.
- 2023 January
- Nordic Region
- Transport
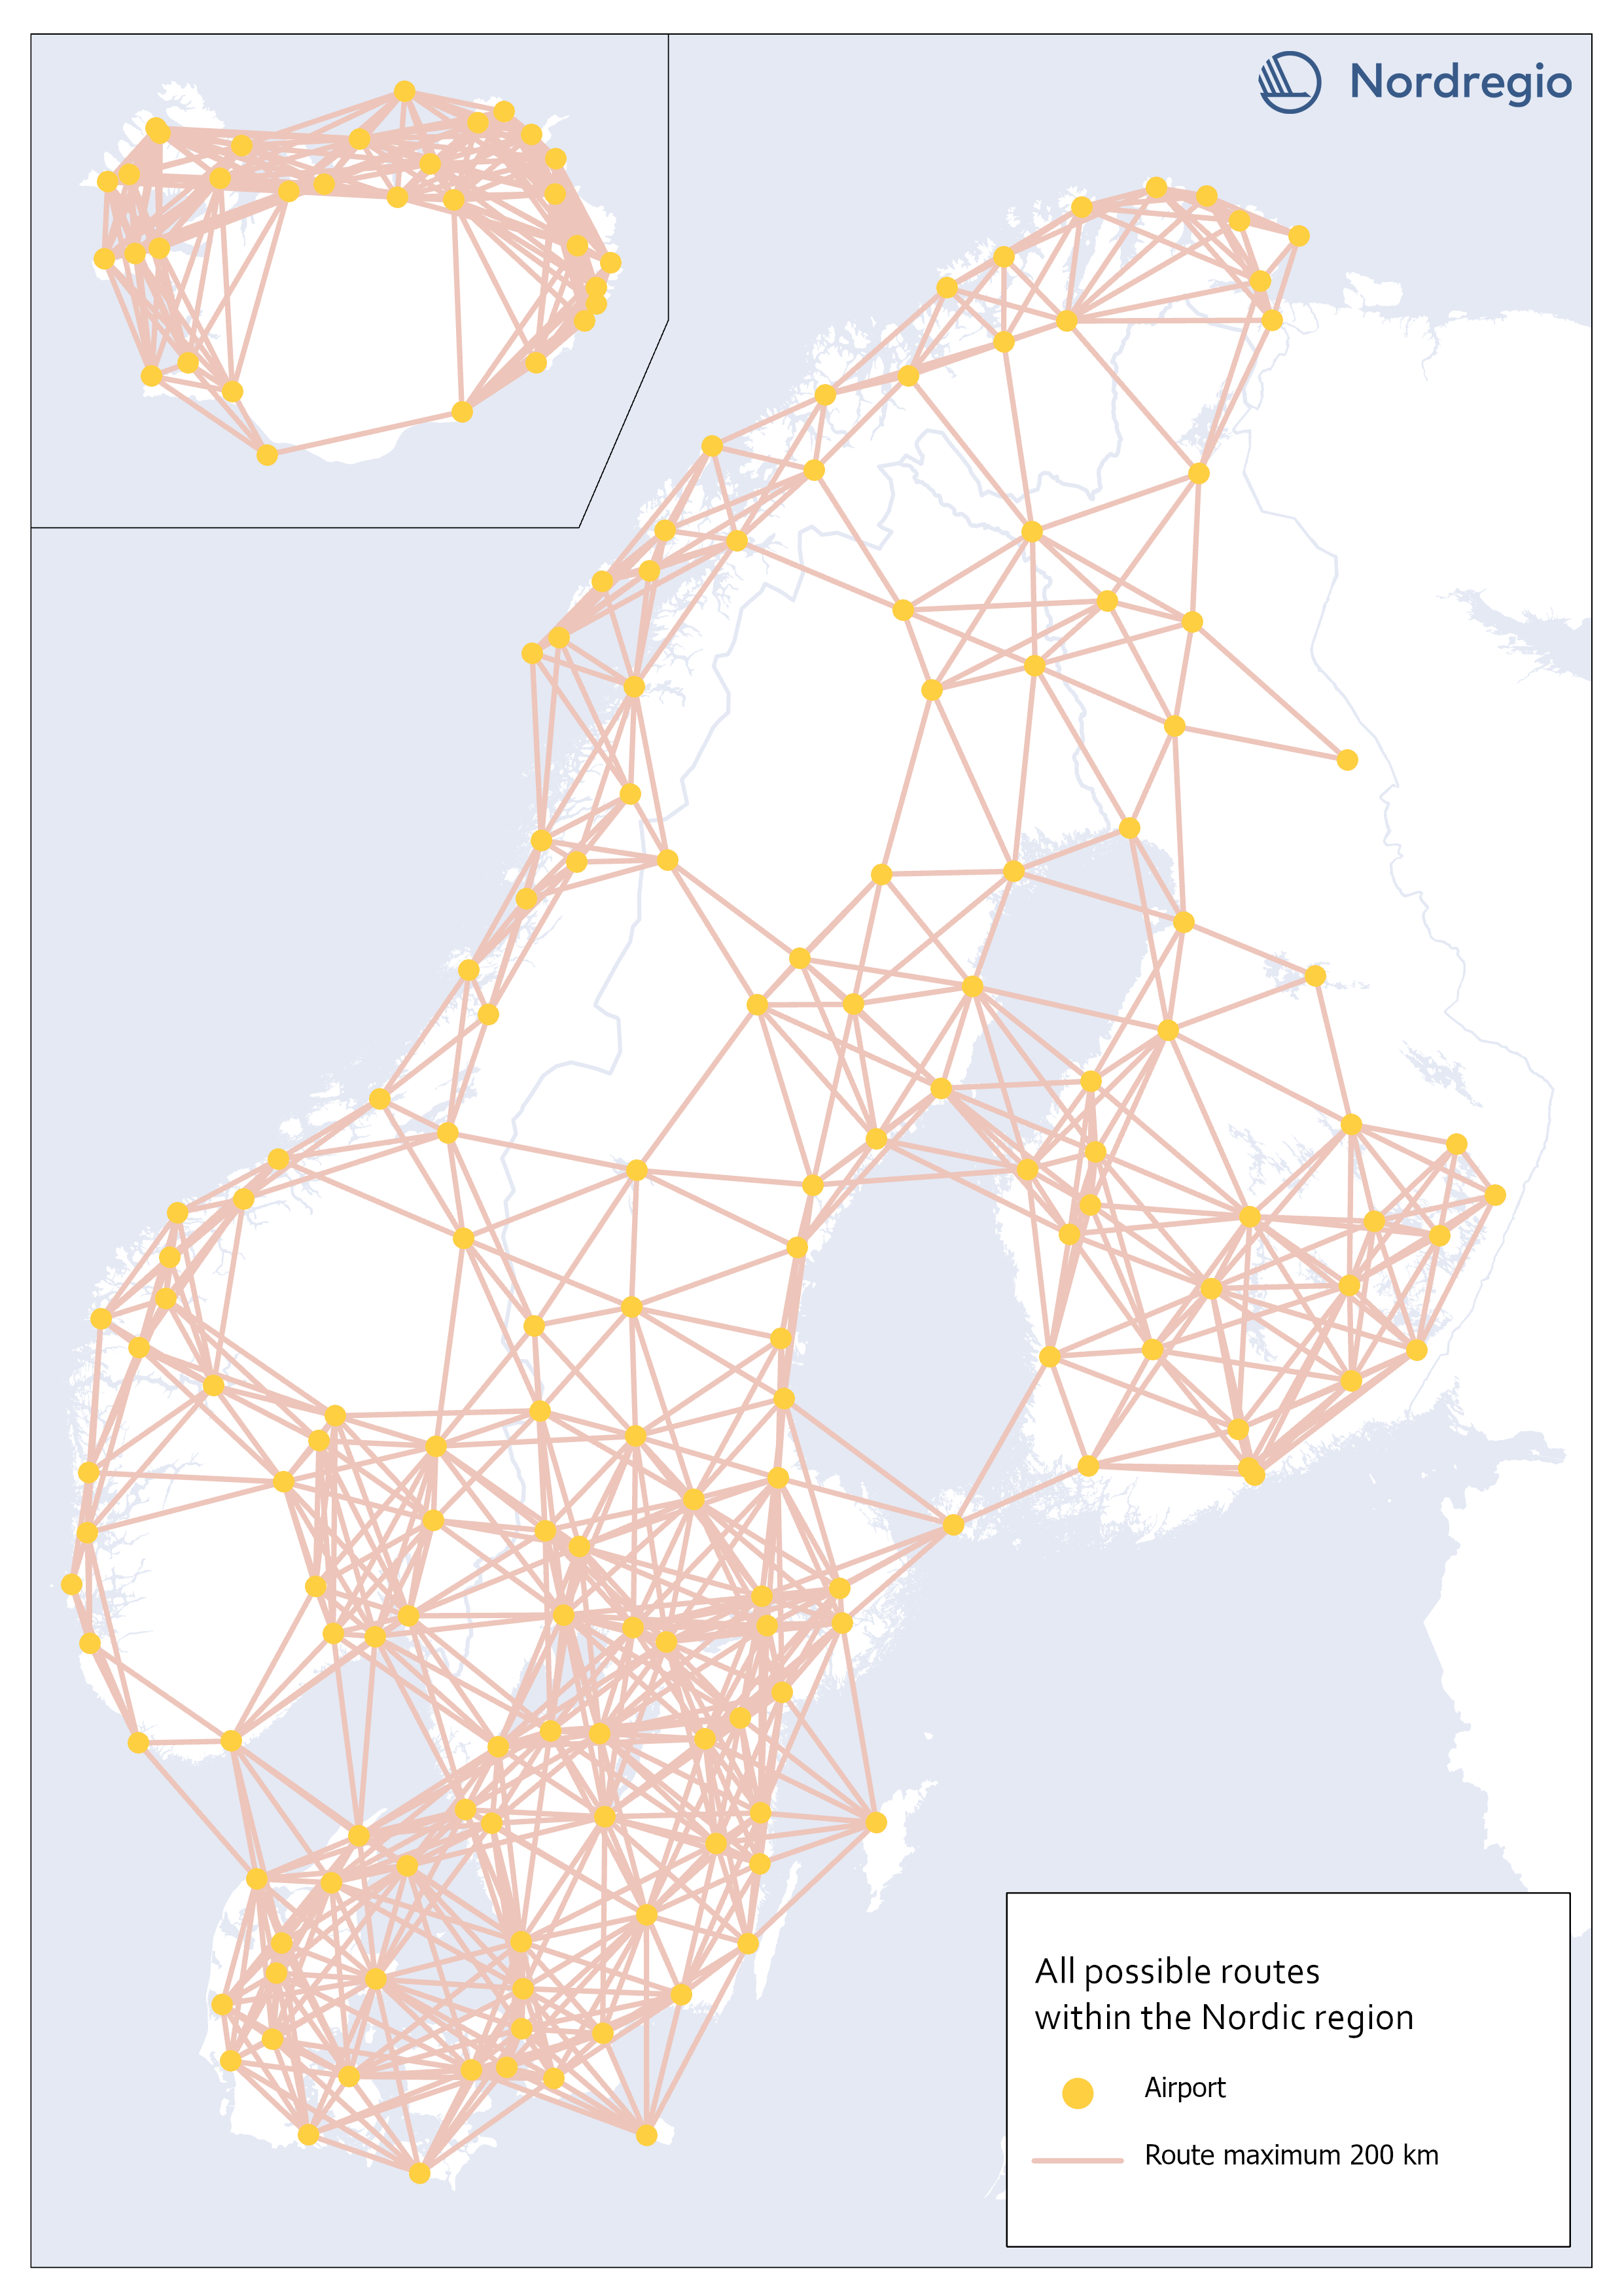
All possible electric aviation routes, max 200km, within the Nordic region
This map shows all possible electric aviation routes of a maximum distance of 200 kilometres within the Nordic region. First generation electric aviation will have a limited range due to battery capacity. According to the report Nordic Sustainable Aviation, routes up to 400 kilometers constitute an initial market for electric airplanes in the Nordic region. However, also shorter distance routes under 200 km, where cruise speed is less important and in sparsely populated regions where passenger volumes are very small, will be the focus (Ydersbond et al, 2020). The first generation of aircrafts that rely solely on electric power have a defined maximum range of 200 km (Heart Areospace, 2022). For this accessibility study, we only included routes of a maximum distance of 200 kilometers. This selection gave us 1001 possible routes in total.
- 2023 January
- Nordic Region
- Transport
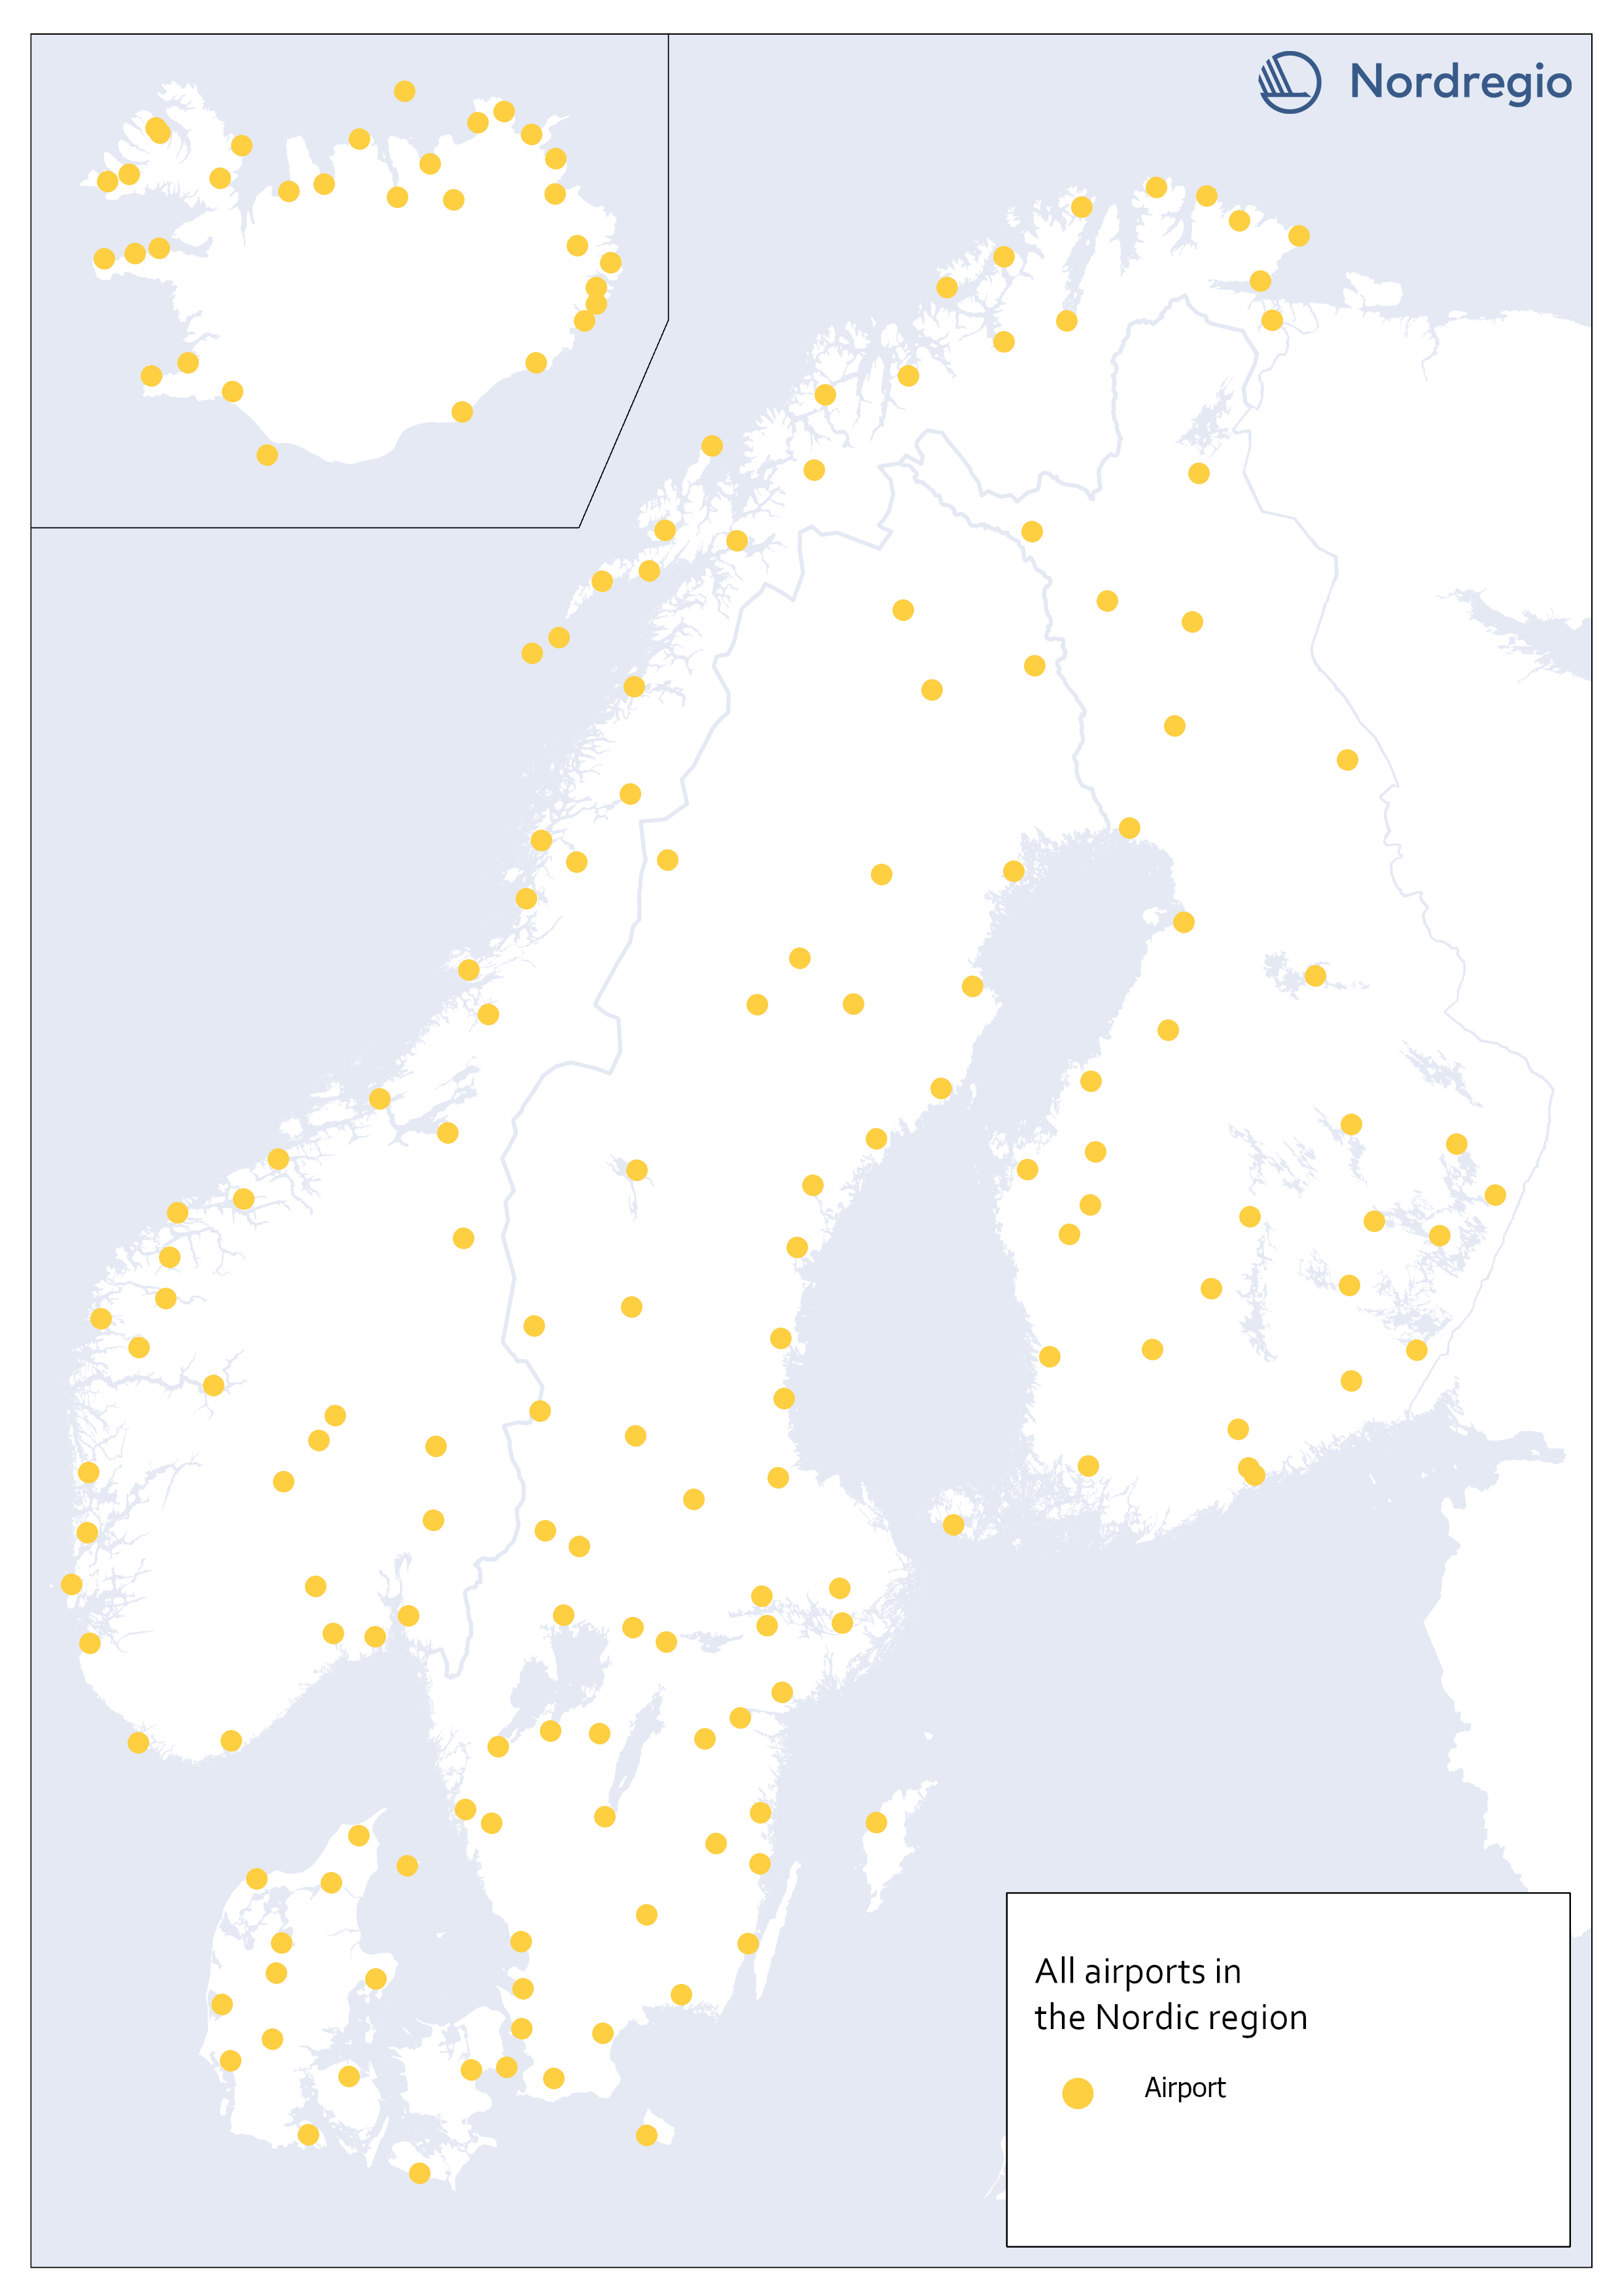
All airports in the Nordic region
This map shows all airports within the geographical scope which may be operated with commercial flight. To limit our selection of airports, we used a combination of two official airport code systems: IATA (International Air Transport Association) and ICAO (International Civil Aviation Organization). IATA-codes specify the airport as a part of a commercial flight route. However, the IATA system, is not solely limited to airports. Other locations, such as bus or ferry stations can also apply for an IATA location code, as long it is included in an airline travel chain. The ICAO-code, on the other hand, indicates that the location is an airport, but not necessarily for commercial flights In order to obtain a selection of airports that met our criteria, an airport was included only if it had both an IATA-code and an ICAO-code. Three different sources are used: 1) Swedavia (lists all airports in the Nordics that Swedavia traffics today). This is our main source, but it does not include all existing airports in the Nordic countries. Therefore, we also use two other sources: 2) Avcodes: Airport code database, from which other airports, that are not served by Swedavia, are obtained. 3) Wikipedia. Finally, the listed airports are checked against Wikipedia, to verify if any airports have been missed through the other sources. This selection gave us 186 airports in total.
- 2023 January
- Nordic Region
- Transport
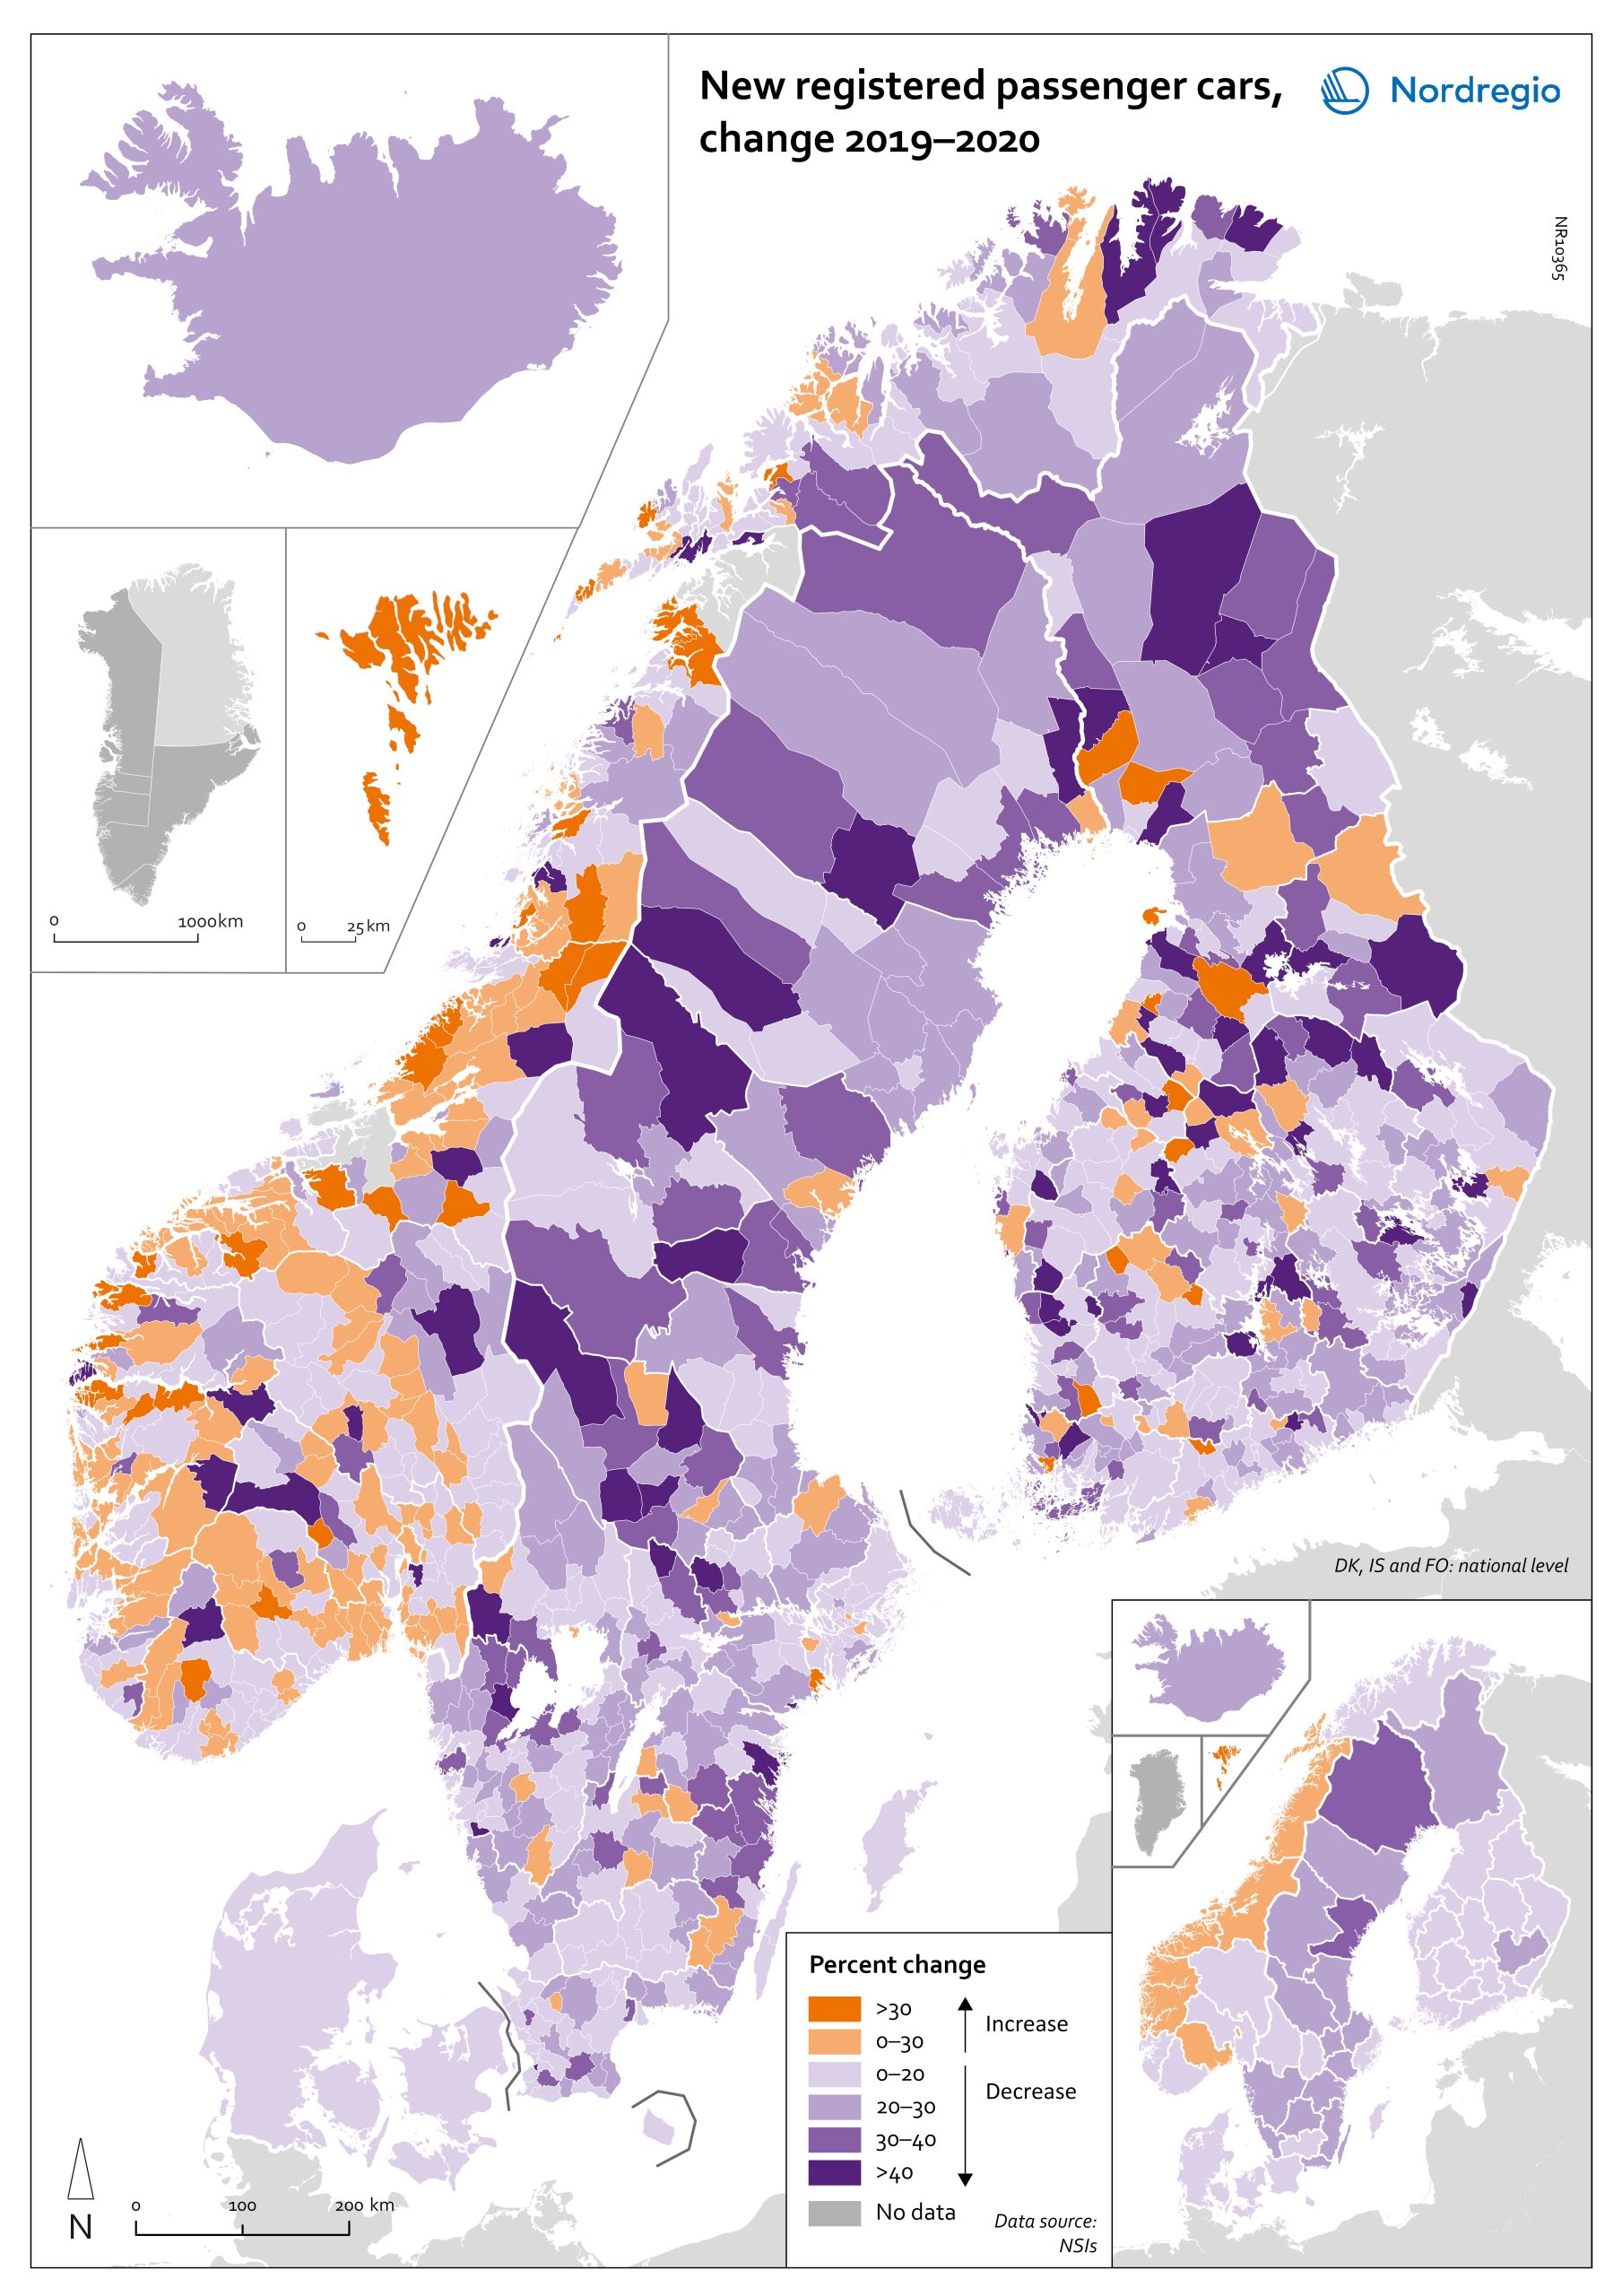
Change in new registered cars 2019-2020
The map shows the change in new registered passenger cars from 2019 to 2020. In most countries, the number of car registrations fell in 2020 compared to 2019. On a global scale, it is estimated that sales of motor vehicles fell by 14%. In the EU, passenger car registrations during the first three quarters of 2020 dropped by 28.8%. The recovery of consumption during Q4 2020 brought the total contraction for the year down to 23.7%, or 3 million fewer cars sold than in 2019. In the Nordic countries, consumer behaviour was consistent overall with the EU and the rest of the world. However, Iceland, Sweden, Finland, Åland, and Denmark recorded falls of 22%–11% – a far more severe decline than Norway, where the market only fell by 2.0%. The Faroe Islands was the only Nordic country to record more car registrations, up 15.8% in 2020 compared to 2019. In Finland, Iceland, Norway, and Sweden, there were differences in car registrations in different parts of the country. In Sweden and Finland, the position was more or less the same in the whole of the country, with only a few municipalities sticking out. In Finland and Sweden, net increases in car registrations were concentrated in rural areas, while in major urban areas, such as Uusimaa-Nyland in Finland and Västra Götaland and Stockholm in Sweden, car sales fell between 10%–22%. Net increases in Norway were recorded in many municipalities throughout the whole country in 2020 compared to 2019.
- 2022 March
- Economy
- Nordic Region
- Transport
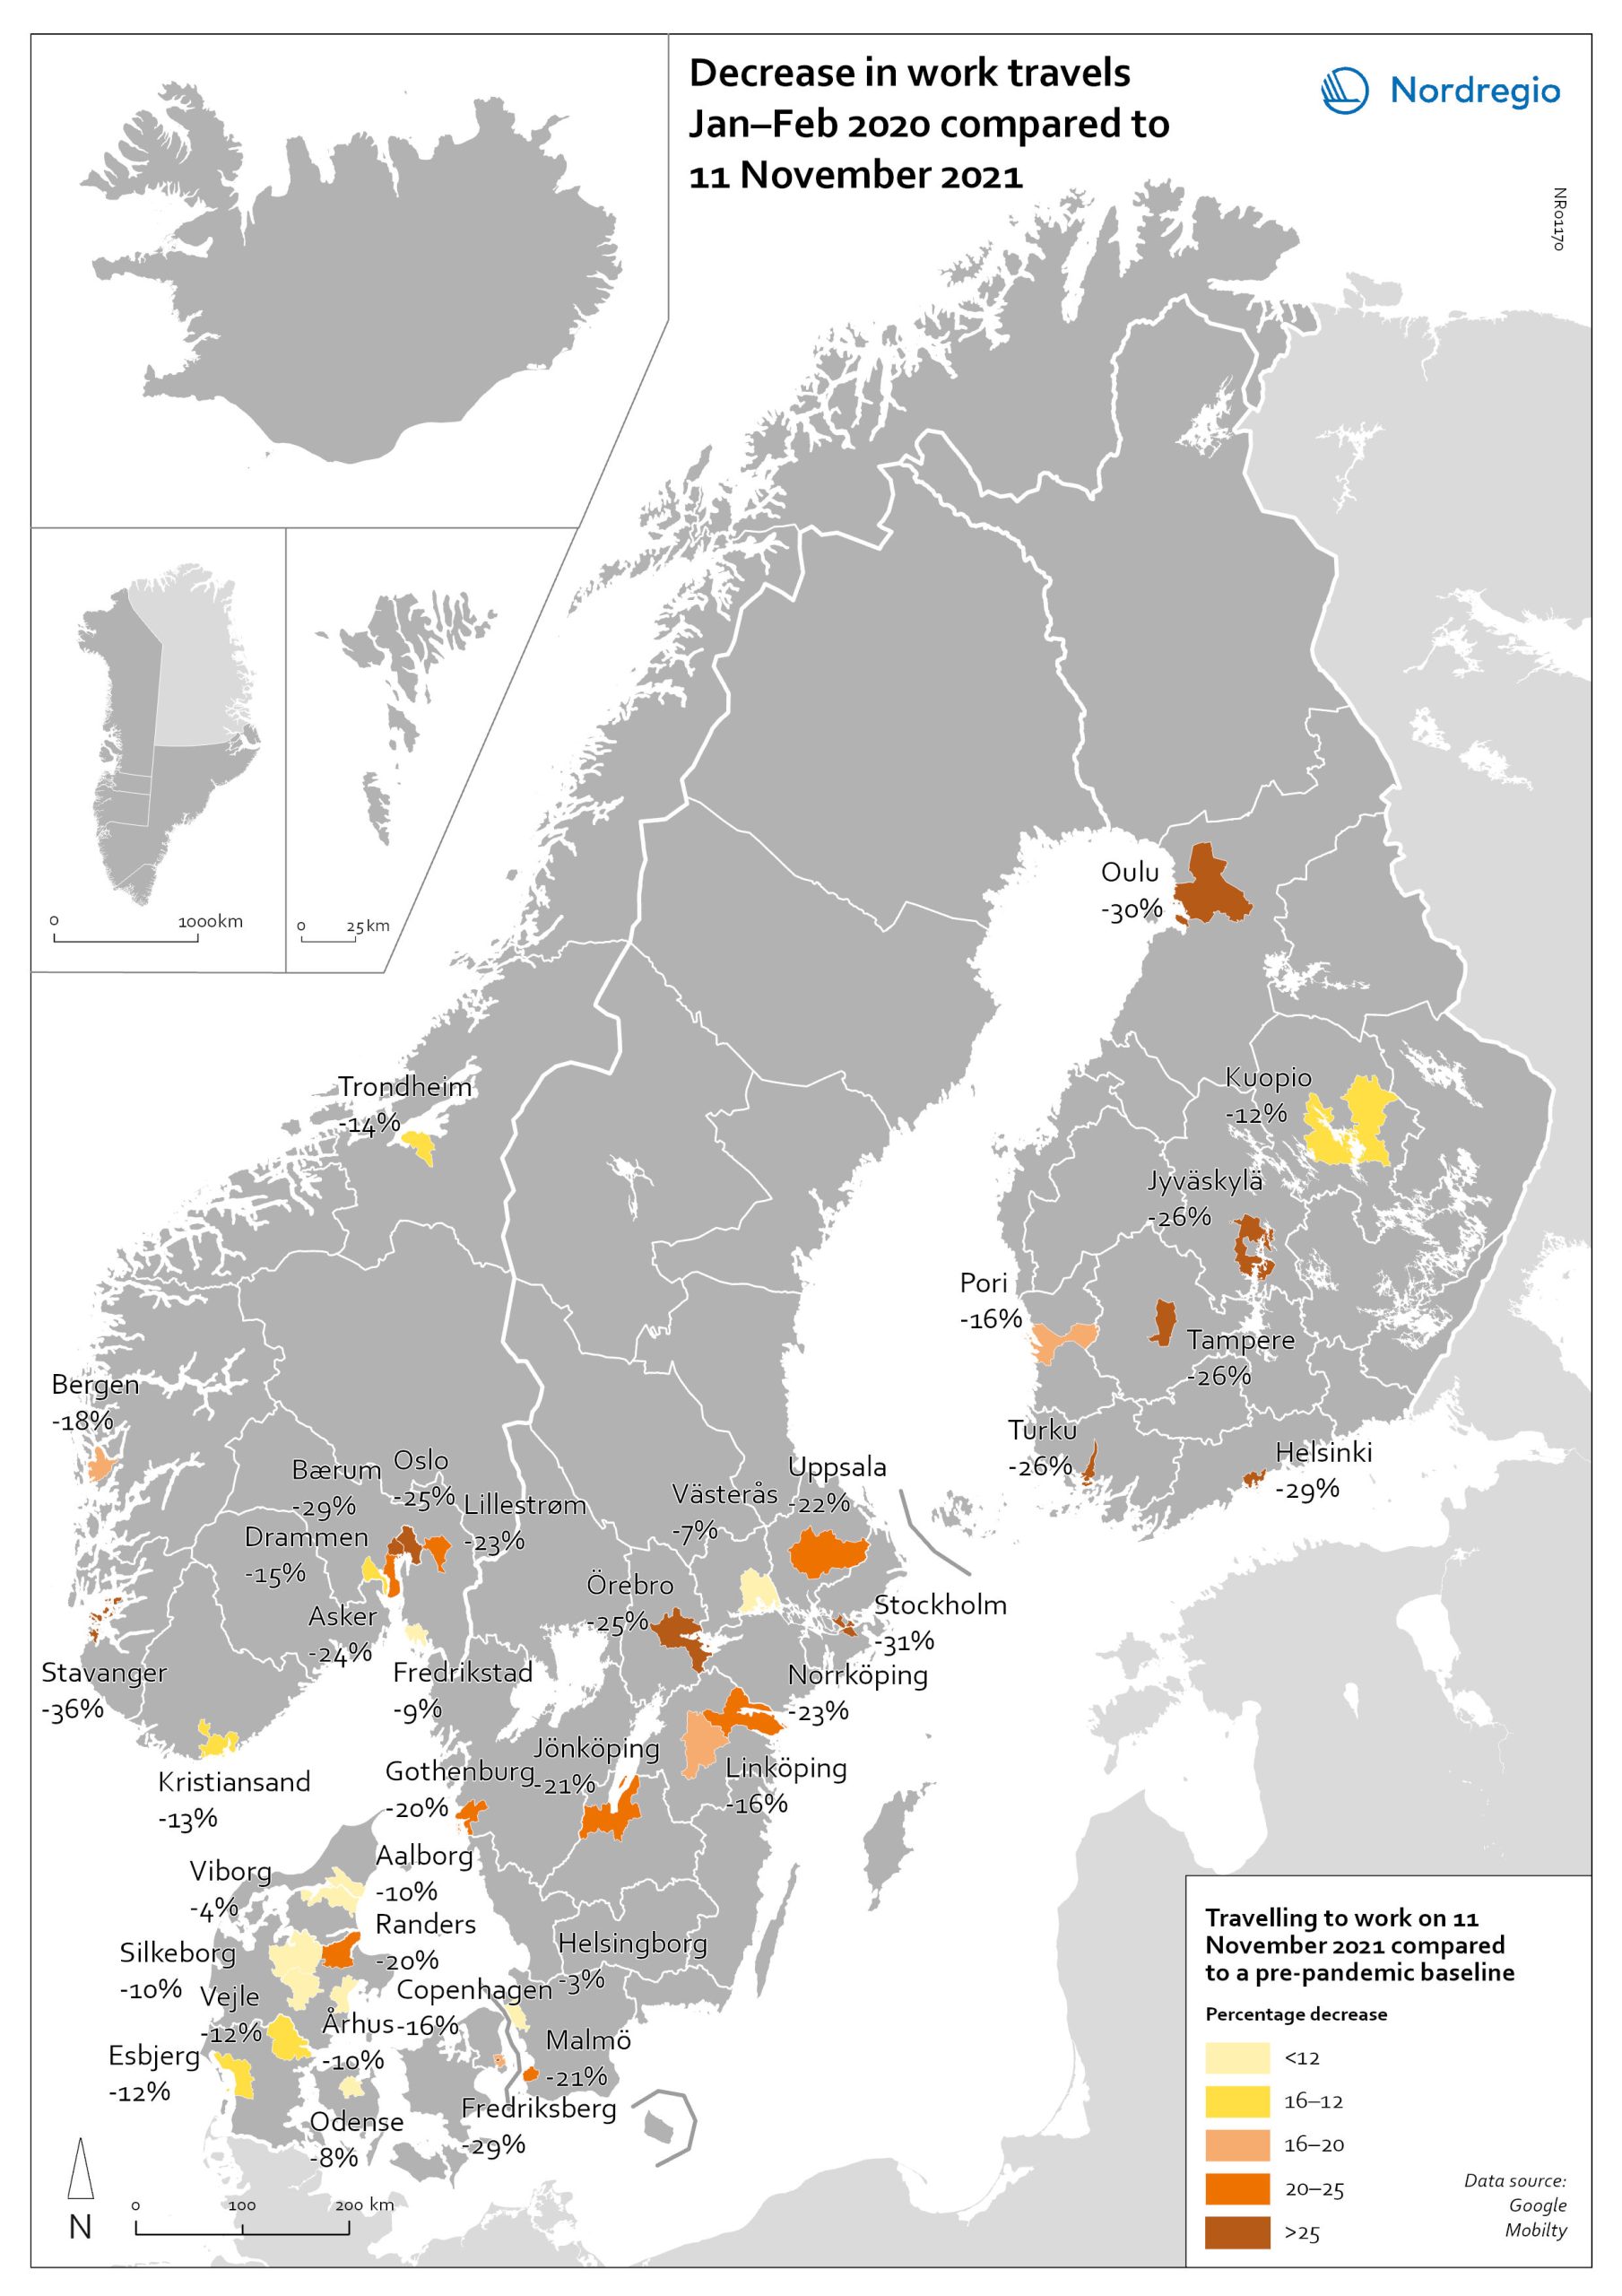
Change in work travels Jan-Feb 2020 compared to Nov 2021
The map shows changes in number of people travelling to work in the Nordic municipalities with the biggest populations comparing November 2021 to a pre-pandemic baseline. The map compares the average number of people who travelled to work on a weekday in January and February 2020 with the number of people who travelled to work on 11 November 2021 in the ten largest cities of Denmark, Finland, Norway and Sweden. The date was selected as the reference date as it is considered to be a relatively typical Thursday. It also represents a point when few movement restrictions were in place in the Nordic countries. As can be seen from the map, all of the municipalities highlighted recorded a fall in work-related travel on 11 November compared to the pre-pandemic baseline. It was biggest in Stavanger (-36%), followed by Stockholm (-31%), Oulu (-30%), Bærum (adjacent to Oslo) (-29%), Frederiksberg (adjacent to Copenhagen) (-29%) and Helsinki (-29%). In general, the decrease was highest around the capital regions and larger cities, but there were exceptions, for example, Jyväskylä (-26%), Örebro (-25%), Jönköping (-21%), and Randers (-20%). Several large municipalities also stood out because their patterns did not change so much, for example, Helsingborg (-3%) and Västerås (-7%) in Sweden; Viborg (-3%) and Odense (-8%) in Denmark.
- 2022 March
- Labour force
- Nordic Region
- Transport
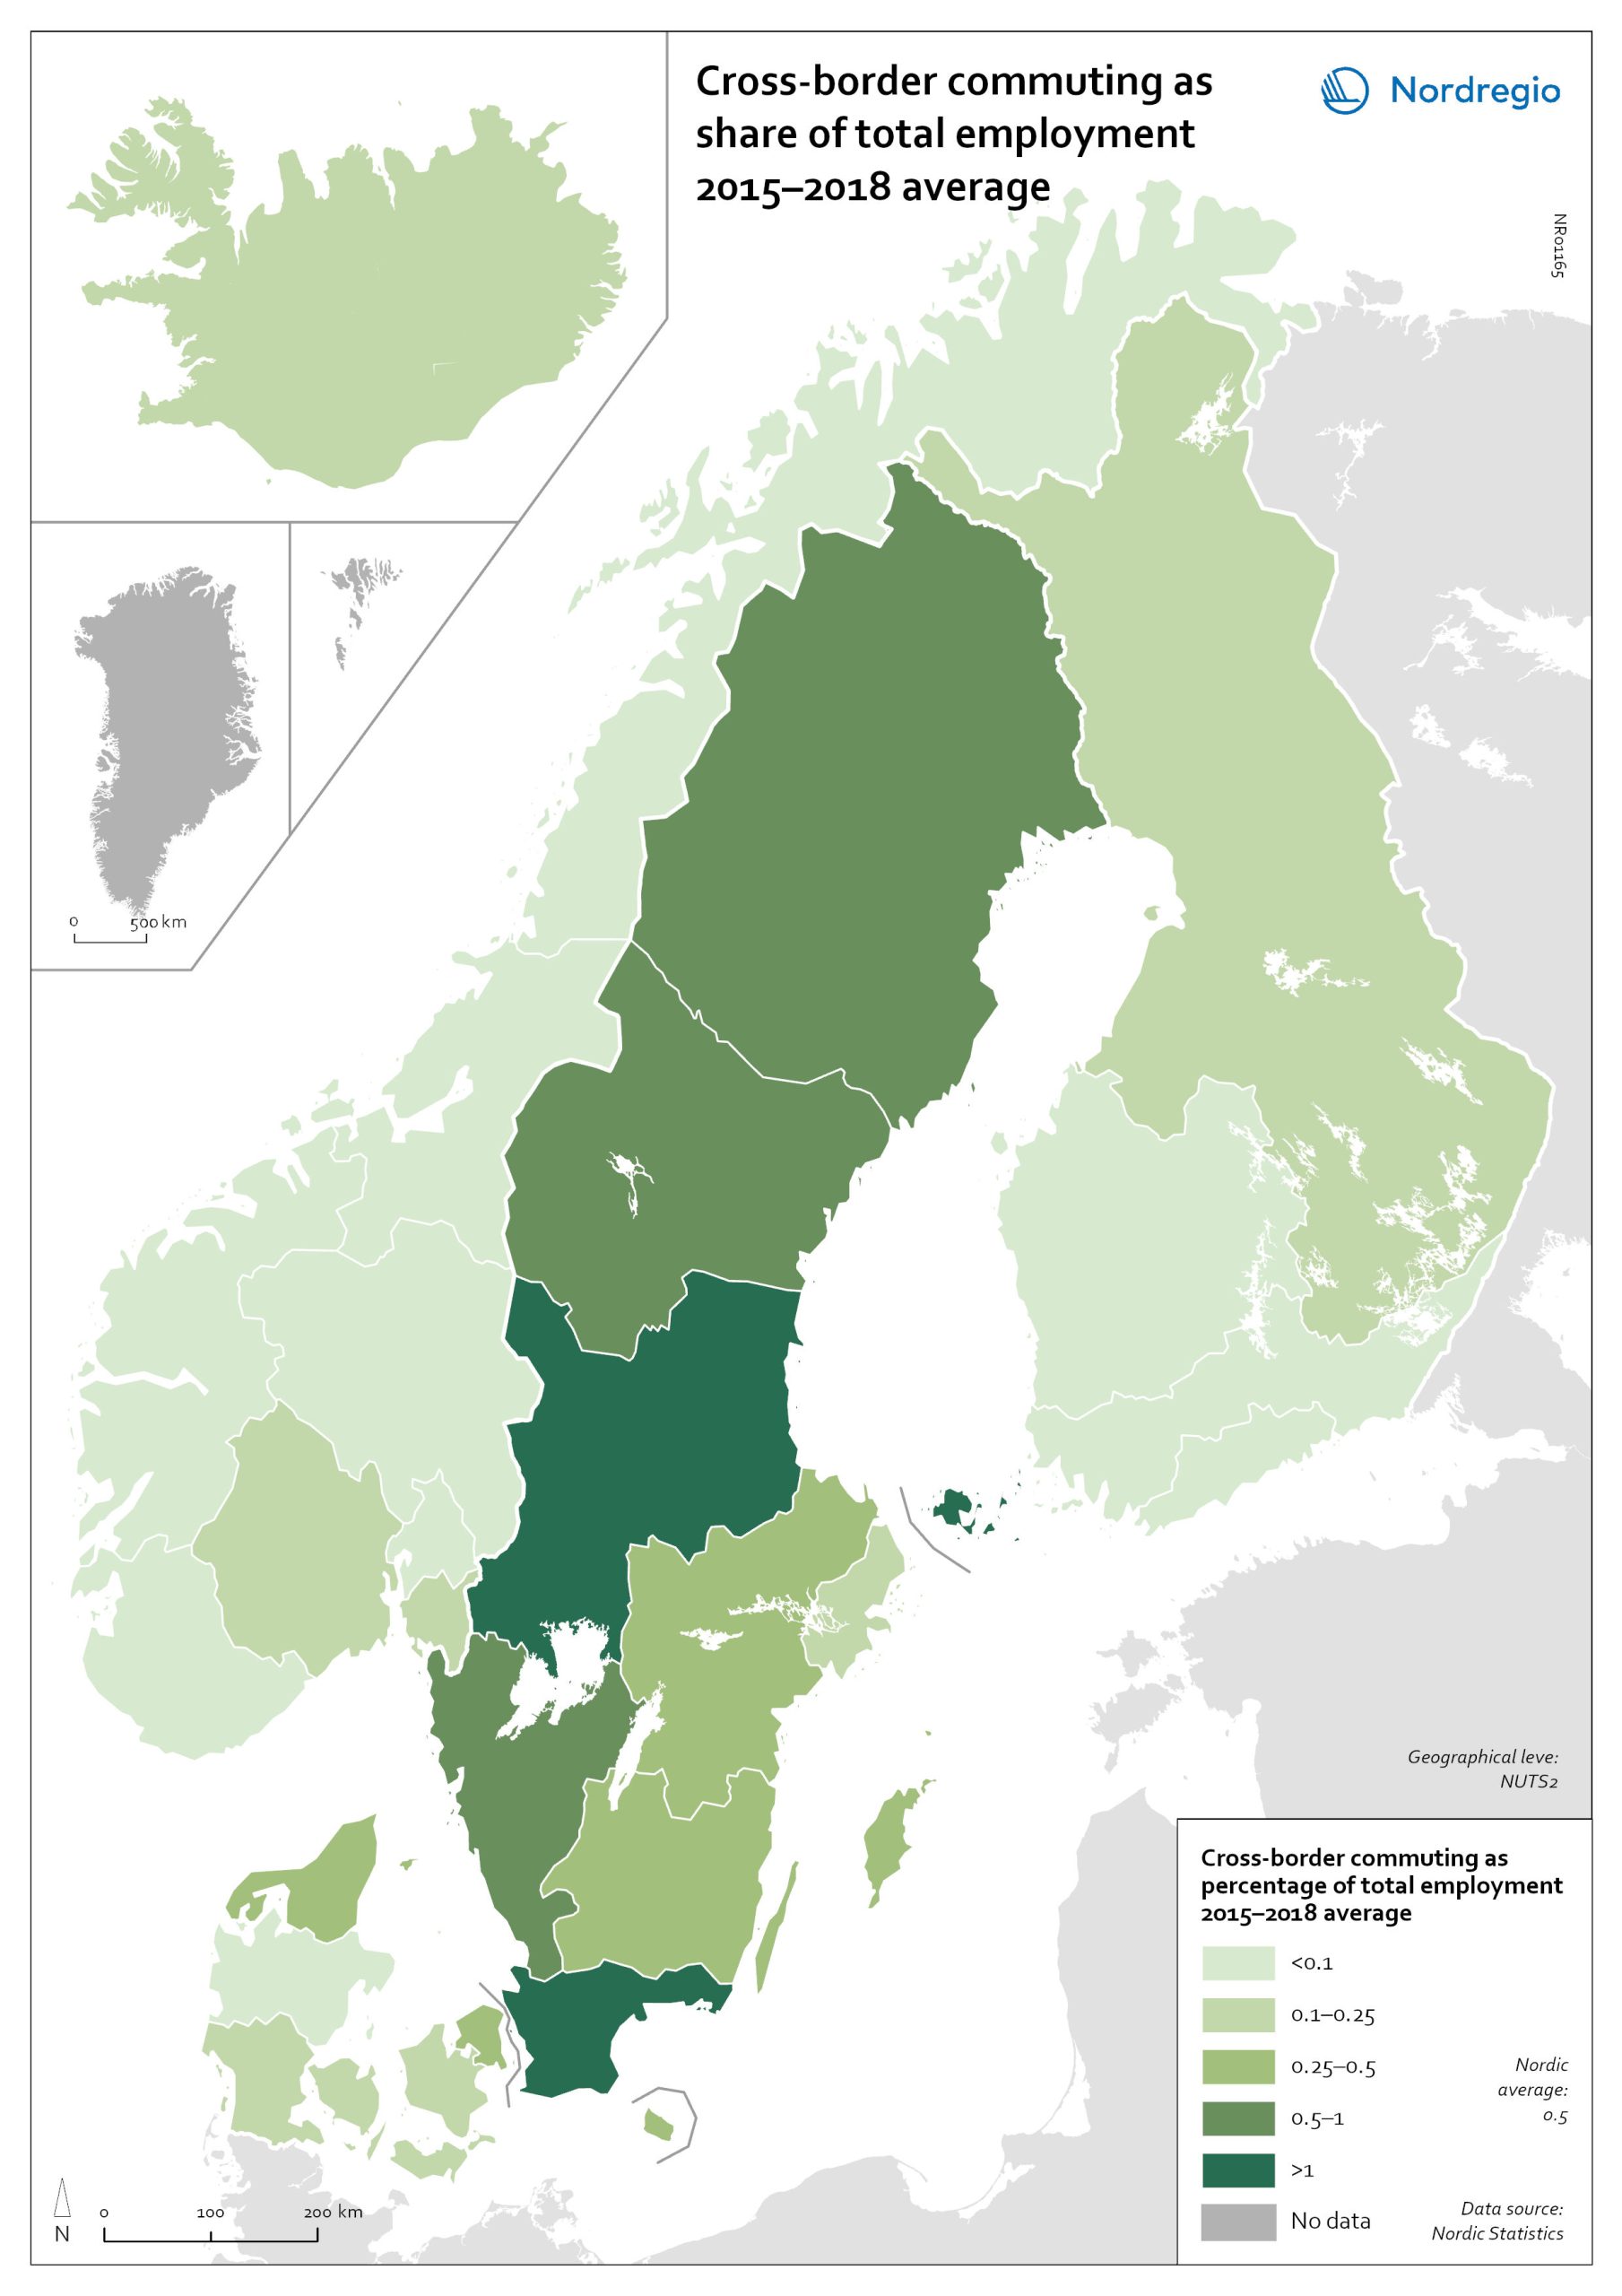
Cross-border commuting as share of employment
The map illustrates the average share of employees who commuted to another Nordic country between between 2015 and 2018 in Nordic regions (NUTS 2). Between 2015 and 2018, an average of approximately 49,000 people held a job in a Nordic country in which they were not residents. This indicates that, on average, 0.5% of the Nordic working-age population commuted to a job in another Nordic country. This is below the EU27 average of 1%, with the highest numbers found in Slovakia (5.1%), Luxembourg (2.8%) and Estonia (2.6%). Some of these people cross borders daily. Others work in another country by means of remote working combined with occasional commuting across borders. Within the Nordic Region, the largest cross-border commuter flows are in the southernmost parts of Sweden, regions in the middle of Sweden and in Åland, where more than 1% of the working population commutes to another Nordic country. However, there may be individual municipalities where cross-border commuting is substantially higher. For example, the employment rate in Årjäng Municipality, Sweden, increases by 15 percentage points when cross-border commuting is taken into account. These municipalities are not reflected on NUTS 2 level when averages are calculated. In terms of absolute numbers in 2015, the highest numbers of commuters were from Sweden: Sydsverige (16,543), Västsverige (7,899) and Norra Mellansverige (6,890). The highest number of commuters from a non-Swedish region were from Denmark’s Hovedstaden (2,583). Due to legislative barriers regarding the exchange of statistical data on cross-border commuting between the Nordic countries, more recent data is not available.
- 2022 March
- Labour force
- Nordic Region
- Transport
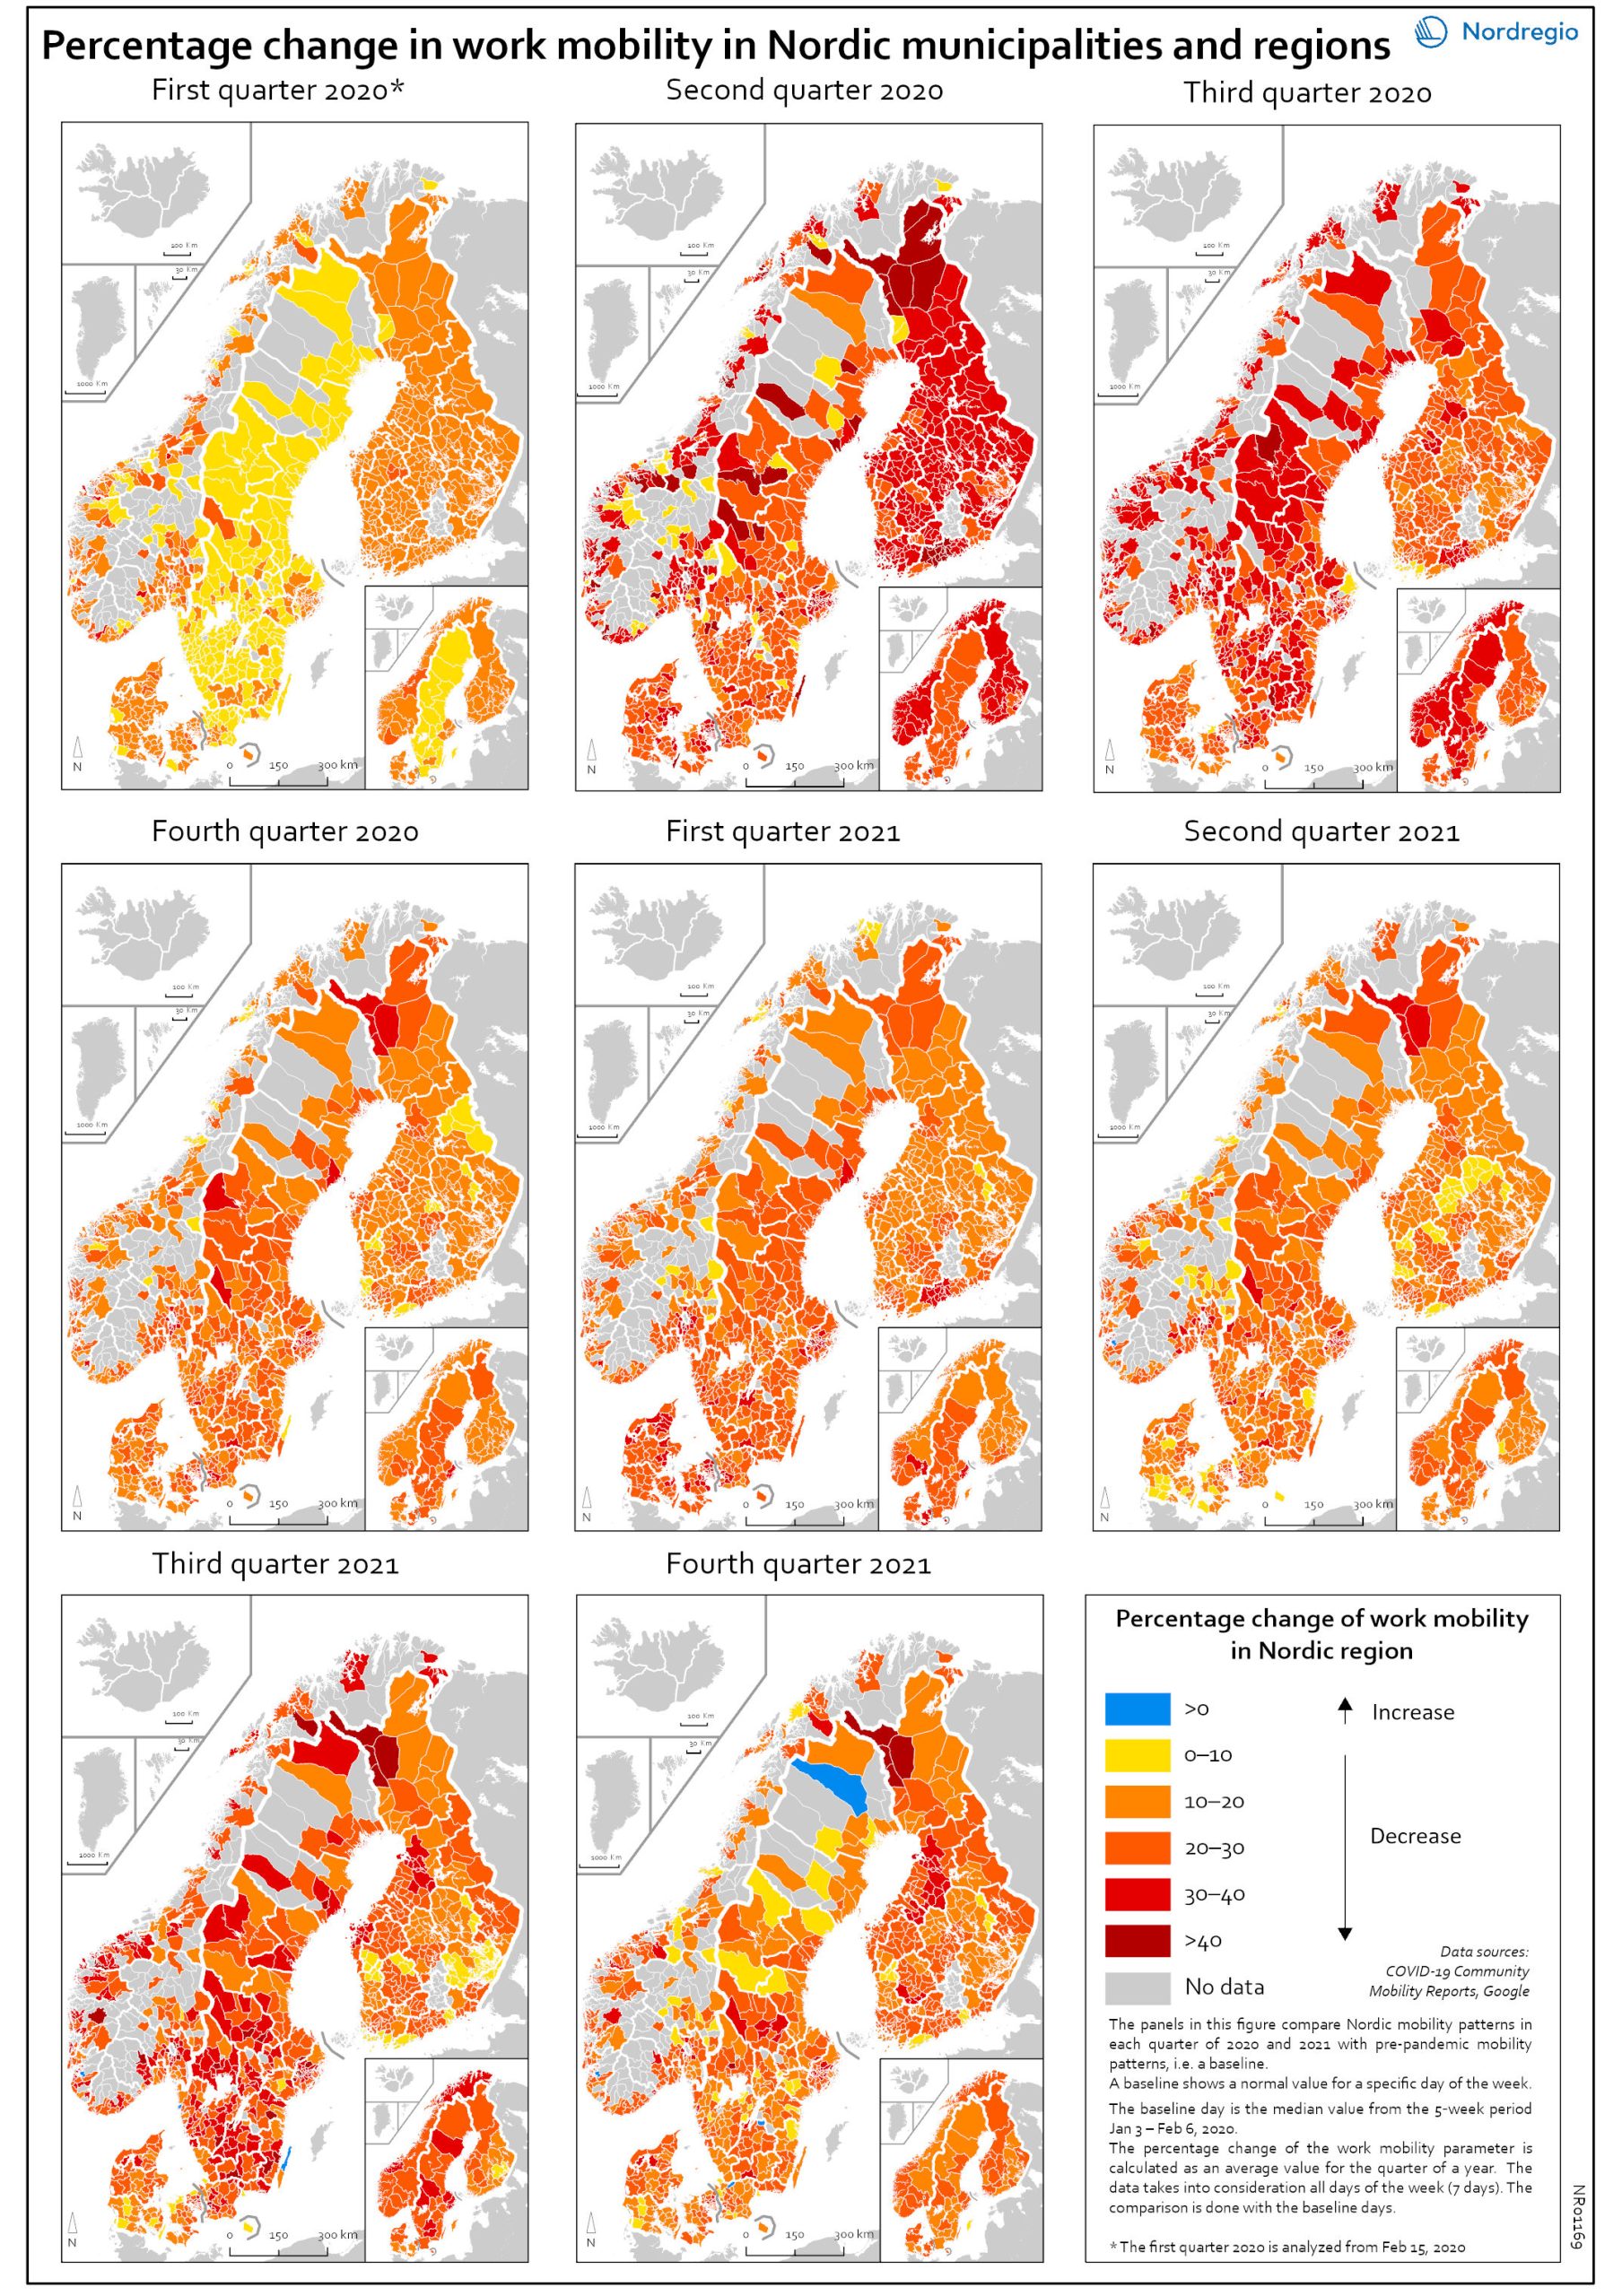
Work mobility per municipality and region by quarter
The map shows the percentage change for work mobility in Nordic regions and municipalities compared to a pre-pandemic baseline. The maps compare Nordic mobility patterns in each quarter of 2020 and 2021 with a pre-pandemic baseline. Based on Google data, the panels illustrate the impact of national restrictions and how those restrictions hampered work mobility. As the restrictions were both national and regional in nature, some regions and municipalities were more affected than others. The darker areas in the map show that work mobility decreased the most Q2 and Q3 2020 and in Q3 2021. The panels also show that mobility decreased later in Sweden than in the other Nordic countries. However, the decrease in Q3 in both 2020 and 2021 may partly be explained by the summer vacation months, when work mobility tends to decrease anyway. In Q4 2021, the overall situation seems to improve, although the pattern is mixed. In a few municipalities the situation is almost back to pre-pandemic baseline while in most municipalities, there is still less mobility in the labour market compared to the pre-pandemic situation.
- 2022 March
- Labour force
- Nordic Region
- Transport
Change in share of biofuels in transport from 2010 to 2018
This map shows change in share of biofuels in final energy consumption in transport in the Nordic Arctic and Baltic Sea Region from 2010 to 2018. Even though a target for greater use of biofuels has been EU policy since the Renewable Energy and Fuel Quality Directives of 2009, development has been slow. The darker shades of blue on the map represent higher increase, and the lighter shades of blue reflect lower increase. The lilac color represent decrease. The Baltic Sea represents a divide in the region, with countries to the north and west experiencing growth in the use of biofuels for transport in recent years. Sweden stands out (16 per cent growth), while the other Nordic countries has experienced more modest increase. In the southern and eastern parts of the region, the use of biofuels for transport has largely stagnated. Total biofuel consumption for transport has risen more than the figure indicates due to an increase in transport use over the period.
- 2021 December
- Arctic
- Baltic Sea Region
- Nordic Region
- Transport
Share of biofuels in transport in 2018
This map shows the share of biofuels in final energy consumption in transport in the Nordic Arctic and Baltic Sea Region in 2018. There has been considerable political support for biofuels and in the EU, this debate has been driven by the aim of reducing dependency on imported fuels. For instance, 10 per cent of transport fuel should be produced from renewable sources. The darker shades on the map represent higher proportions, and the lighter shades reflect lower proportions. As presented by the map, only Sweden (20.7%) had reached the 10 per cent target in the Nordic Arctic and Baltic Region in 2018. Both Finland (8.3%) and Norway (8.3%) were close by the target, while the other countries in the region were still lagging behind, particularly the Baltic countries.
- 2021 December
- Arctic
- Baltic Sea Region
- Nordic Region
- Transport

