This map shows unemployment rates among 20-64–year-olds across the Nordic Region, 2024.
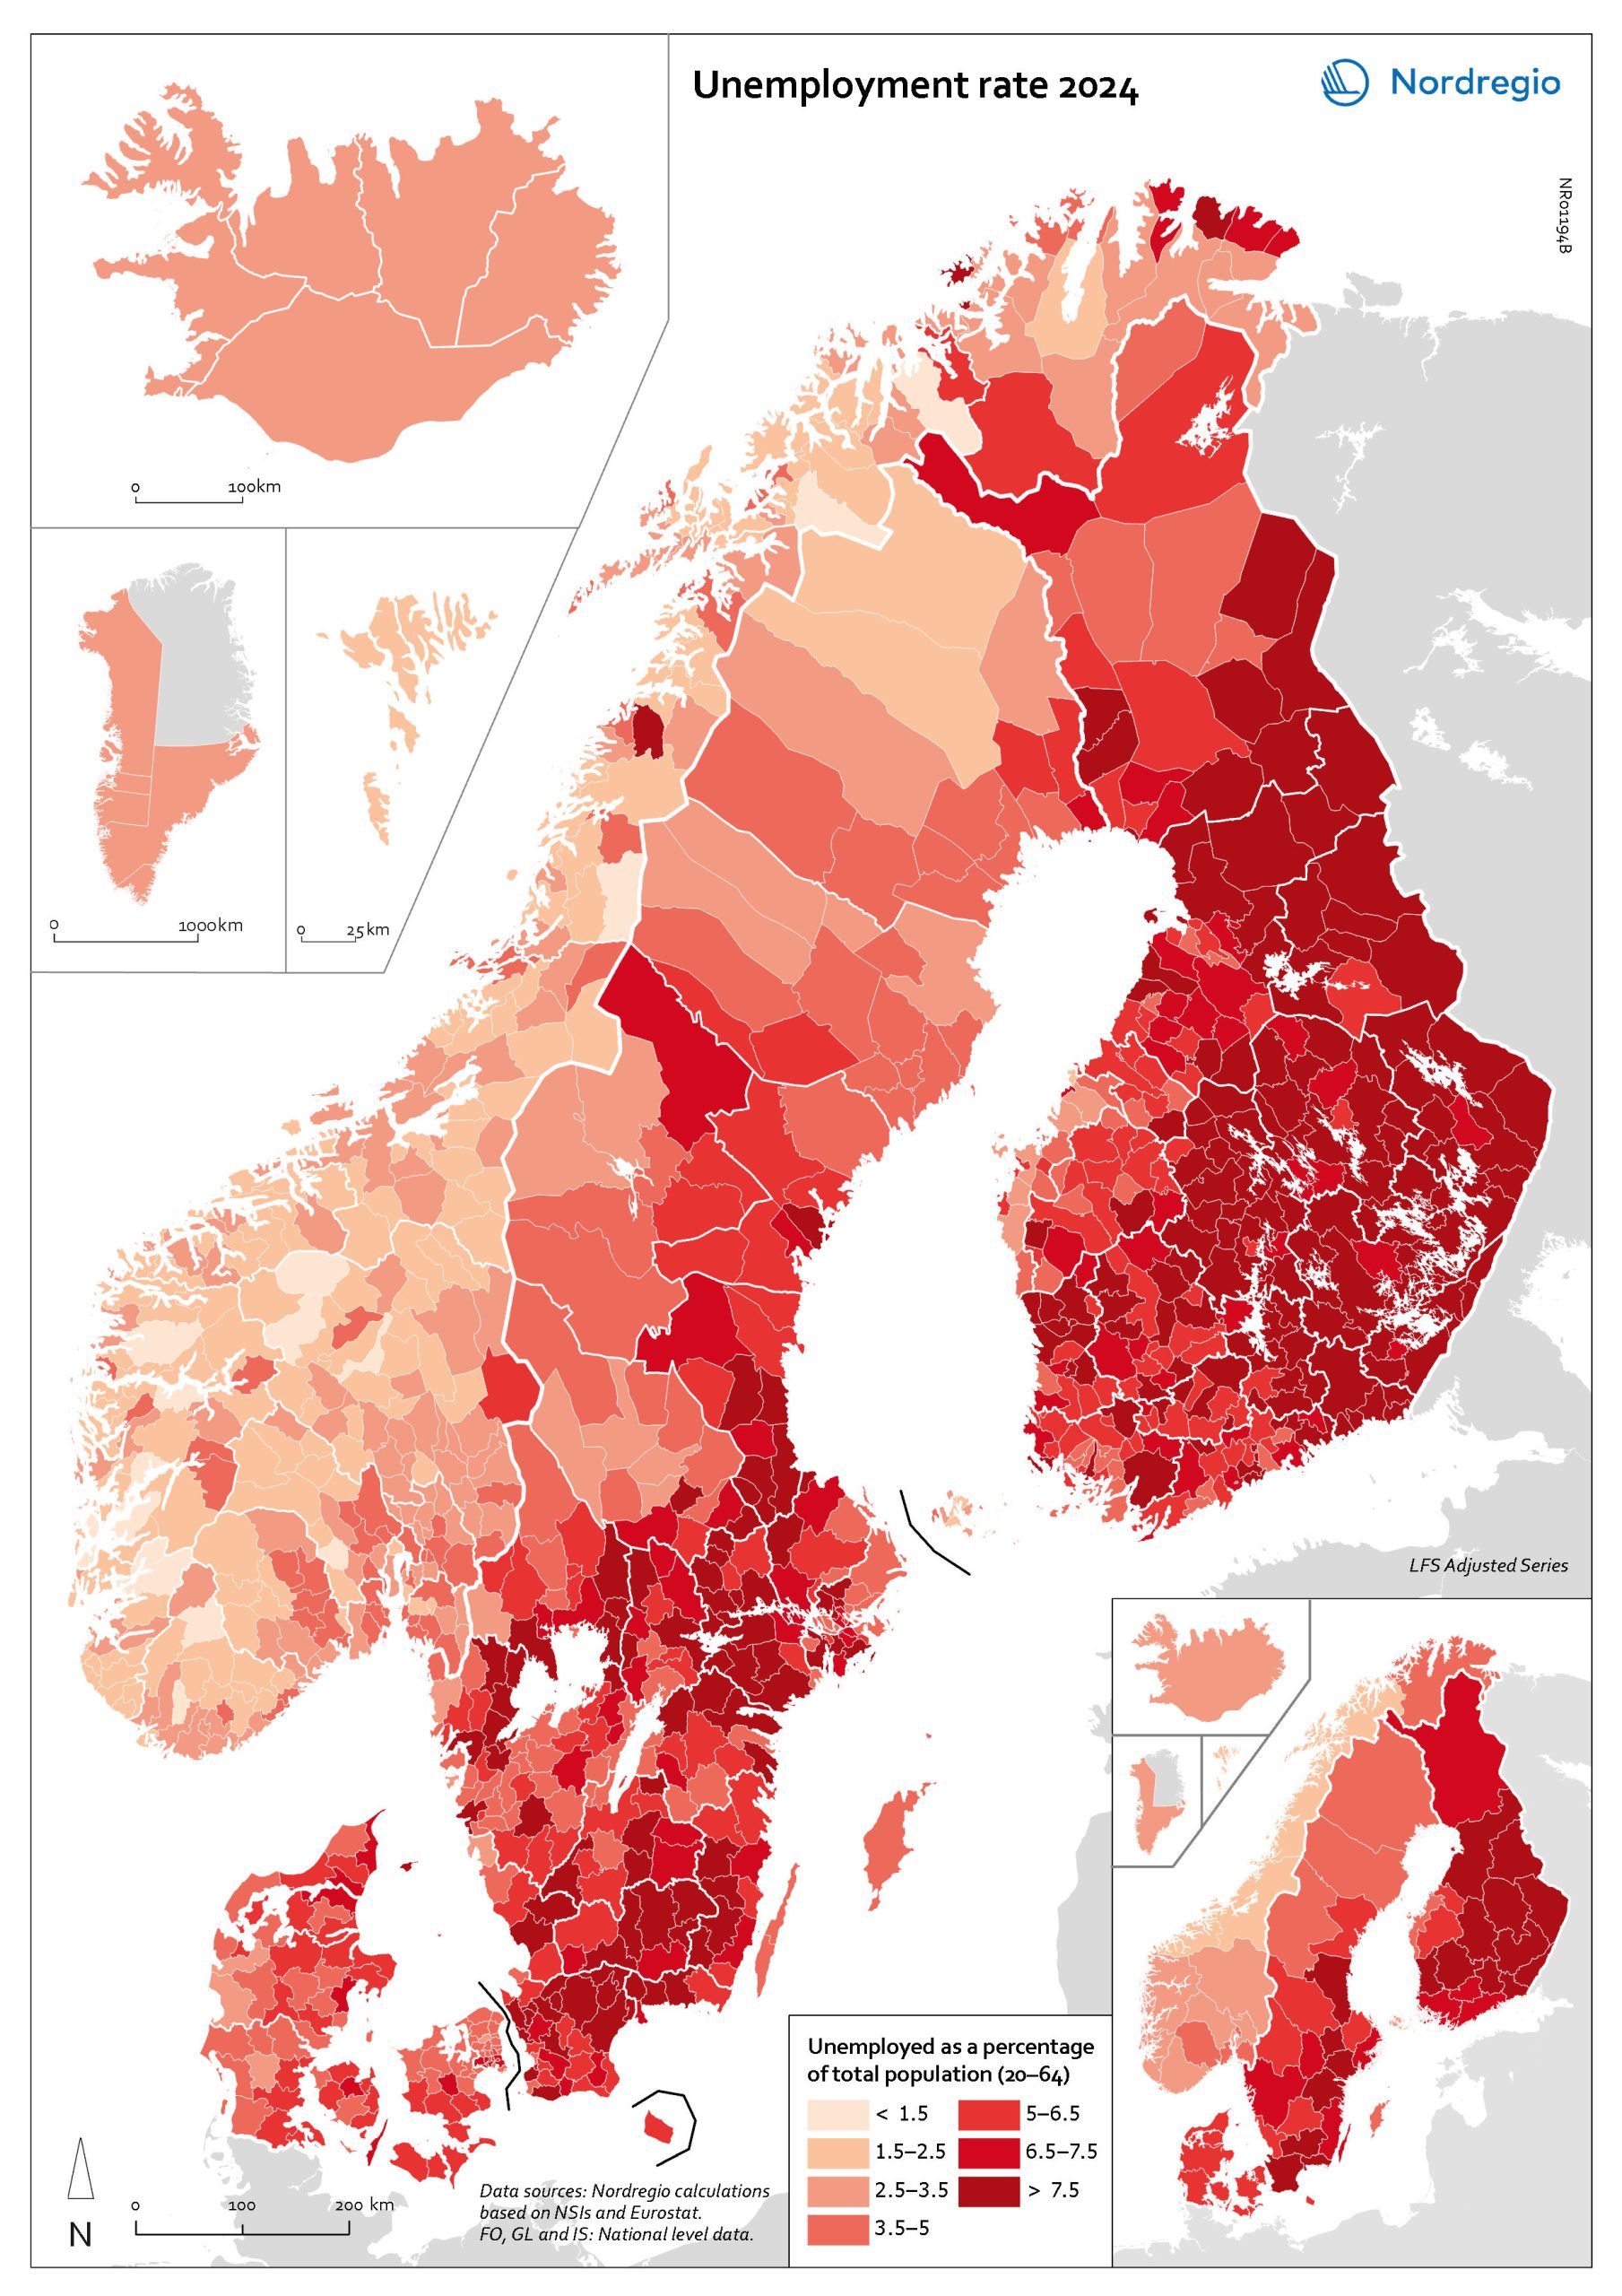
The map is included in the State of the Nordic Region 2026 report (Chapter 5).
25 March, 2026
This map shows unemployment rates among 20-64–year-olds across the Nordic Region, 2024.
The map is included in the State of the Nordic Region 2026 report (Chapter 5).

Junior Cartographer/GIS Analyst


