A few weeks ago, Nordregio published Disability indicators for the Nordic Statistics Database: Assessment and selection, a report bringing together existing statistics on the living conditions of persons with disabilities across the Nordic countries. We spoke with its author, Hjördís Guðmundsdóttir, researcher at Nordregio.
The Nordic countries are often associated with strong welfare systems and inclusive social policies. Yet understanding how persons with disabilities fare across different aspects of everyday life, for example education and employment, income or social participation, depends also on something less visible but equally important: comparable, reliable and timely data.

What was the main purpose of this work?
Hjördís Guðmundsdóttir: “The objective was to collect the available statistics and see how they can be used to monitor progress on the UN Convention [on the Rights of Persons with Disabilities] in the Nordic countries.”
More specifically, the work relates to Article 31 of the UN Convention on the Rights of Persons with Disabilities (UNCRPD), which highlights the importance of having good data to understand how the Convention is working in practice.
Statistics are, of course, only one part of that picture. The experiences of persons with disabilities, and the knowledge and work of disability organisations and other interest groups, are equally important. But robust data provides another tool for understanding inequalities, following developments over time and informing policies that seek to ensure equal opportunities.
Rather than building a new statistical framework from scratch, Hjördís examined what was already available (primarily through Eurostat) and assessed which indicators were relevant, comparable and suitable for a Nordic context.
From assessment to usable Nordic data
The Nordic Statistics Database managed and maintained by Nordregio, brings together more than 200 indicators from official sources across the Nordic Region.
The 17 disability-related statistical tables selected in the report are intended for publication in the said database, making it possible to follow the same indicators over time rather than relying on a one-off snapshot. There are still gaps to address. The underlying Eurostat data currently covers Denmark, Finland, Iceland, Norway and Sweden, while the Faroe Islands, Greenland and Åland are not included in
the same way.
Explore Nordic Statistics here.
Not everything could be included in the recommendations. Some indicators were relevant but too infrequent, too difficult to compare or not sufficiently suitable for continous monitoring. That distinction between what matters and what can actually be measurerd regularly became one of the central issues in the work.
How did you decide which indicators would make the cut?
Timeliness was one of the key considerations, with relevance and comparability.
“If there are six years between the data points, that is probably too long for us to understand what is taking place,” Hjördís explains.
Discrimination is a good example. Information on whether persons with disabilities experience discrimination in employment or when interacting with public services is highly relevant. But if that information is collected only occasionally, it becomes difficult to use for regular monitoring.
“If there are six years between the data points, that is probably too long for us to understand what is taking place.”
Was there anything in the data you assessed that particularly stood out?
“For me, the most concerning was access to education,” Hjördís says.
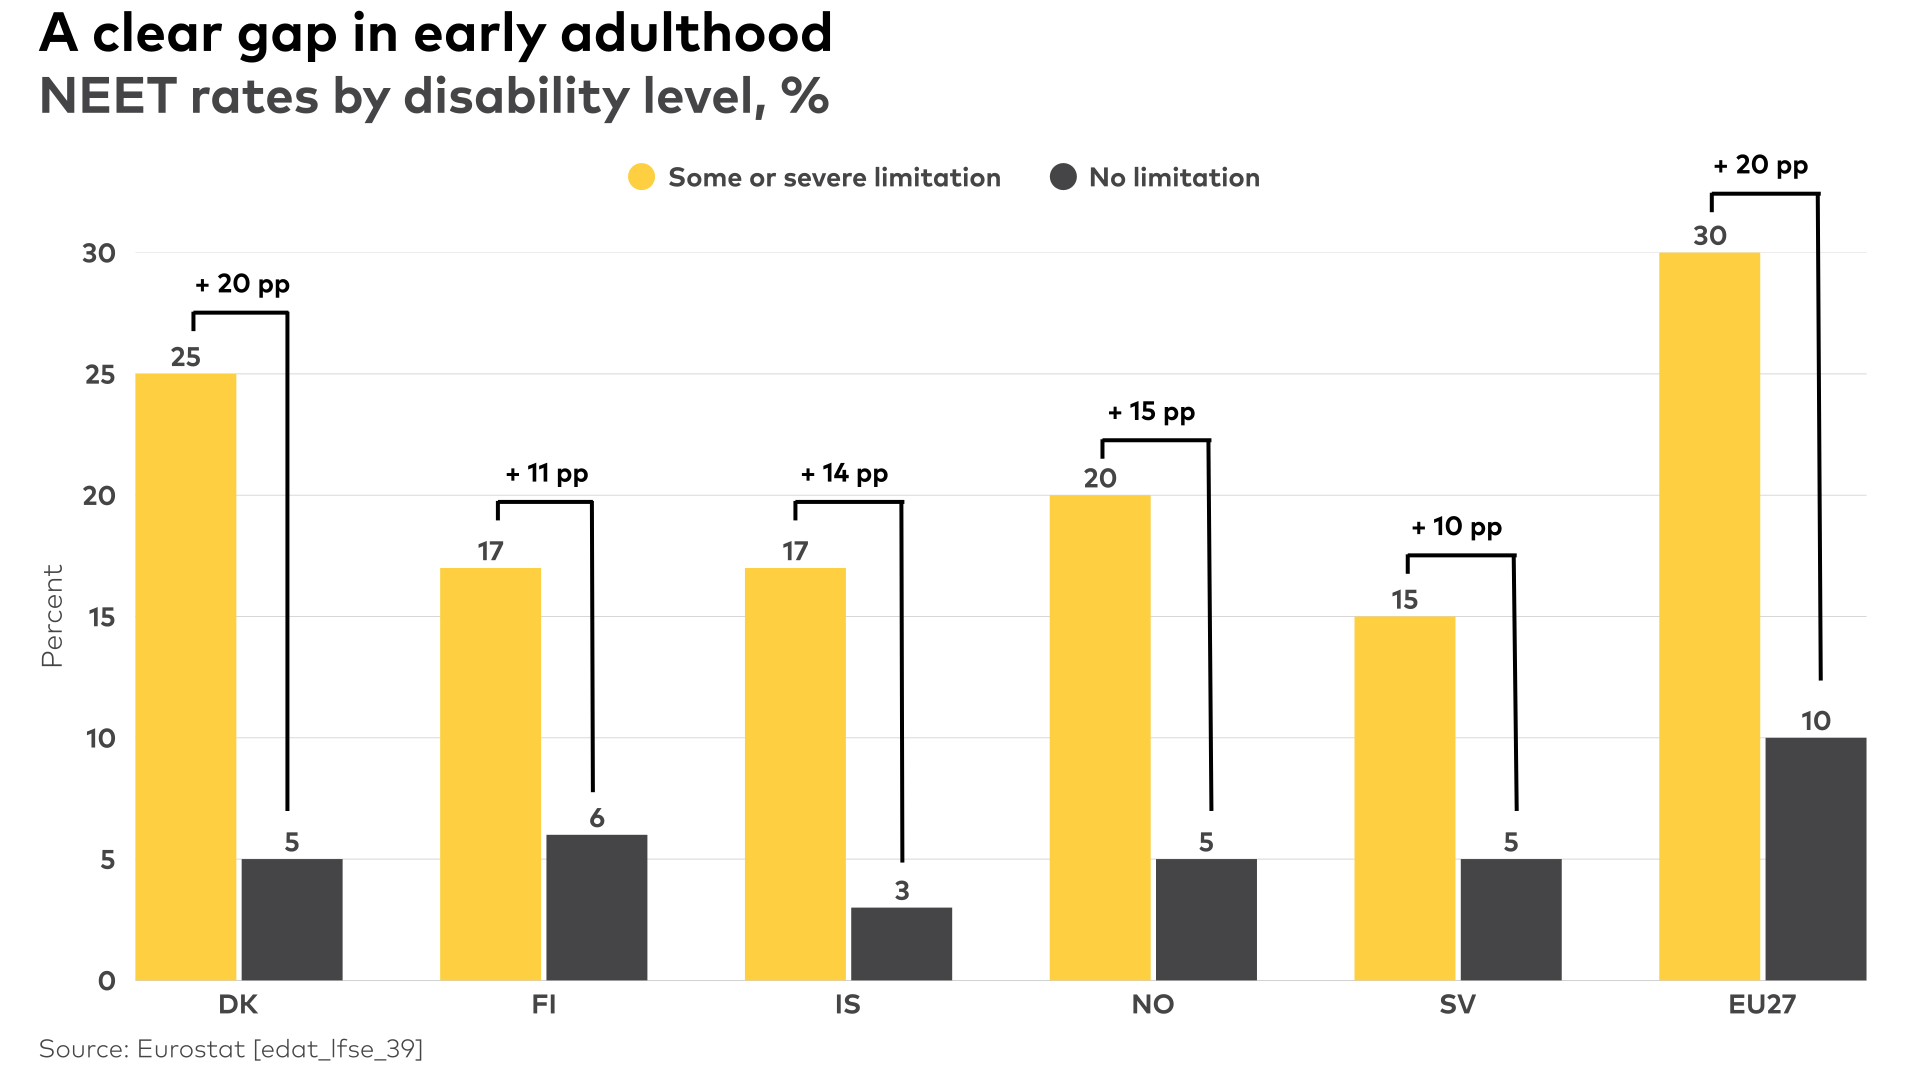
She points in particular to the comparatively high shares of early school leavers and young people neither in employment nor in education or training (commonly referred to as NEET) among persons with more severe disabilities.
About this figure
Share of persons neither in employment nor in education and training (NEET rates) by level of disability among persons aged 15–29 years living in private households. Most recent year available (2024 for Denmark, Finland, Norway, Sweden and EU27; 2022 for Iceland).
For Hjördís, another takeaway after writing the report is about what the available statistics do not show.
“I think information on children is extremely important for policymakers and other stakeholders,” she says.
Many of the available datasets cover only people above a certain age. There are other blind spots too. Several statistics concern persons living in private households, leaving limited information on people living in institutional settings, group housing or care facilities. These limitations matter because what is not measured regularly is, again, much harder to follow over time.
So what can policymakers and researchers learn from the disability statistics that are available?
Despite those gaps, the report shows considerable potential in the statistics that already exist.
“We can compare opportunities and quality of life for people with disabilities with people without disabilities, across the Nordic countries” Hjördís says.
The indicators cover areas including disability prevalence, education and training, labour-market participation, income and living conditions, health and access to information. In many cases, the data can also be broken down by variables such as sex or degree of activity limitation and followed over time.
The aim is not to rank Nordic countries against one another. Rather, comparison can help reveal differences, trends and areas that merit closer attention, including challenging the assumption that persons with disabilities necessarily fare better on every measure simply because they live in a Nordic welfare state.
“We can compare opportunities and quality of life for people with disabilities with people without disabilities, across the Nordic countries.”
Bringing these indicators into Nordic Statistics will require further work to harmonise the data and improve territorial coverage, including for Åland, the Faroe Islands and Greenland. Once completed, users will be able to explore a more complete and comparable picture of the Nordic Region in one place and follow how conditions develop over time.
Who should read the report?
“You don’t have to be a statistician,” Hjördís says. “Anyone who is interested in the quality of life of people with disabilities will find this report interesting.”
That is also one of the report’s strengths. Its graphs and comparative indicators provide different entry points for different users: researchers looking for comparable evidence, policymakers following potential policy outcomes, organisations working on disability issues or anyone seeking a clearer picture of living conditions for persons with disabilities in the Nordic Region.
Ultimately, the report provides both a baseline and an invitation: to use the evidence already available, to recognise what is still missing, and to strengthen the statistics needed to follow progress towards more inclusive Nordic societies.