11 News

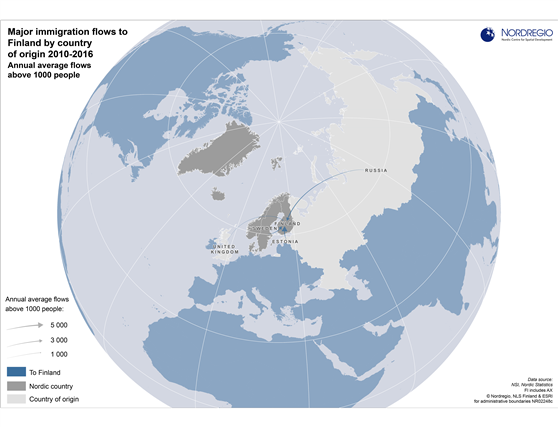
Major immigration flows to Finland 2010-2016
Average annual flows above 1000 people by country of origin Migration flows by country of origin are of growing interest in the Nordic Region due to the recent unprecedented inflows of migrants. There are also interesting differences between the Nordic countries with respect to the dominant countries of origin of migrants and the size of inflows. Finland had only four inflows exceeding annual averages of 1000 people during the measured period. The inflow from Estonia was by far the largest, an annual average of around 5000 people, flowed by inflows from Sweden and Russia (just under 3000), and the United Kingdom (around 1000).
 2017 June
 - Demography
- Finland
- Migration
- Nordic Region
- Other