51 Maps
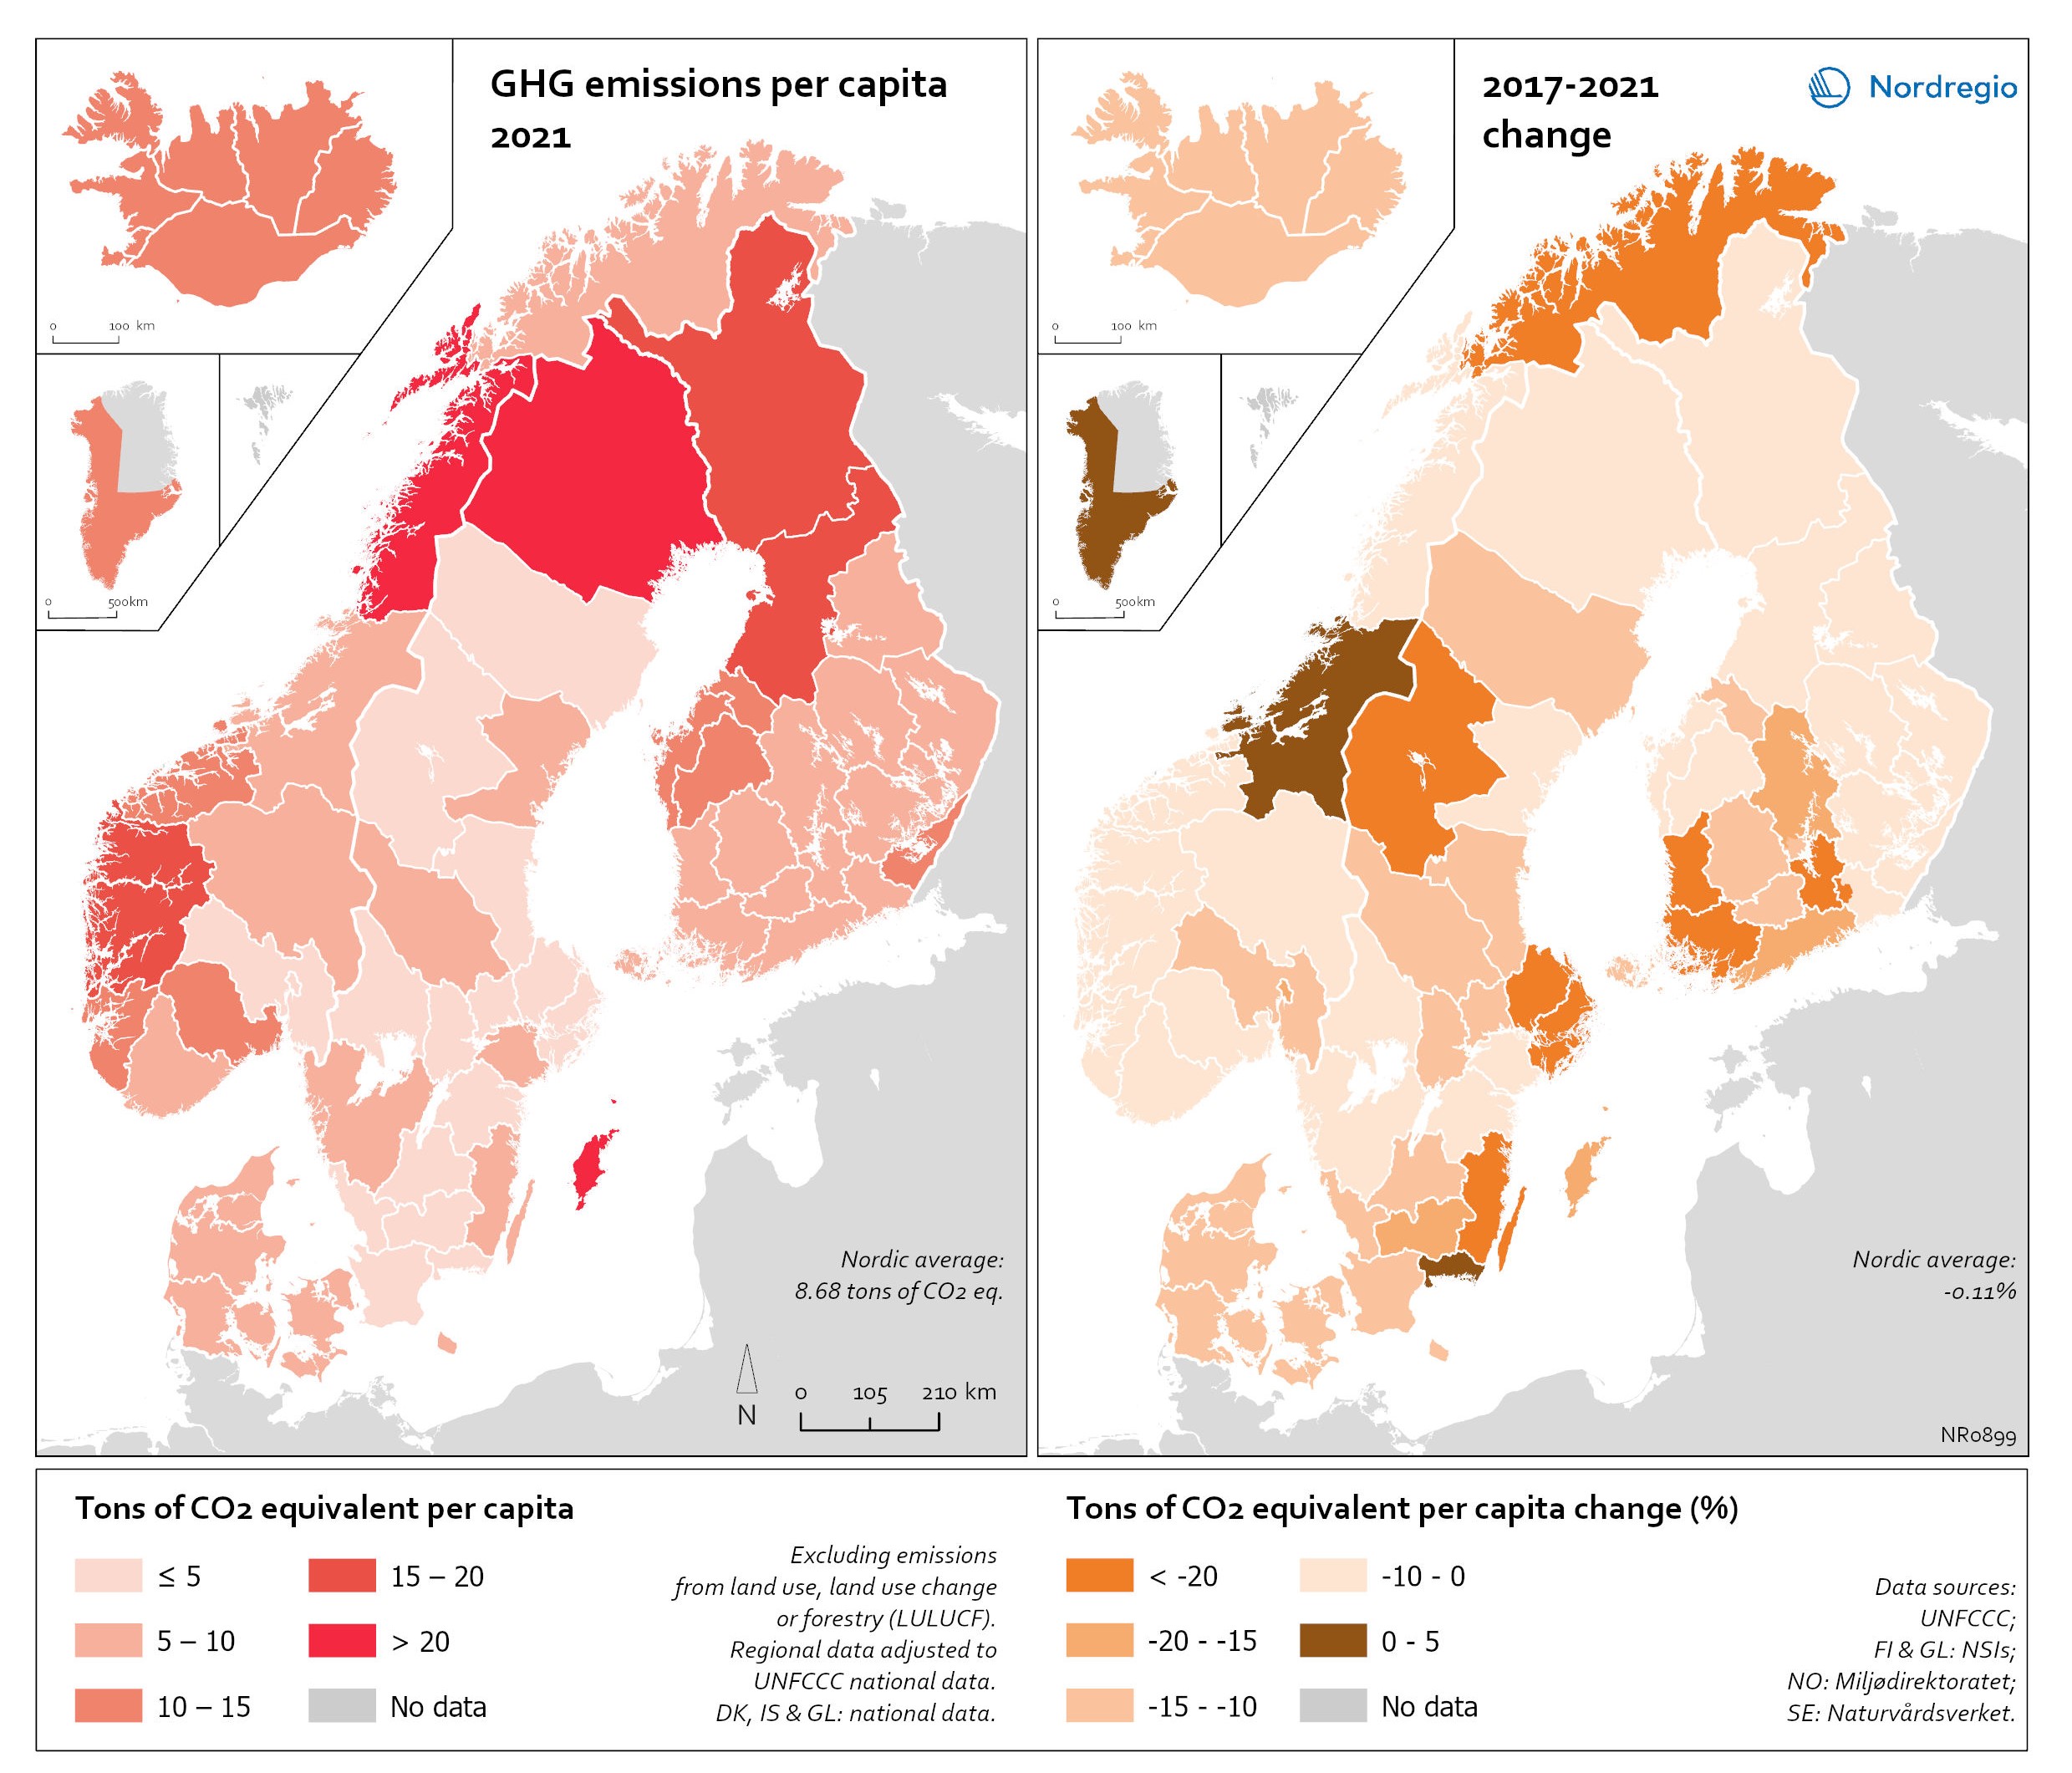
Regional GHG emissions per capita in 2021 and change 2017-2021 on a territorial basis
The data excludes emissions from land use, land use change or forestry (LULUCF). The regional data has been adjusted to UNFCCC national data. The data for Denmark, Iceland and Greenland is on national level. It should be noted that displaying emissions on a territorial basis may be skewed due to the inter-regional dynamics of energy processes, natural resource distributions and concentrations of industrial activities. From 2017 to 2021, the Nordic regions cut their per-capita GHG emissions by on average 11.3%, with an overall Nordic average fall of 8.7% over the same period. In regions historically reliant on fossil fuels for heat and power generation, emissions have continued to decline. This trend is evident in Denmark, as well as in Southern Sweden and Southern Finland – densely populated areas that have taken steps toward expanding district heating coverage and reducing carbon intensity. The largest decrease in GHG emissions per capita was found in Troms and Finnmark, with a 42.3% decrease, Satakunta with a 30.2% decrease and Päijät-Häme – Päijänne-Tavastland with a 29.2% decrease. Only three regions (Greenland, Trøndelag and Blekinge) saw an increase in GHG emissions per capita. At an aggregated level, industrial-related emissions decreased throughout the Nordic Region, but this trend does not hold true for regions in Norway with intensive offshore oil and gas operations. For instance, Nordland, Vestland, Møre og Romsdal, Vestfold and Telemark exhibited the highest per capita emissions in 2021. Between 2017 and 2021, emissions were increasing in many Norwegian regions with intensive offshore oil and gas activity, but also in Norrbotten in Sweden (21.2 tonnes of CO2 equivalent per capita) and Gotland (33.6 tonnes of CO2 equivalent per capita) due to intensive activity in the metal and cement industries, respectively, as well as in several Finnish regions. At the other end of the scale, the…
 2025 April
 - Environment
- Nordic Region
Electricity production 2021
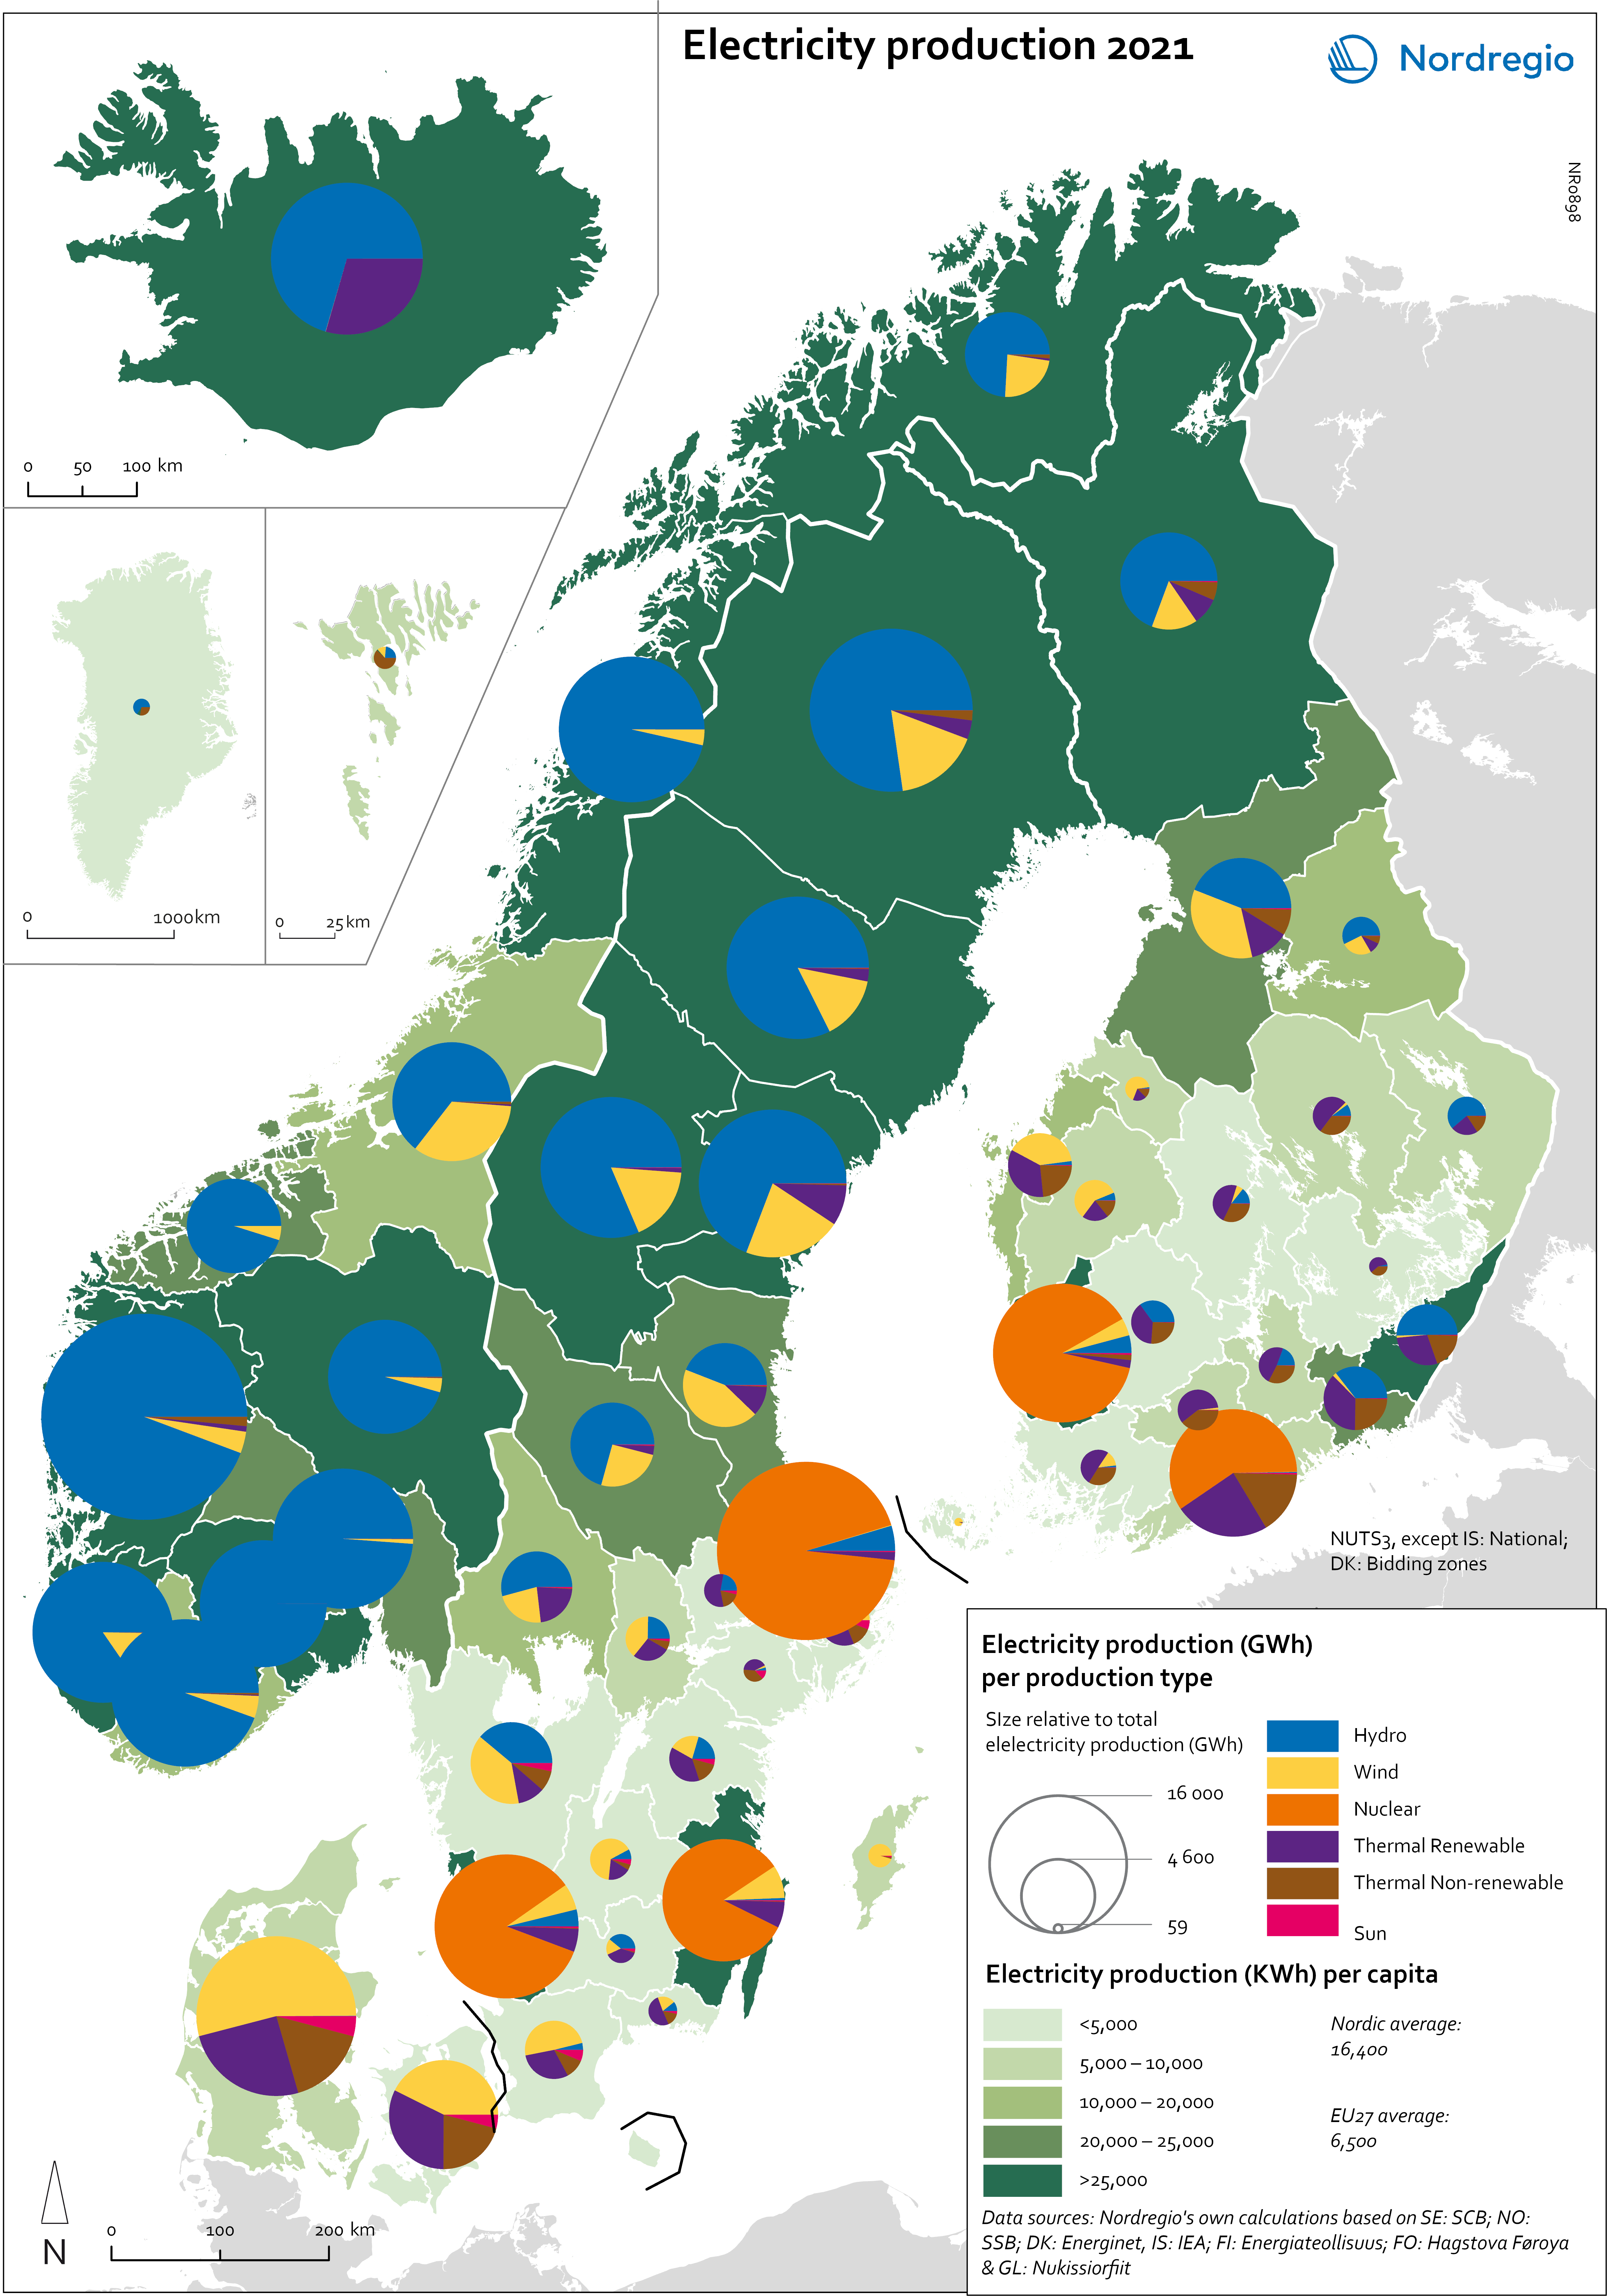
This map shows the spatial distribution of Nordic electricity production per capita, by volume and source type in the Nordic Region in 2021. The data is presented at a regional level, except for Iceland (national level) and Denmark (bidding zones). The circles represent electricity production in GWh, while the green shades indicate electricity production per capita (kWh). Finally, the colour of the circles denotes the source of electricity. The Nordic Region overall has a high electricity production per capita; in fact, Iceland and Norway have the world’s highest electricity production per capita. The electricity mix in 2021 was 96% fossil-free – 73% from renewables (mainly hydropower) and 17% from nuclear power. In 2000 85% of the electricity production was fossile-free. Still there are clear spatial differences in the electricity production. Firstly, we see the high amount of electricity being produced for the five nuclear facilities in Sweden and Finland. Secondly, a substantial volume of hydro-electricity is produced in southern Norway, throughout Iceland, Northern Sweden and Northern Finland. As a result, over half of Nordic electricity is produced from hydropower. Wind power is the source of electricity that has been growing the most during the last two decades, from 1.2% in 2000 to 14% in 2021. The regions with the highest electricity production per capita are in Iceland, Northern Sweden, and Northern and Western Norway. Both Finland and Denmark are net importers of electricity, but both countries have rapidly transitioned away from fossil fuels. Cheap and fossil-free electricity is a prerequisite for the green transition and with growing industries within e.g. battery production, green steel and mining, the need for fossil-free electricity is expected to increase in the coming decades.
- 2025 April
- Environment
- Labour force
- Nordic Region
Greenhouse gas emissions intensity of employment in 2022
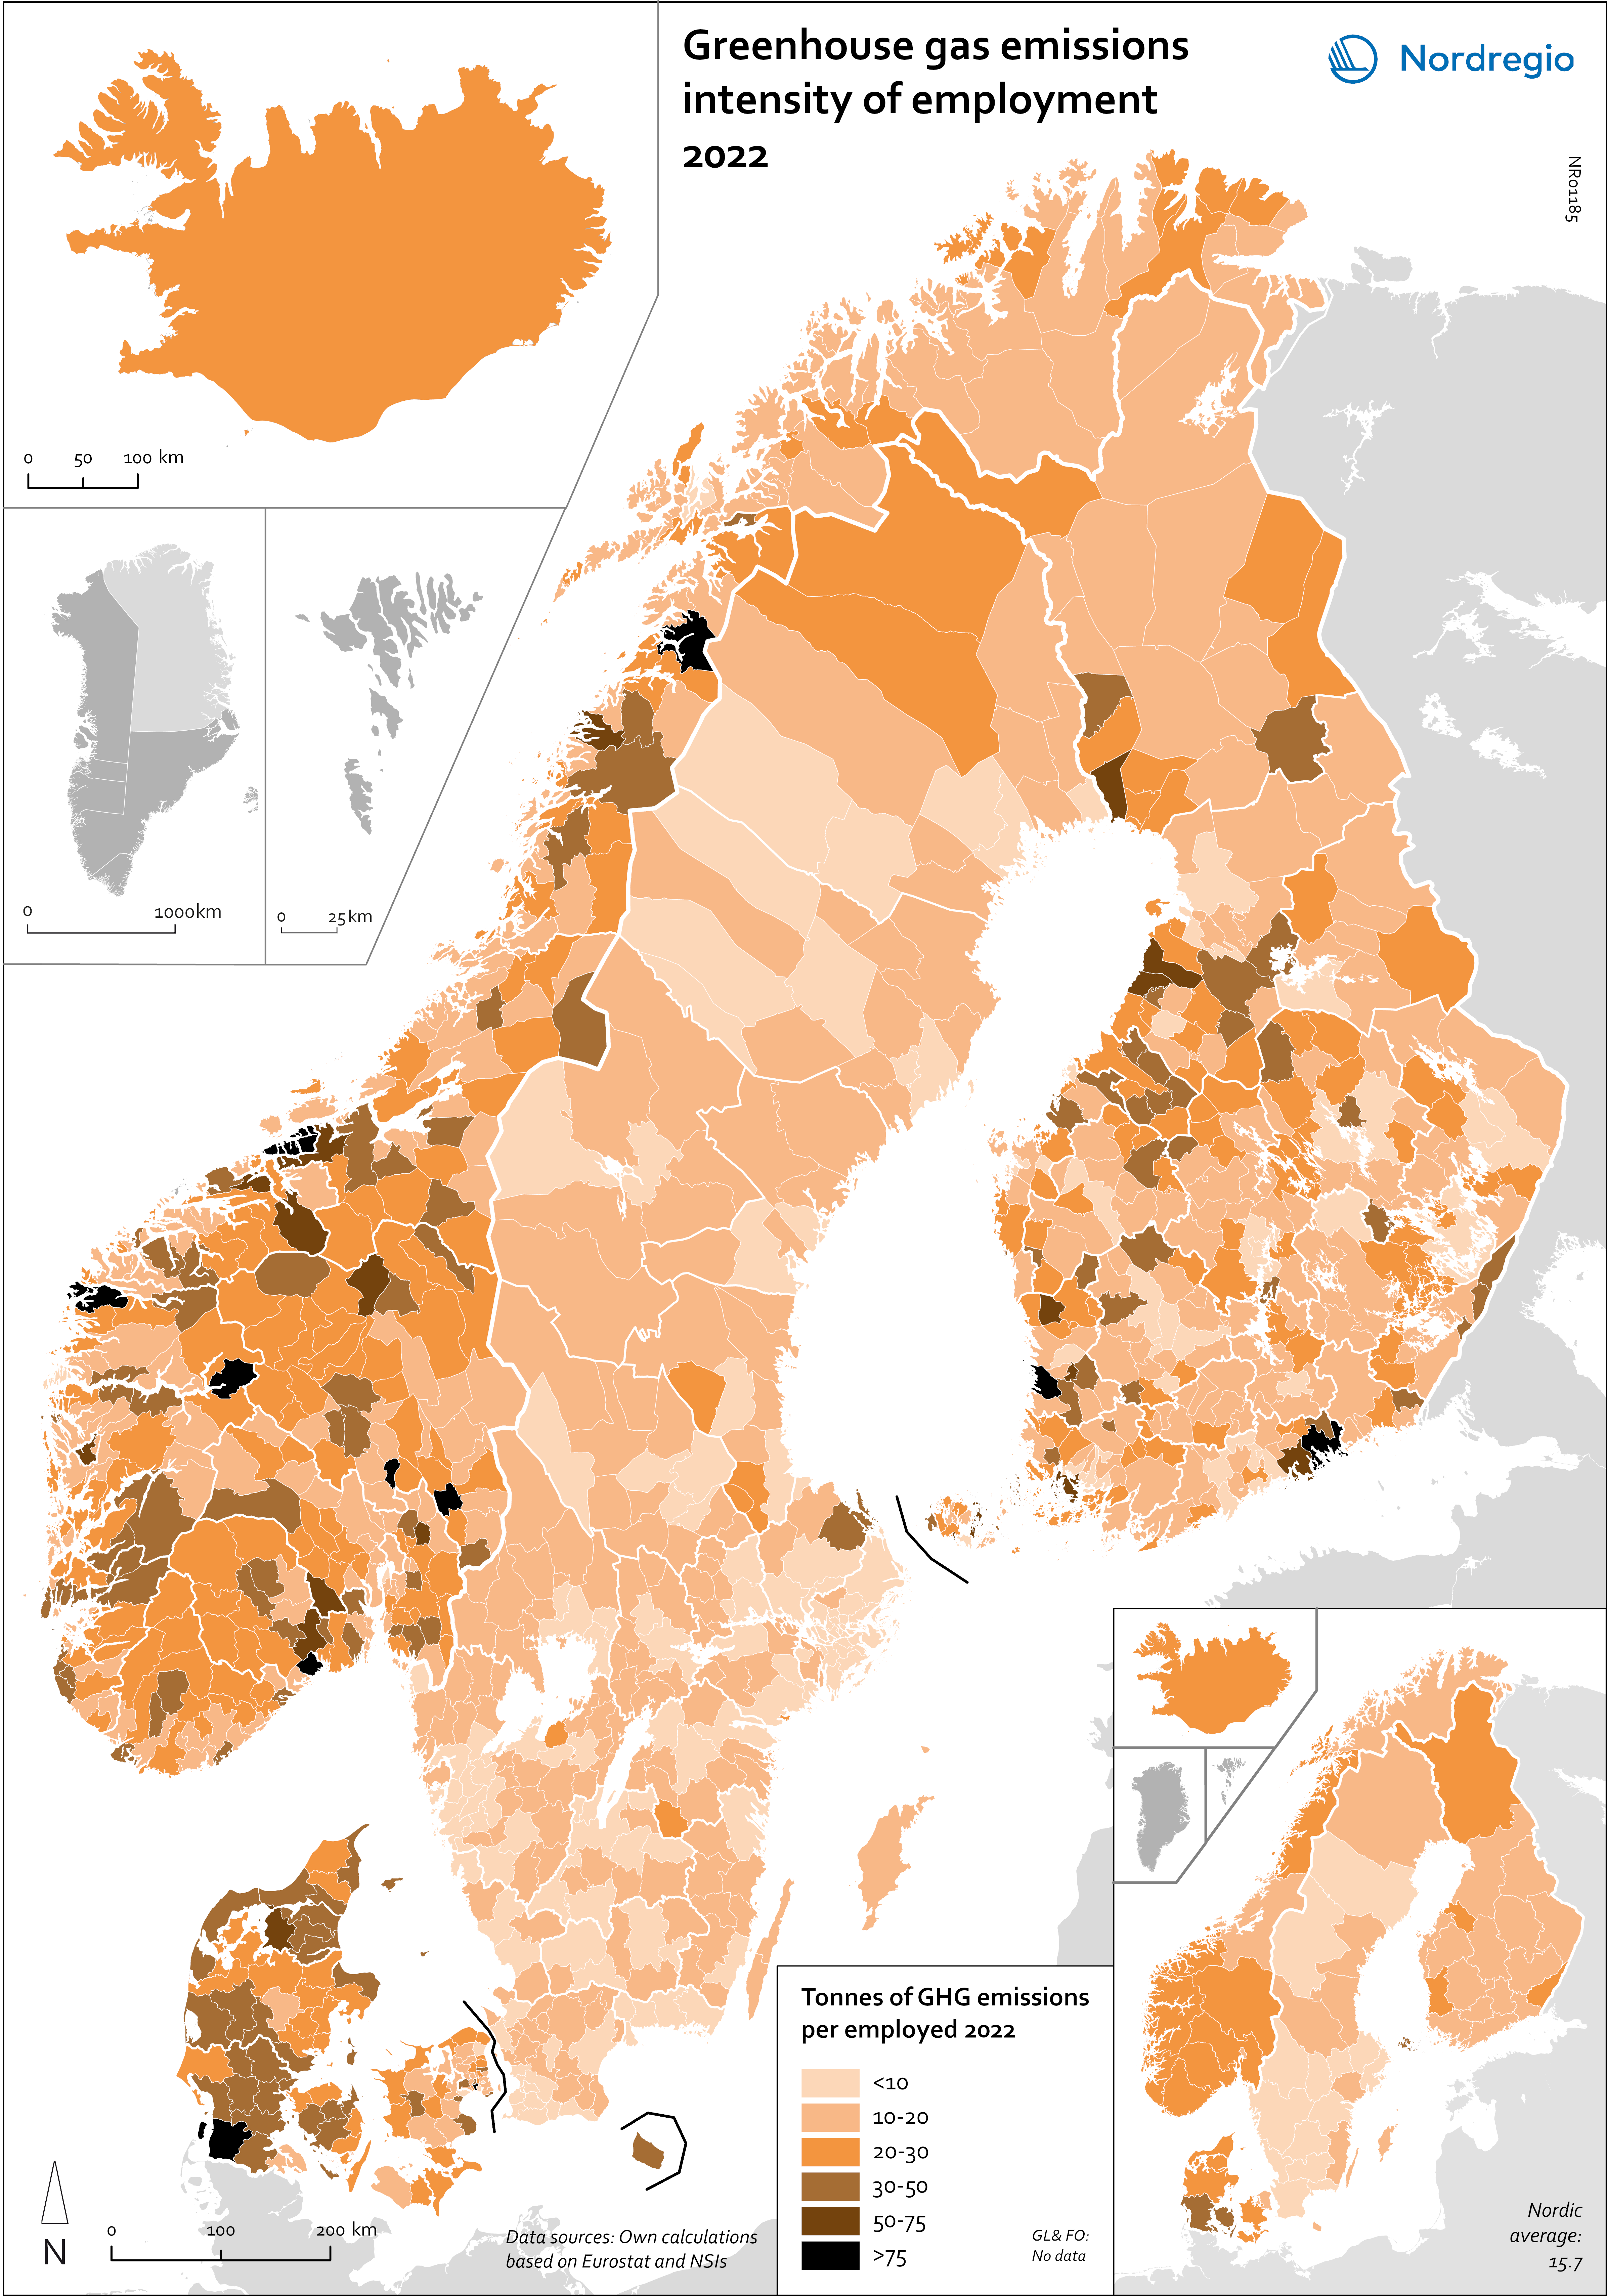
This map shows the tonnes of greenhouse gas emissions per person employed in Nordic municipalities (big map) and regions (small map) in 2022. The data for Iceland is presented at the national level, while no data was available for the Faroe Islands and Greenland. The map is based on data on emissions per sector and country from Eurostat and detailed employment by sector data from the Nordic statistical offices. By calculating the average emissions per person employed and per sector we could use municipal employment by sector data to assess the average emissions per person employed in each municipality. The results are an estimation based on the assumption that all jobs in the same sector have the same GHG emissions. In 2022, greenhouse gas (GHG) emissions per person employed in the Nordic Region were 15.7 tonnes. This is higher than the EU average of 13.5 tonnes. There are also fairly big differences between the Nordic countries, with higher emissions per person employed in Iceland (28.6), Denmark (23.1) and Norway (20.5) and lower emissions in Finland (15.7) and Sweden (8). On the other hand, the emissions per person employed have decreased faster in the Nordic Region than for the EU as a whole. In the last decade, emissions per person employed fell by 24% in the Nordic Region compared to the EU average of 22%. The biggest decrease (32%) was in Finland. The sectors with the highest emissions per worker vary slightly between the countries. In Sweden and Norway, the sector with by far the highest emissions per worker was the manufacture of petroleum coke and refined petroleum products. However, it should be noted that the number of workers in this sector is small. In Denmark, the highest emissions by person employed could be found in water transport; in Finland, in…
- 2025 April
- Environment
- Labour force
- Nordic Region

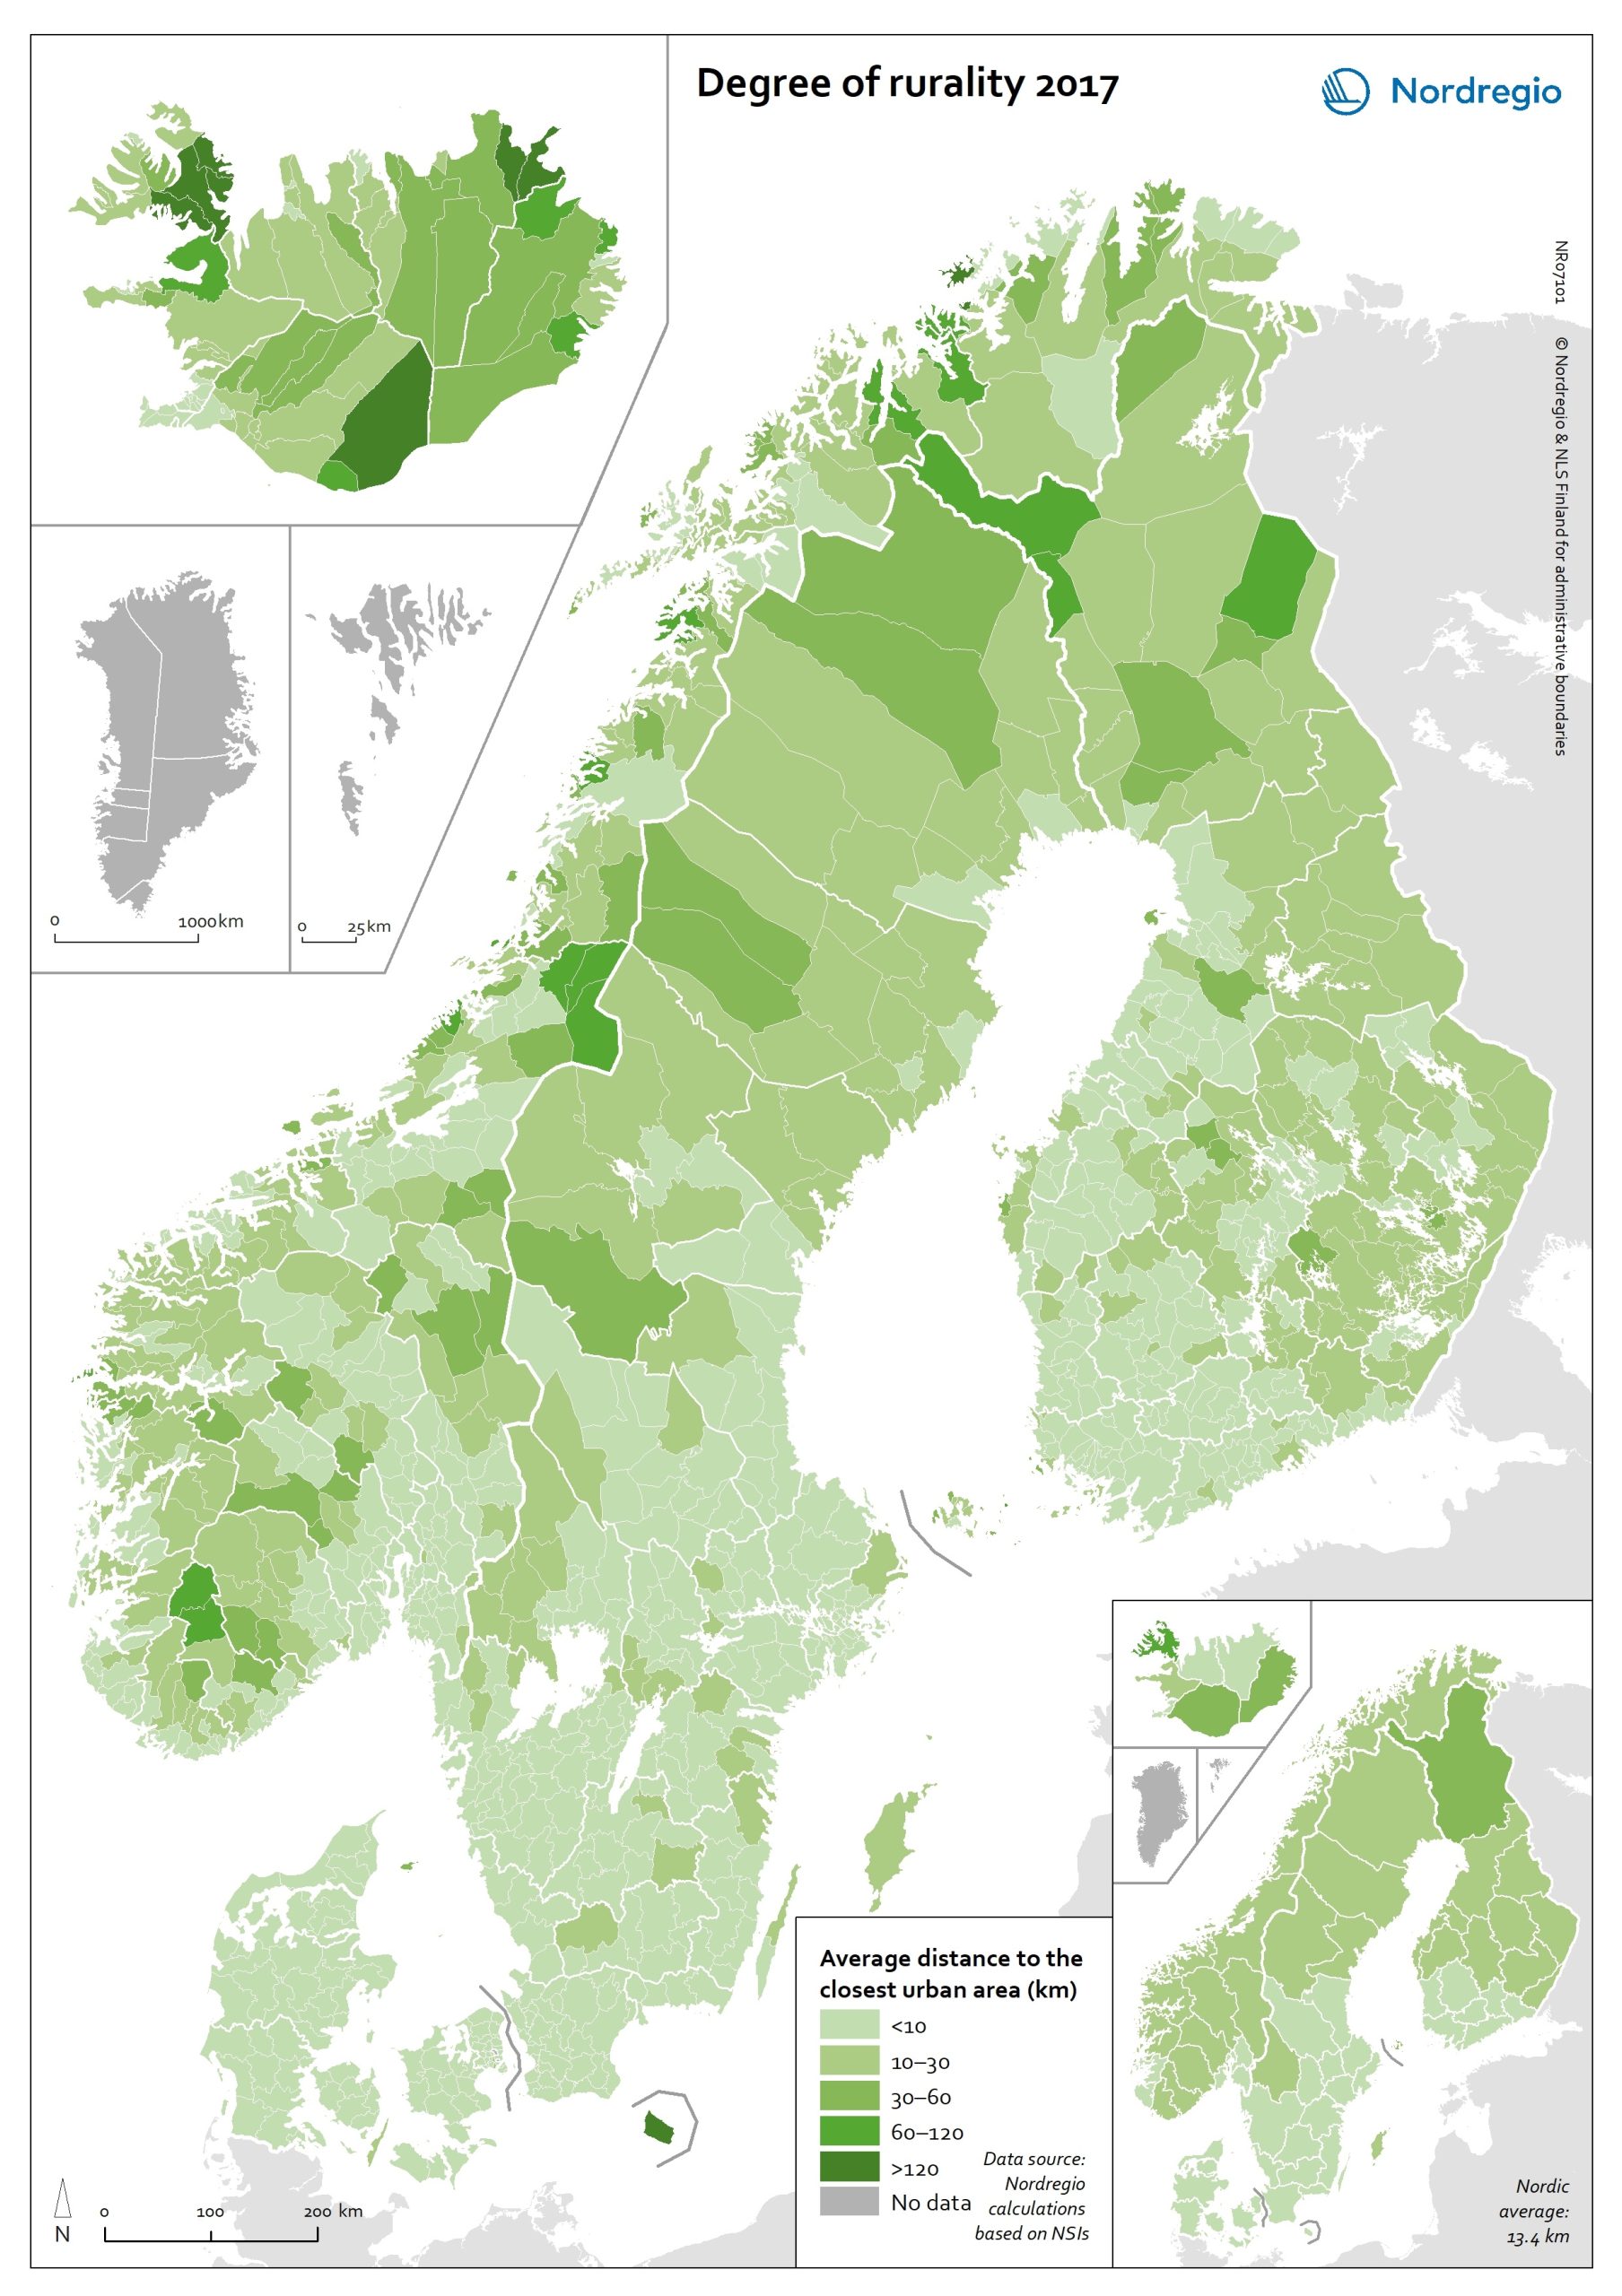
Degree of rurality at the municipal and regional level in 2017
This map shows the average distance to the edge of the closest urban area for the population living outside urban areas in the Nordic municipalities and regions. These figures are of particular interest in the analysis of urban-rural patterns and the Nordic populations’ access to local services in sparsely population areas. The darker shades on the map indicate longer average distances to the edge of the nearest urban area, and the lighter shades indicate shorter average distances. While almost all Danish municipalities have an average distance of below 10 km from rural grid cells to the nearest urban area, a large share of the municipal populations of the remaining Nordic countries need to contend with longer average distances to local services. The largest distances can be found in several municipalities of Iceland and Norway (Árneshreppur 230 km, Hasvik 154 km), whereas the largest average distances for Finnish and Swedish municipalities are considerably shorter (Enontekiö 103 km, Storuman 52 km). Regarding within-country variation, shorter average distances can generally be found in southwestern Finland and southern Sweden, in comparison with the more remote parts of these countries. Both Norway and Iceland provide a rather more mixed picture, since there are municipalities with shorter average distances scattered across different parts of each country. Method used to calculate the degree of rurality In order to take into account access to services such as grocery stores, pharmacies, schools, community centres and public transport, the European definition of urban grid cells was used to create this map, i.e. a population density threshold of 300 inhabitants per km2 applied to grid cells of 1 km2. The closest distance was calculated from each rural grid cell centroid to the nearest urban grid cell centroid along the existing road network traversable by car, including car ferries, based on population…
- 2020 October
- Environment
- Nordic Region
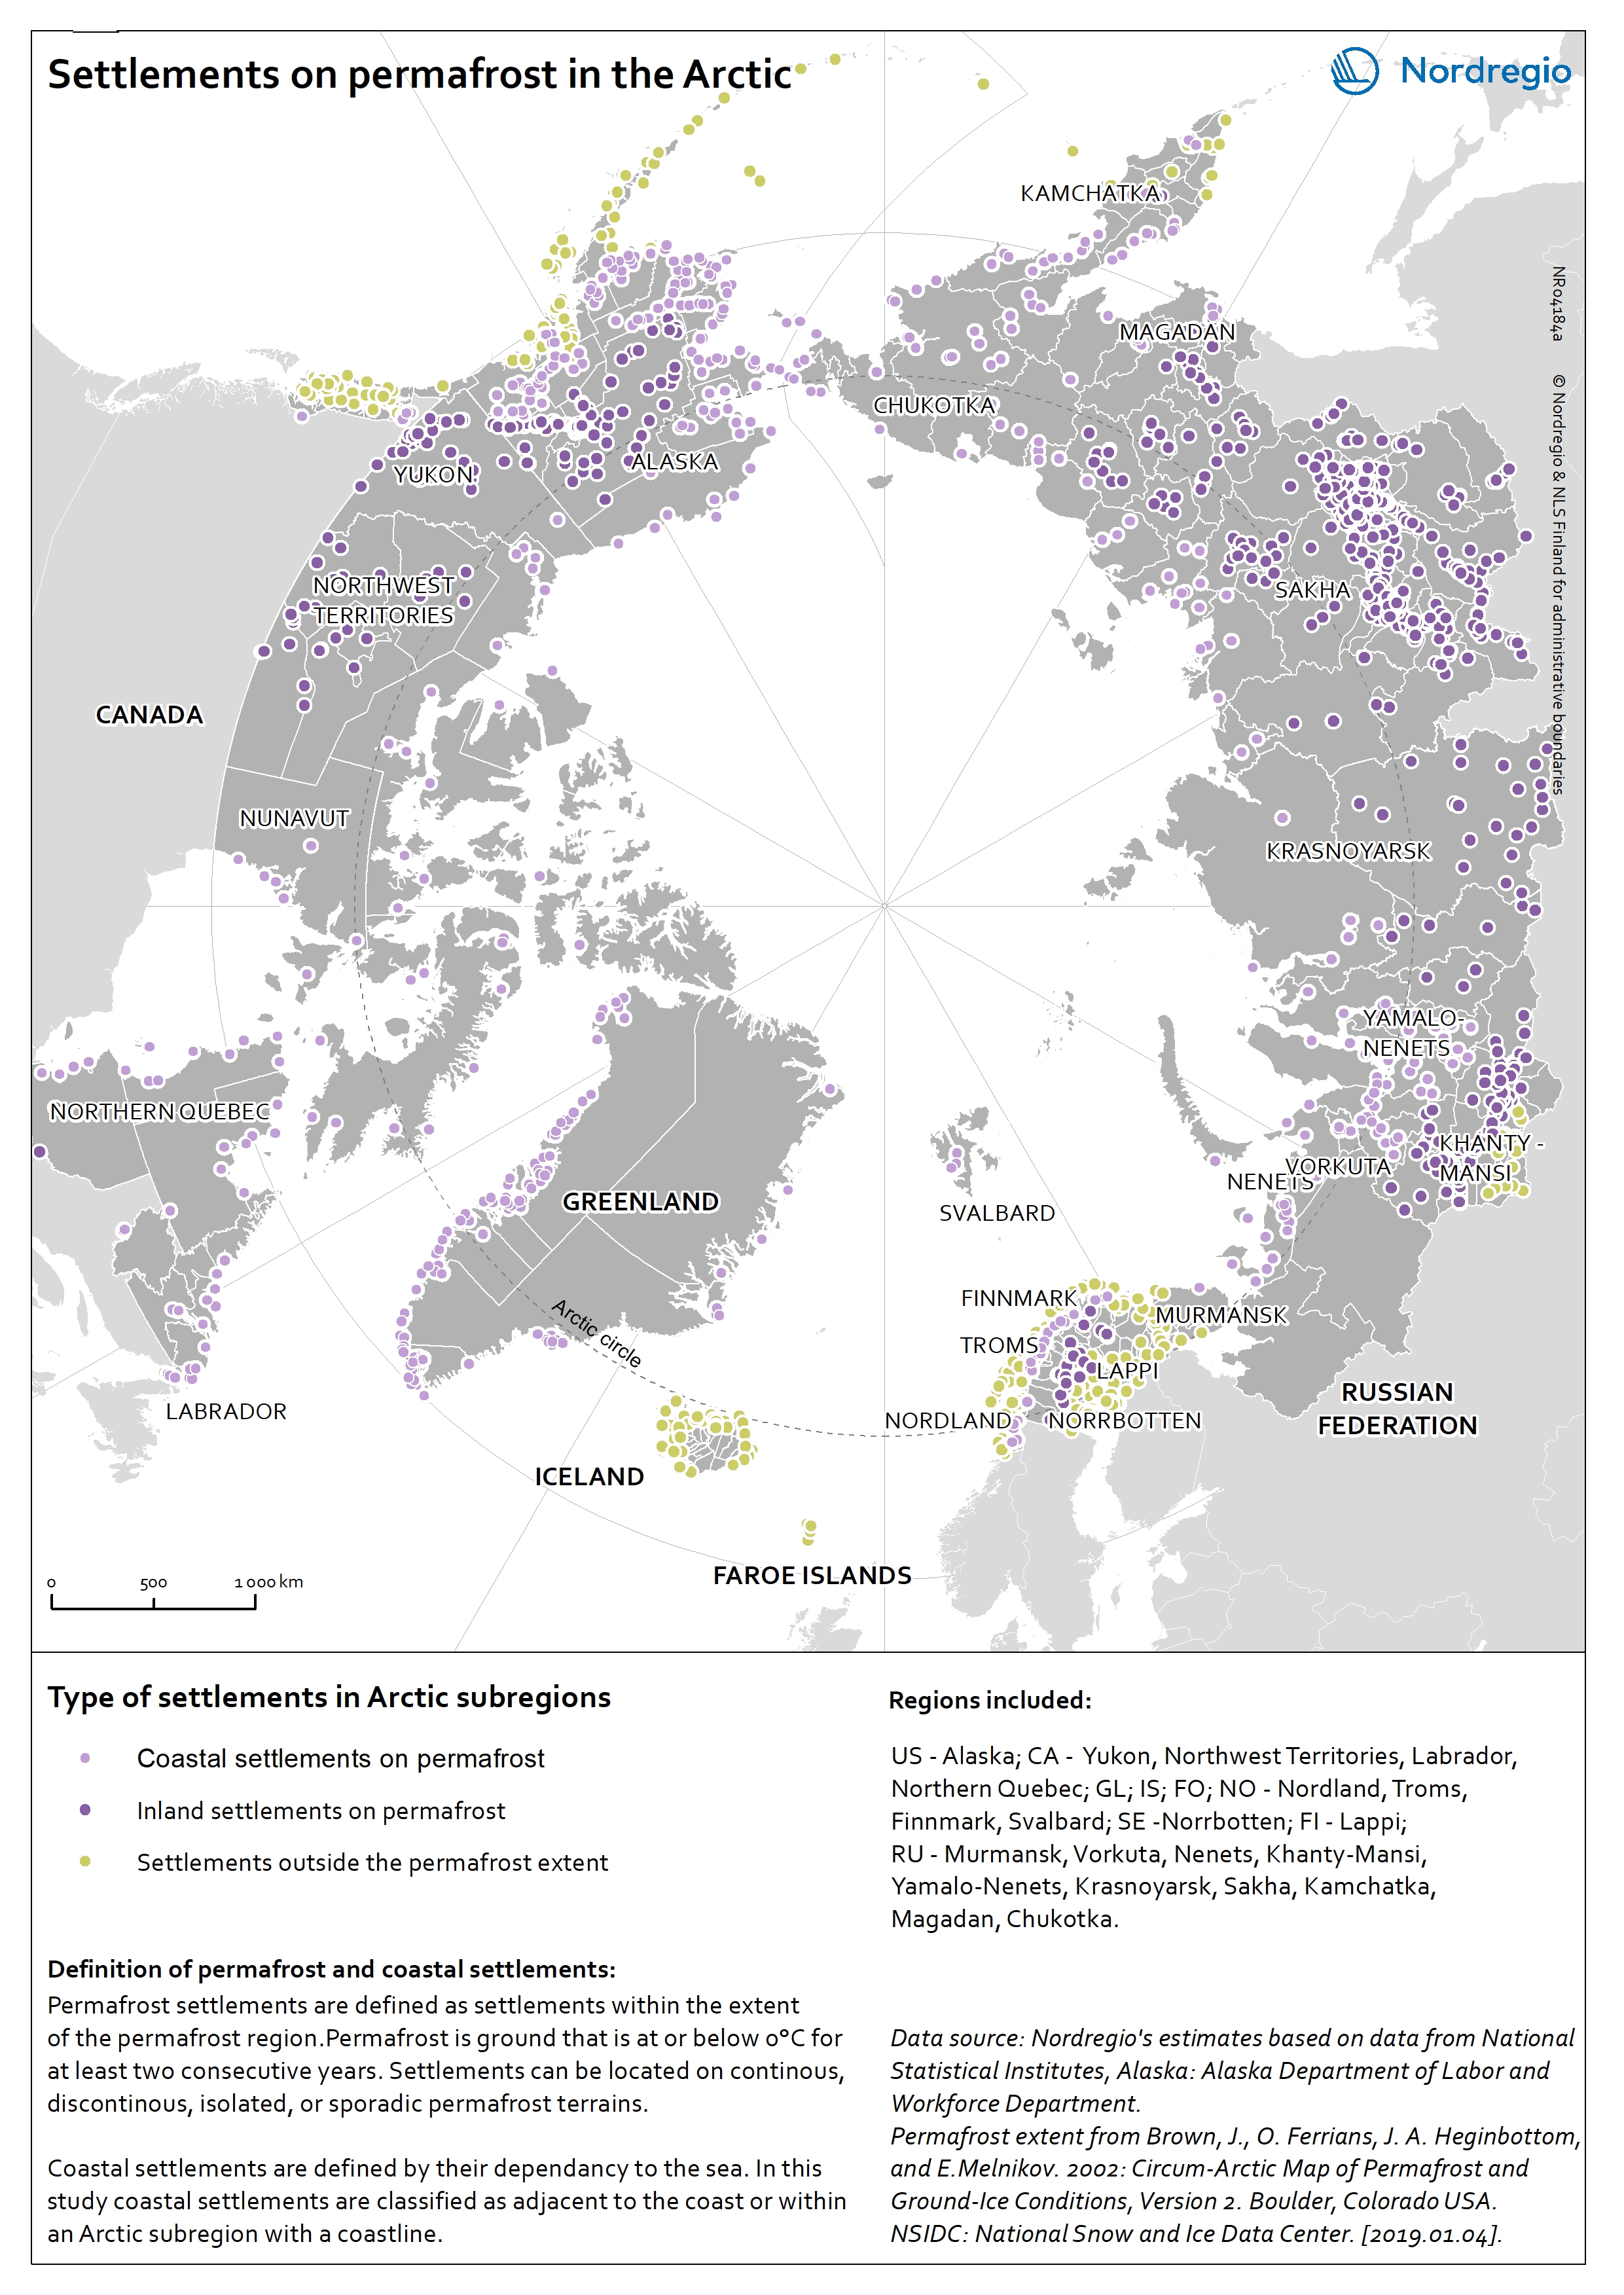
Settlements on permafrost in the Arctic
The map shows the distribution of coastal and inland settlements on permafrost in the Arctic in 2017. Permafrost is ground that is at or below 0°C for at least 2 consecutive years. The purple tones indicate settlements located on permafrost and distinguishes between coastal (light purple) and inland (dark purple) settlements. Settlements located outside the permafrost extent are in yellow. Among all Arctic settlements, 66,1% are located on permafrost. Settlements are classified as permafrost settlements if they are located within the permafrost extent, comprising zones of continuous, discontinuous, sporadic, or isolated permafrost. Among all permafrost settlements 46,0% are coastal. Coastal settlements are defined by their dependency to the sea. They are either adjacent to the coast, located inland along large rivers with a free connection to the open sea, or located within a short distance to the sea (0-200 km). In this map, coastal settlements comprise all settlements that are located within an Arctic subregion adjacent to the coast. Most of the settlements located outside the permafrost extent area are in the Nordic countries (Iceland, Norway, the Faroe Islands, Sweden, and Finland) as well as in the southern part of Alaska (USA) and the western part of the Russian Arctic. Almost all Arctic settlements in the Russian Federation and in Canada are located on permafrost. The increase in air surface temperature observed in the Arctic causes dramatic changes in the permafrost thermal regime leading to the destabilisation of infrastructure built on permafrost.
- 2019 March
- Arctic
- Demography
- Environment
Land Cover in the Arctic
The terrestrial ecosystem of the Arctic is characterized by low tundra vegetation, composed of shrubs, herbaceous plants, mosses, and lichens. Arctic vegetation is becoming more productive due to increasing air temperature. One of the main trends shows an increase in tall shrub cover. On the contrary, the cover of lichen and moss has declined in response to regional warming.
- 2019 January
- Arctic
- Environment
Components of the cryosphere in the Arctic
This map shows the main components of the cryosphere in the Arctic: sea-ice, permafrost, ice-sheets, and glaciers. Sea-ice covers most of the Arctic Ocean during winter. The sea-ice extent reaches its maximum in March, when it covers approximately 14-16 million km2. Since 1979, the Arctic ice extent in winter has decreased by 3% per decade relative to the 1981-2010 average, and this trend accelerates. Similarly, ice-sheets and glaciers, which cover globally over 15 million km2 are melting. In the Arctic, the main ice-sheet is the Greenlandic ice sheet. Most of the land surface in the Arctic is underlay by permafrost, ground that is at or below 0°C for at least 2 consecutive years. The purple tones on the map indicates the extent of the northern circumpolar permafrost. Permafrost can occur as continuous (dark purple, 90-100% coverage), discontinuous (purple, 50-90% coverage), sporadic (light purple, 10-50%), or isolated patches (magenta, 0-10% coverage). Permafrost is thawing due to increased air temperatures and precipitations in the Arctic. Permafrost temperature increased by 0.29 ± 0.12°C between 2007 and 2016.
- 2019 January
- Arctic
- Environment
Protected areas in the Arctic
Within the northern circumpolar permafrost region, there are ca. 1300 protected areas. Most of these areas are terrestrial (1069), while 126 are coastal – defined as partially within the marine environment – and 62 are marine. The World Database on Protected Areas (WDPA)[1] includes a wide range of protected areas, including national protected areas recognized by the government, areas designated under regional and international conventions, privately protected areas and indigenous peoples’ and community conserved territories and areas. Greenland is one of the countries with the largest protected terrestrial area (41,0%). [1] IUCN and UNEP-WCMC (2019), The World Database on Protected Areas (WDPA) [On-line], [January 2019]. Cambridge, UK: UNEP-WCMC. Available at: www.protectedplanet.net.
- 2019 January
- Arctic
- Environment
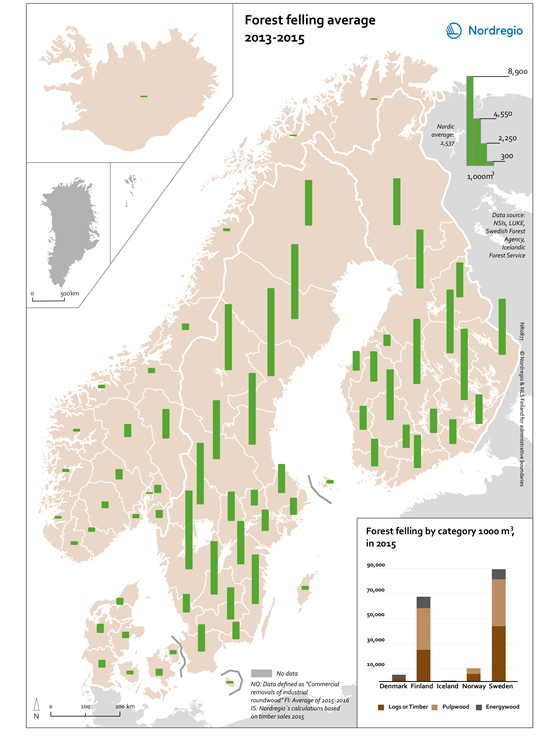
Forest felling average 2013-2015
This map shows the forest felling at the regional level in the Nordic Region (average 2013-2015). The chart shows the forest felling by category in 1,000 m3 at the national level in the Nordic Region in 2015. On the map, the green bars indicate the average 2013-2015 forest felling. The higher the bar, the greater the forest felling in the region. The grey colour indicates regions with no data. The chart shows different forest felling categories in 1,000 m3 in 2015. The dark brown represents logs or timber, the light brown represents pulpwood, and the dark grey the energywood. The Nordic Region has a large potential for forest multi-use. Sweden and Finland have the largest forest felling in 1,000 m3, with the greatest use in logs and timber. Wood bi-products is extensively used for energy purposes and the forests display a large potential for increasing the production of renewable energy as well as other bio-based products.
- 2018 February
- Environment
- Nordic Region
- Others
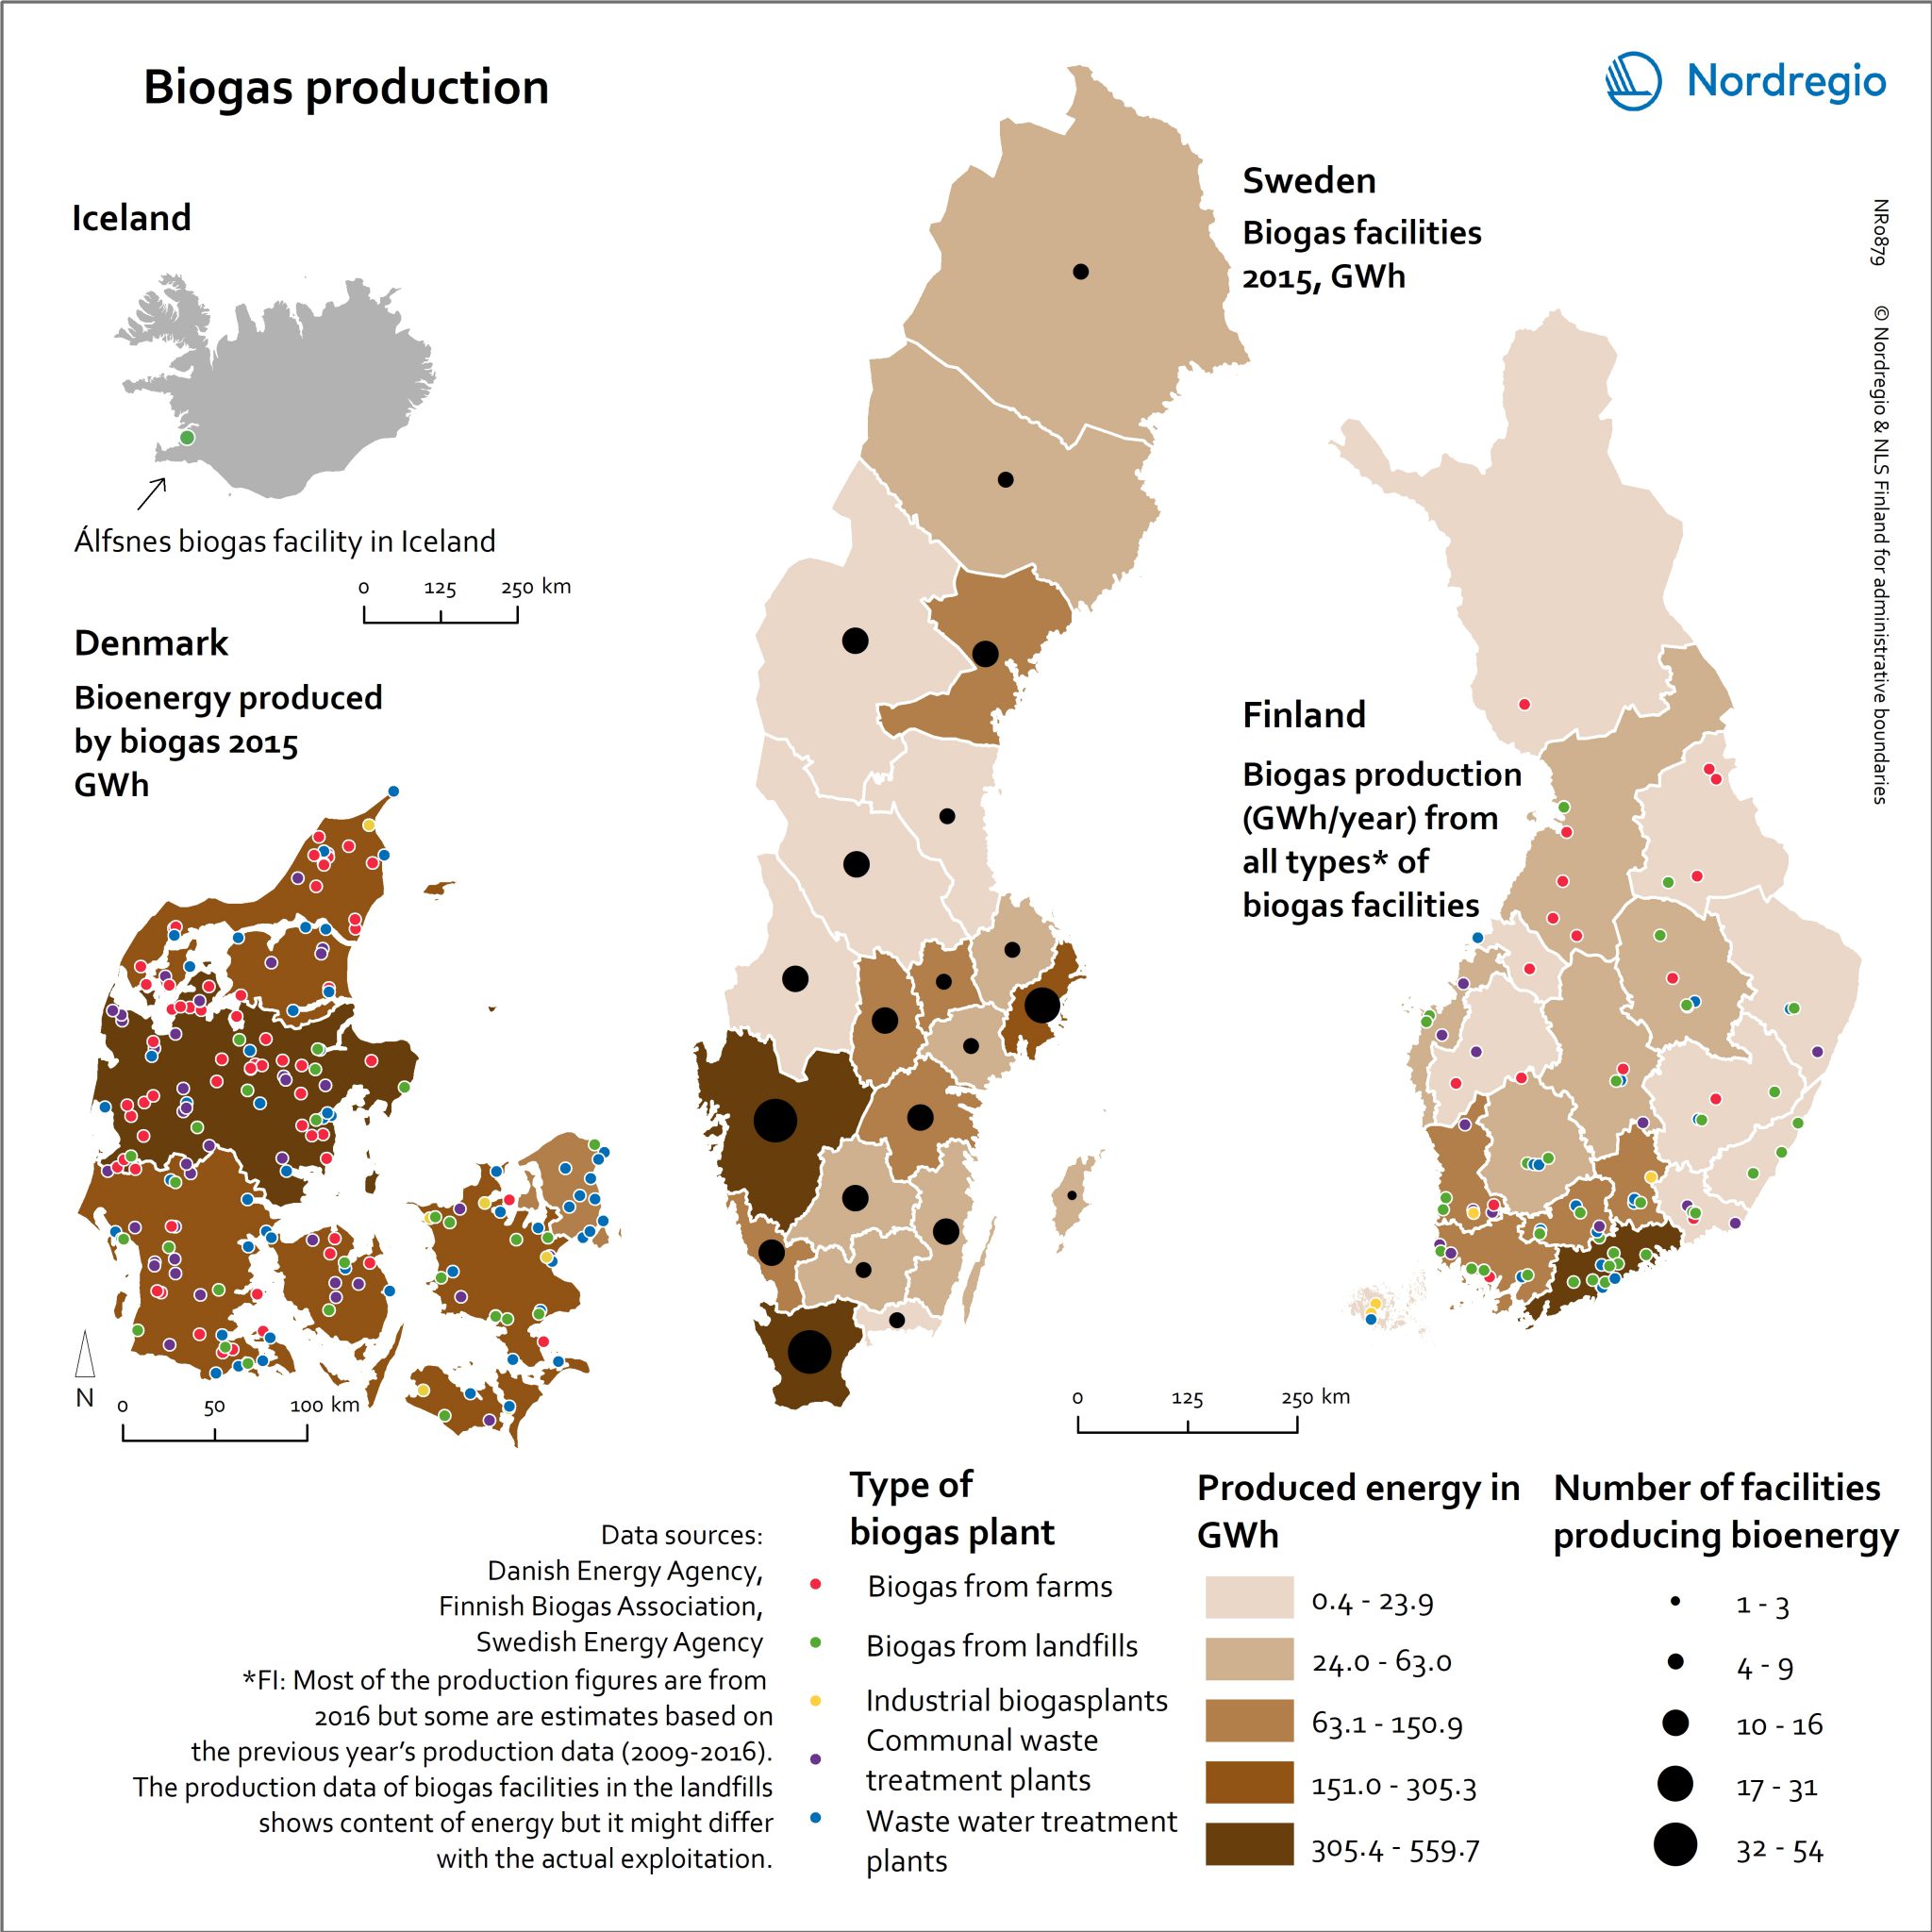
Biogas production
These maps show the energy produced by biogas (in GWh) as well as the number of facilities producing bioenergy in the Swedish regions. The maps also show the location and type of biogas plants in Denmark, Finland, and Iceland. The brown shading indicates the produced energy in GWh in each region. The darker the brown, the larger the energy produced. The black circles are proportional to the number of facilities producing bioenergy in the Swedish region. The location of biogas plants in Denmark, Finland, and Iceland is indicated by coloured circles. The colours indicate the type of biogas plant. Biogas production is widely distributed across the Nordic Region and between the types of sources used. In 2015, 18% of the energy use in Denmark came from biomass and waste. In the western part of Denmark, biogas is mainly based on manure from farms supplemented with sludge and organic waste from wastewater plants. The vast infrastructure for gas makes it easy and accessible for farmers to link biogas to the existing energy net. The largest numbers of plants in Finland are based on farms and landfills. In 2015 in Sweden, 282 facilities produced 1947 GWh biogas with the largest regional production being in Skåne (417.5 GWh), Västra Götaland (350.9), and Stockholm (255.8). Iceland had a biogas facility in Reykjavík at Álfsnes landfill with plans for expansion in 2018.
- 2018 February
- Environment
- Nordic Region
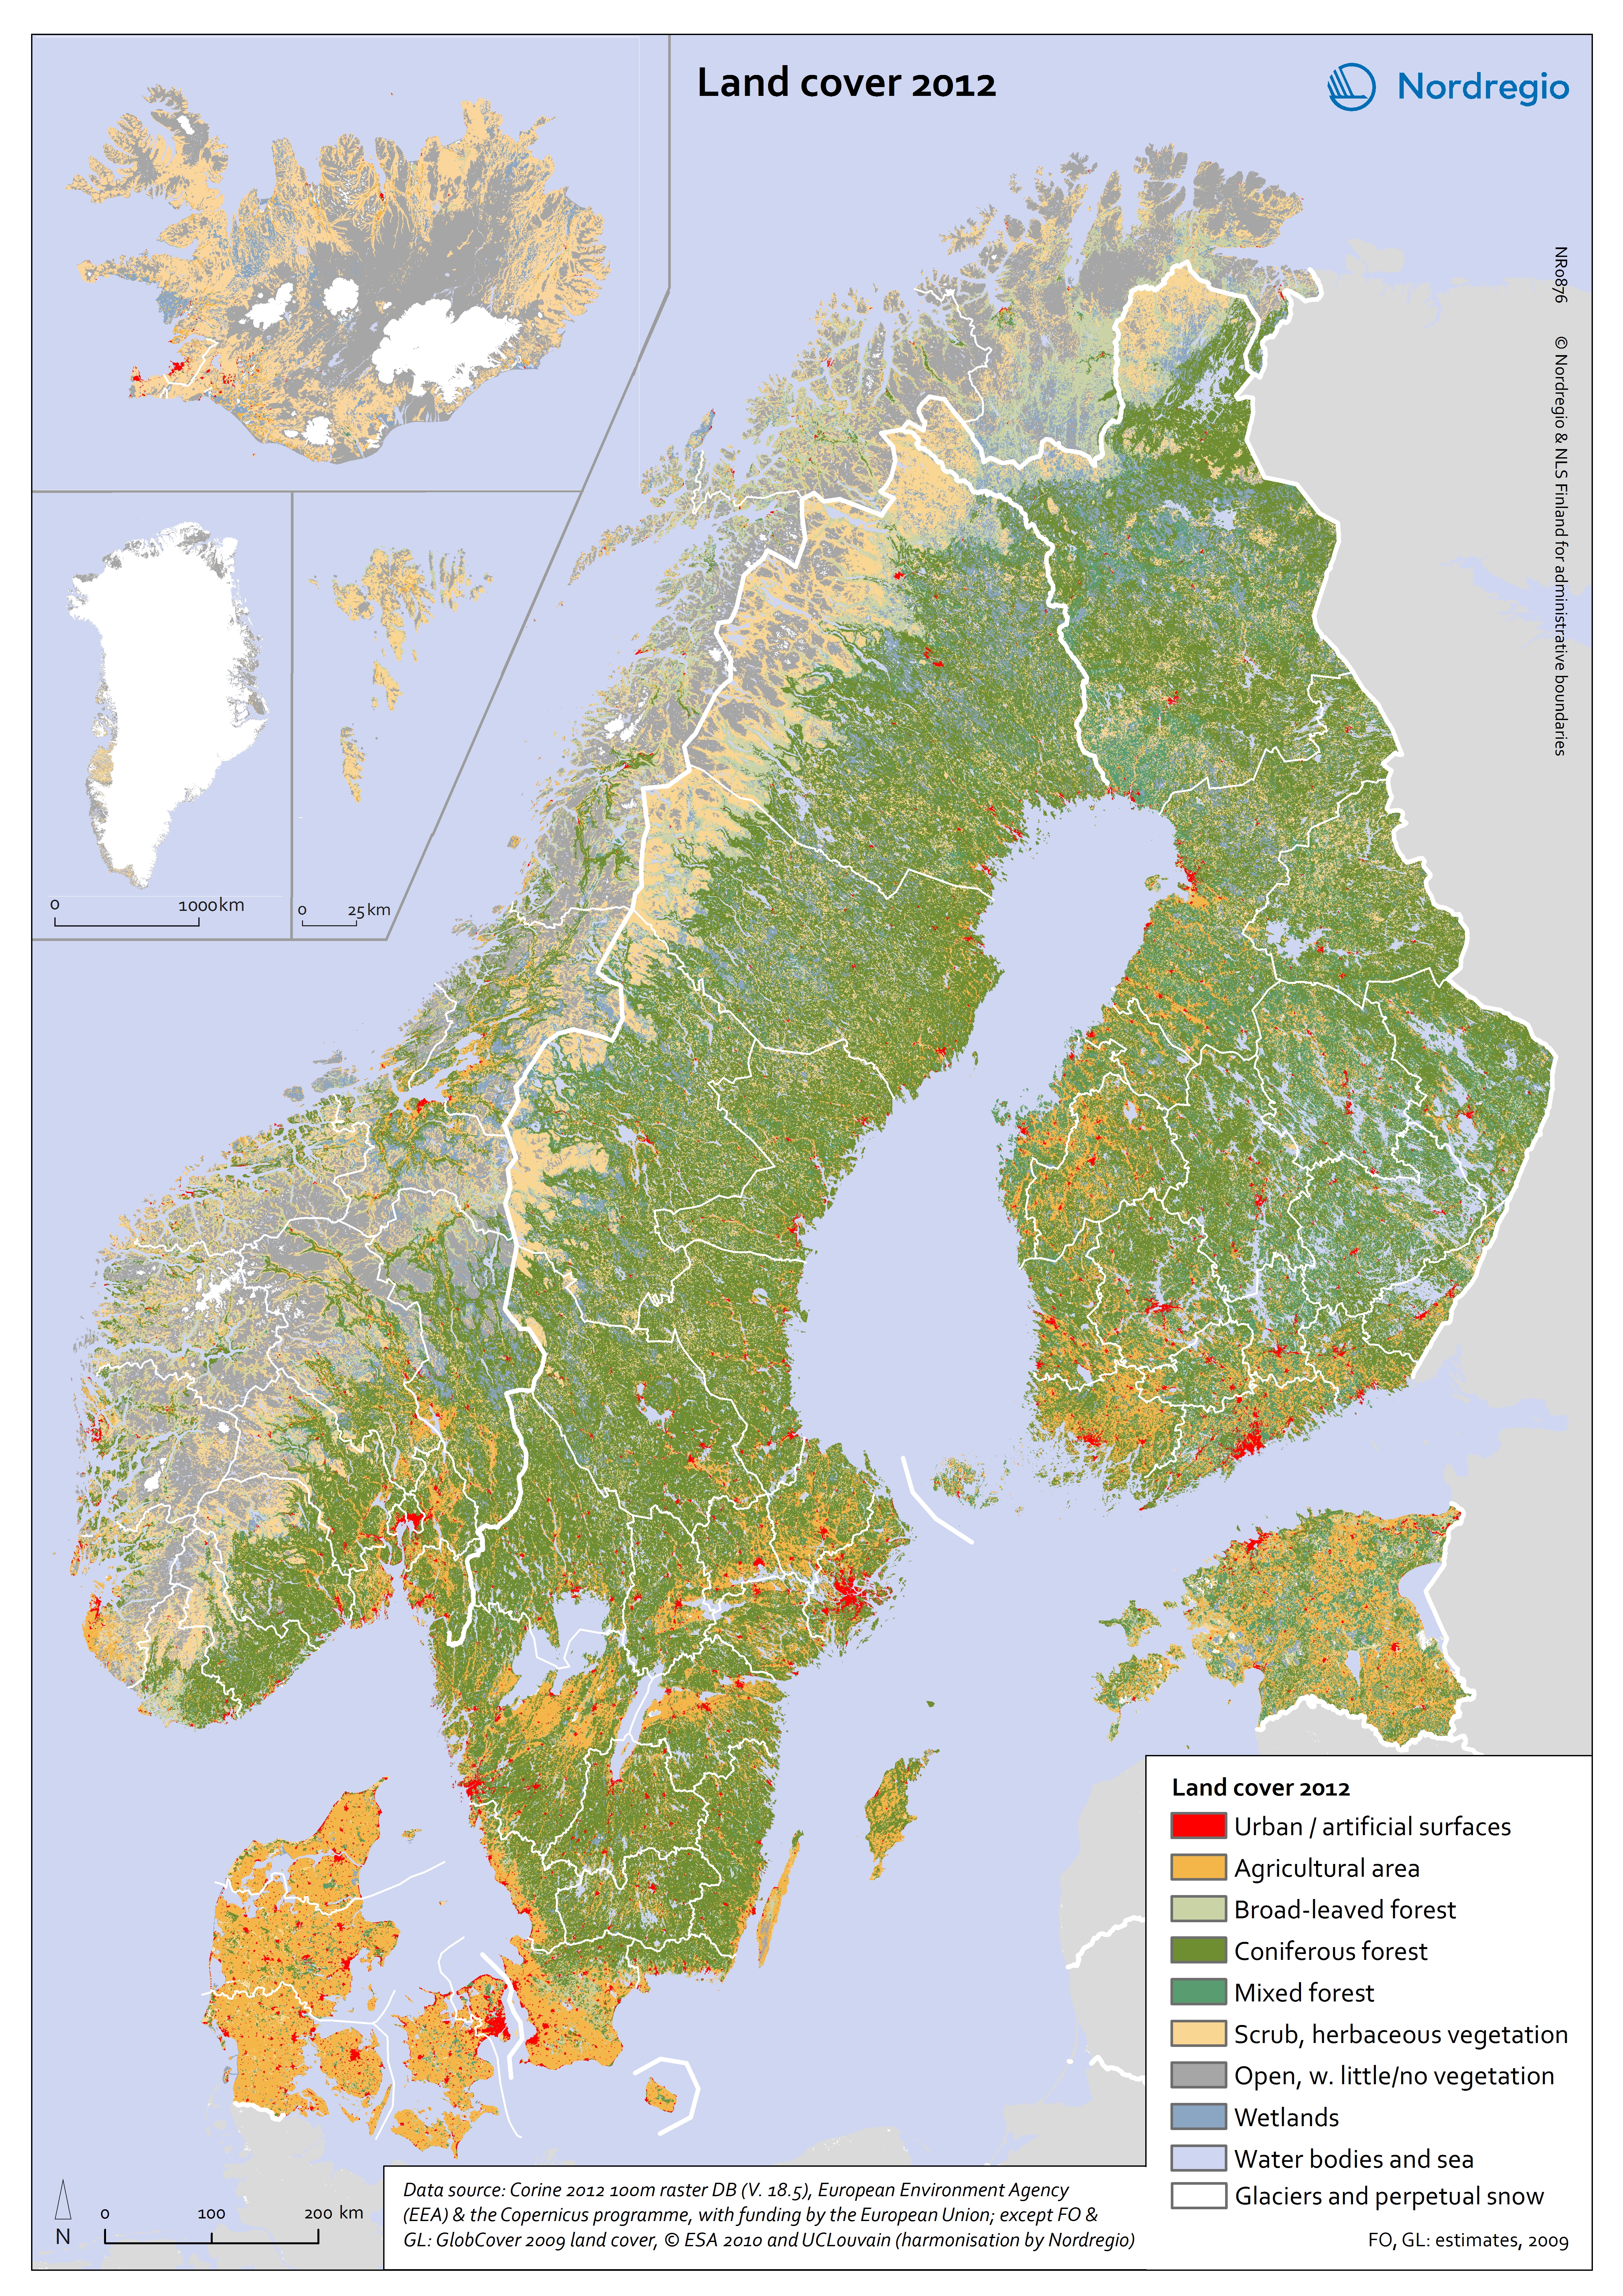
Land cover 2012
This map shows the land cover in the Nordic Region in 2012. Land cover data indicates the physical land type, helping to understand the current landscape of an area. The different colours represent land cover types with urban/artificial surfaces in red, agricultural areas in orange, forests in green, scrub and herbaceous vegetation in yellow, bare ground in grey, water bodies in blue and glaciers and perpetual snow in white. There are significant differences between the Nordic countries in terms of their land use. Denmark is largely agricultural (62%), while Finland (73%), a large part of Sweden (69%) and south-eastern Norway (28%) are all dominated by forest, mainly coniferous. Iceland and the Faroe Islands have large areas of scrub and herbaceous vegetation, suitable for grazing livestock. Open land with little vegetation is significant for many regions in Norway and Iceland. Vast parts of Greenland and parts of Iceland are glaciers. The Nordic countries all have long coastlines and easy access to marine resources. The map is a Corine 2012 raster DB (V. 18.5) at 100m resolution from the European Environmental Agency and the Copernicus program, with funding by the European Union. For Faeroe Islands and Greenland the data is from GlobCover 2009 land cover, ESA 2010 and UCLouvain (harmonization by Nordregio).
- 2018 February
- Environment
- Nordic Region
