55 Maps
EDYNORA Higher Education and VET Portal
The portal provides a visual and analytical overview of the diversity of campuses and independent institutions across the Nordic countries. It offers information on each campus’ or institution’s location, the fields of education offered, the number of students and the year of establishment. Data are presented across different institutional types, classified according to the highest level of education provided at a given campus or institution (in the case of single-campus institutions). The data for the portal were sourced primarily from institutional websites (e.g., “About Us” pages and annual reports), as well as statistical databases (the Vipunen database in Finland and the Database for Statistics on Higher Education (DBH) in Norway. The portal is intended for educational authorities, policymakers, and education providers seeking inspiration, collaboration opportunities, and insights into key figures and the distribution of education across the Nordic region.
 2025 June
 - Education
- Nordic Region
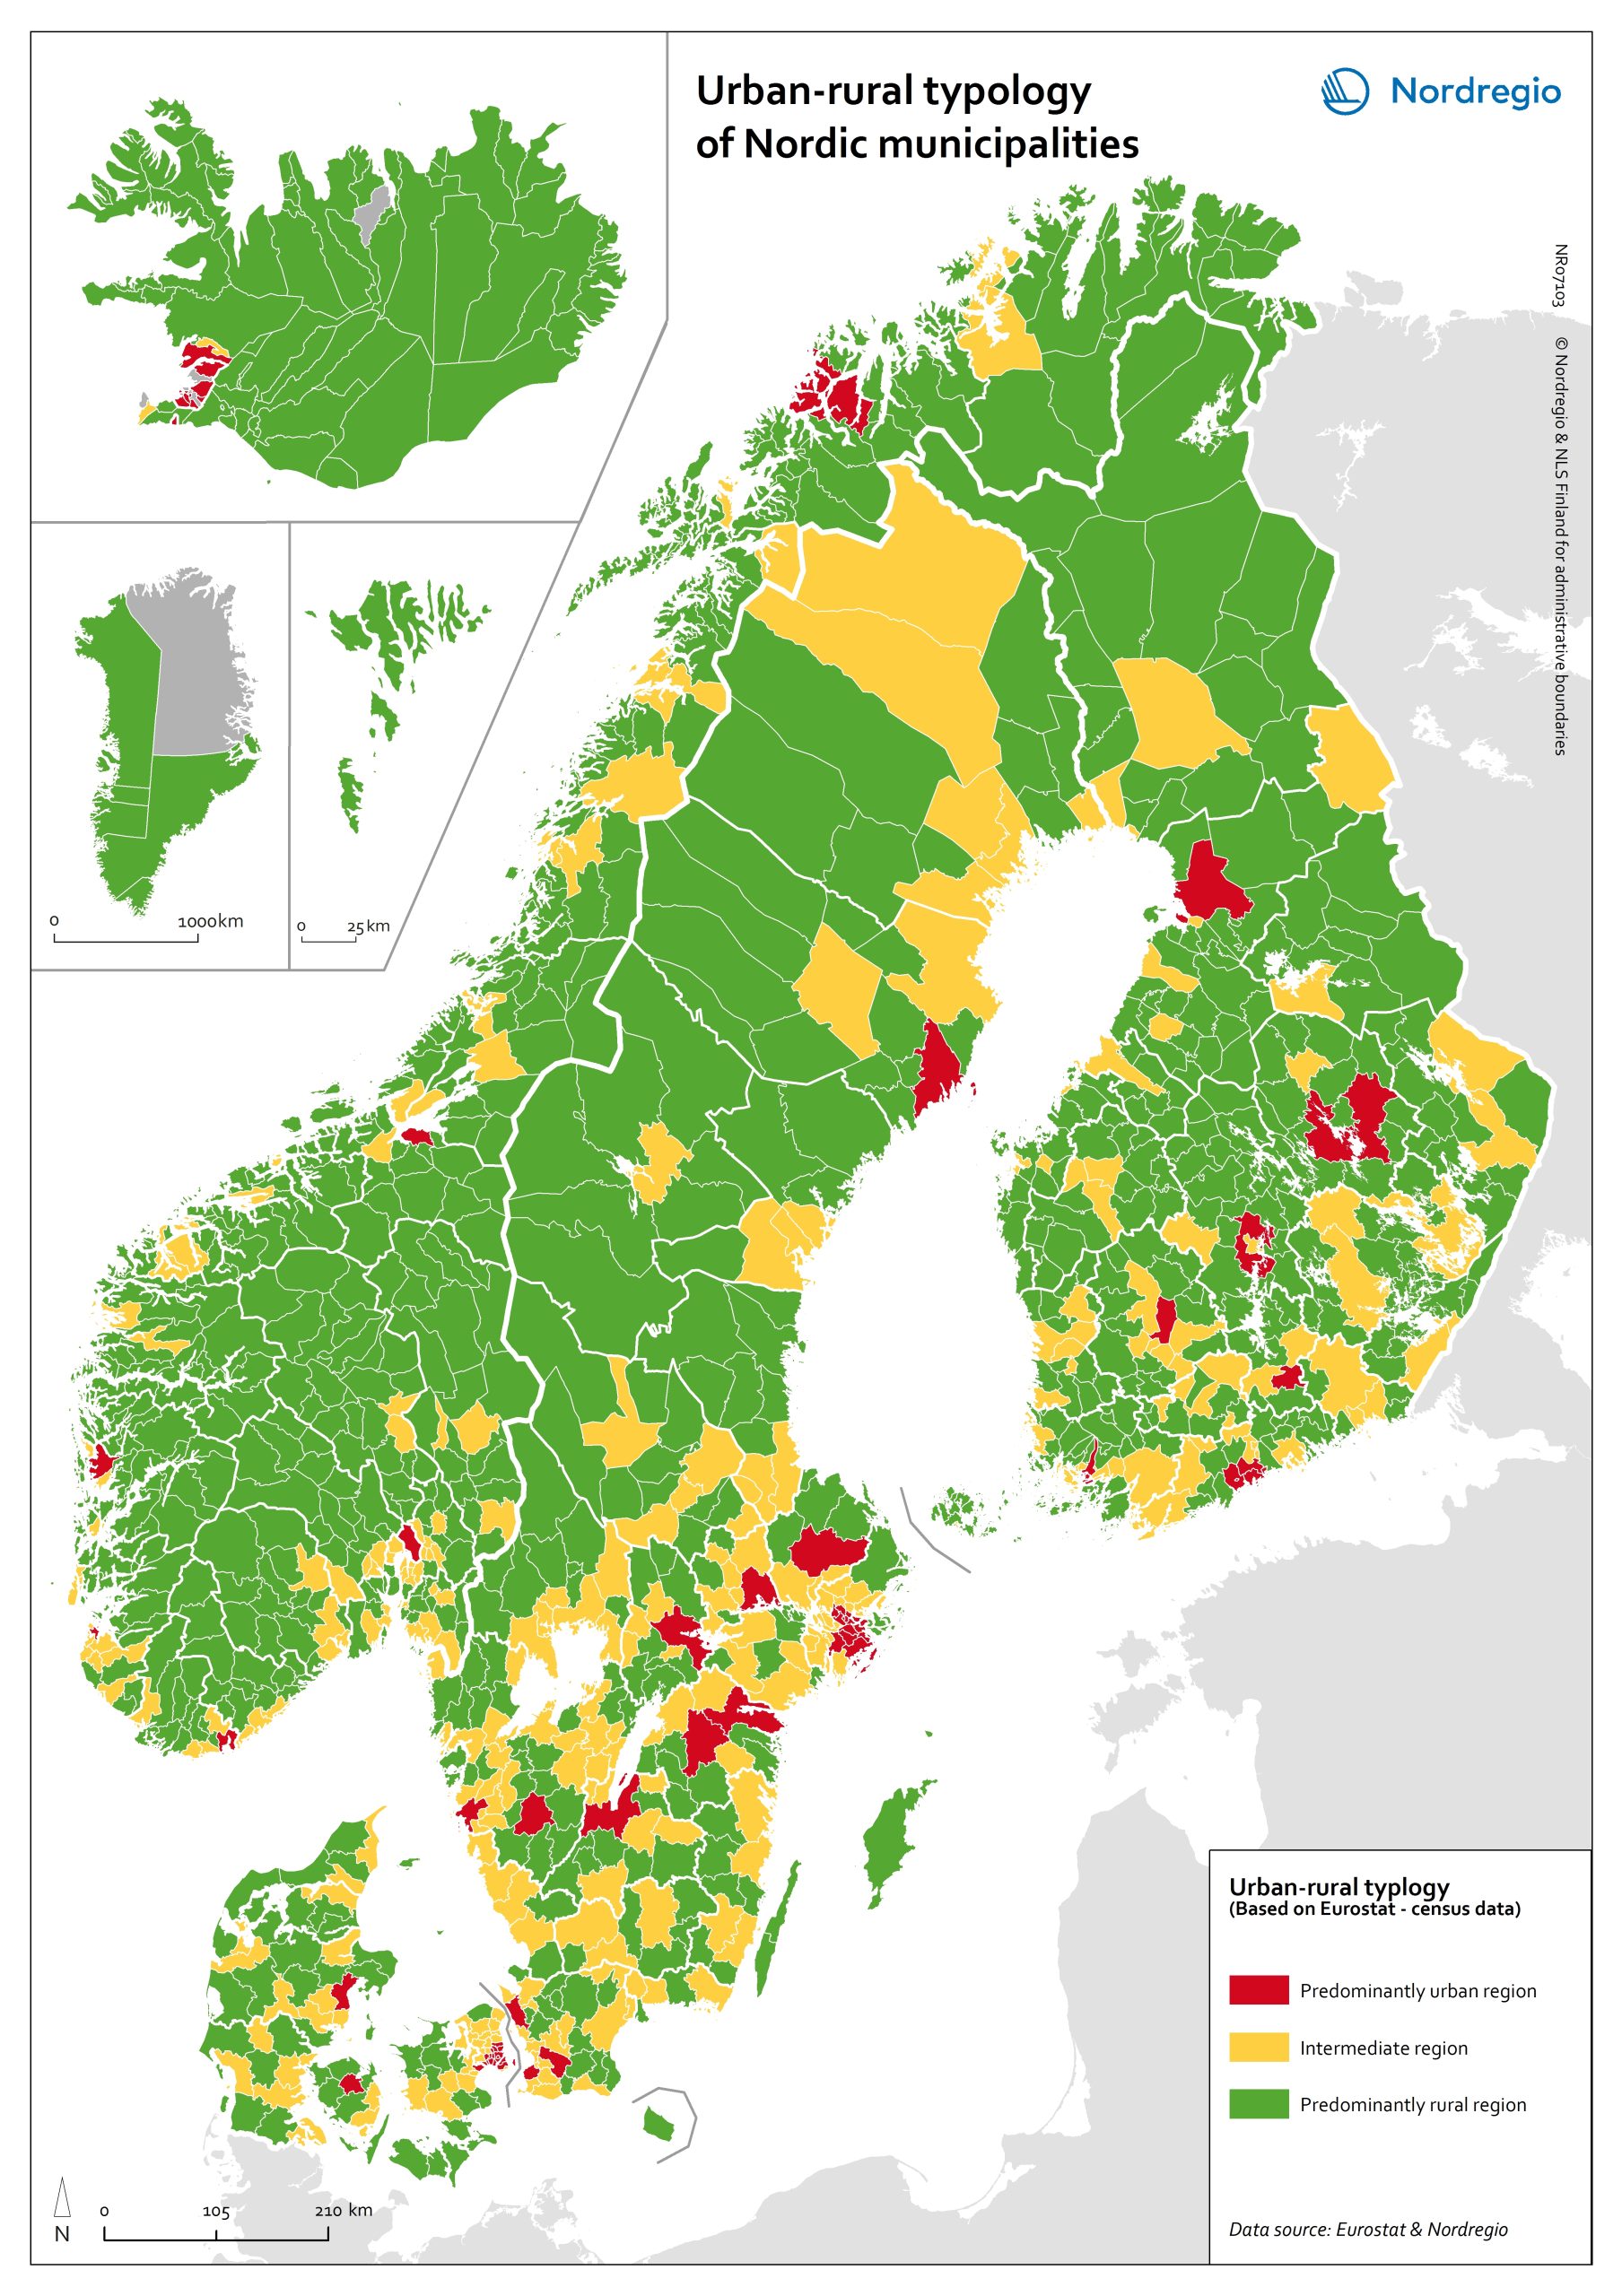


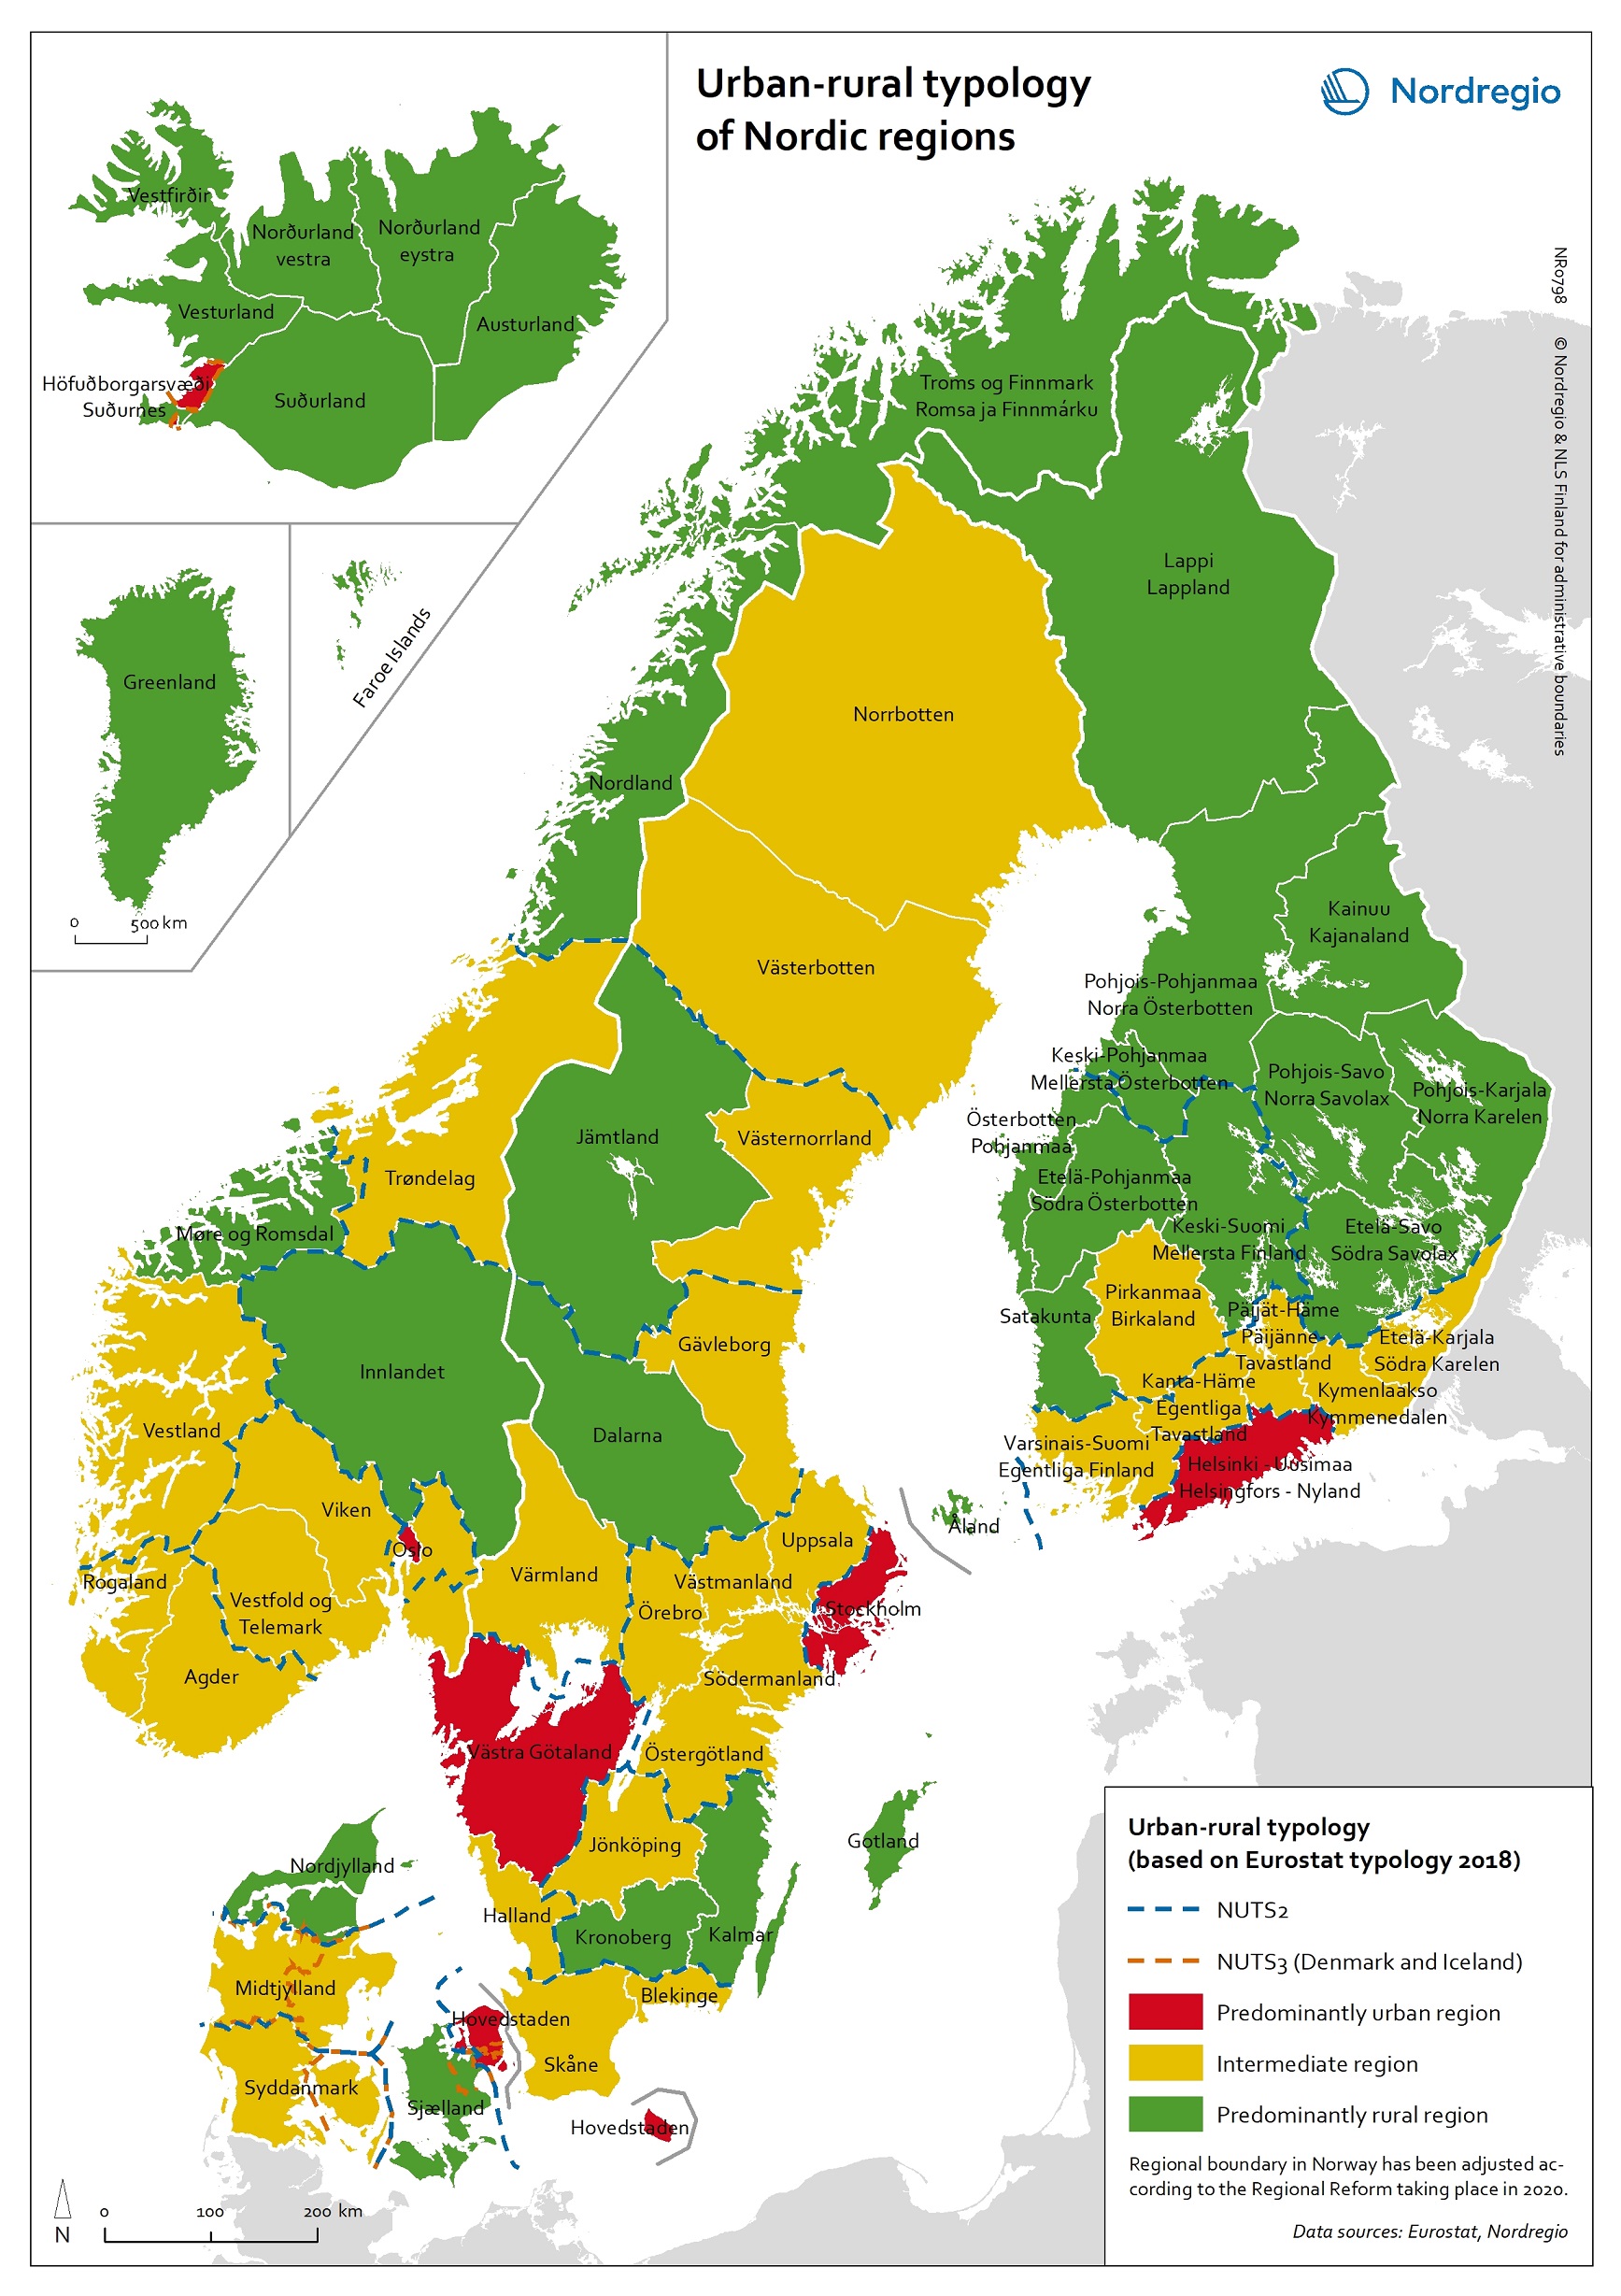
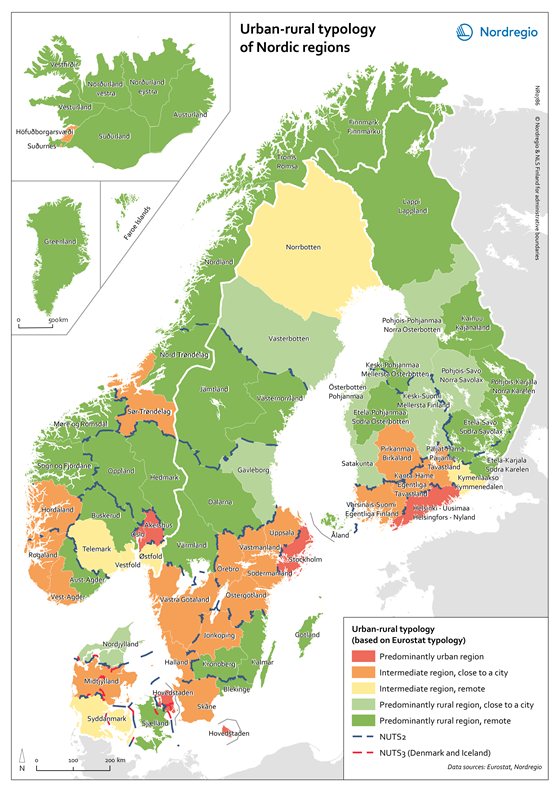
Urban-rural typology of the Nordic regions 2020
This map is included in the introduction of the State of the Nordic Region 2020 report. The map is based on the typology provided by Eurostat (2018), in which the 2016 NUTS 3 regions are classified in three categories according to their population density in 2011 and 2015, in 1 km² grids. In predominantly urban regions, at least 80% of the total population is urban, while in intermediate regions, 50–80% of the population lives in urban clusters. In regions that are predominantly rural, less than 50% of the population lives in urban areas. Read the digital publication here.
- 2020 February
- Administrative and functional divisions
- Demography
- Nordic Region

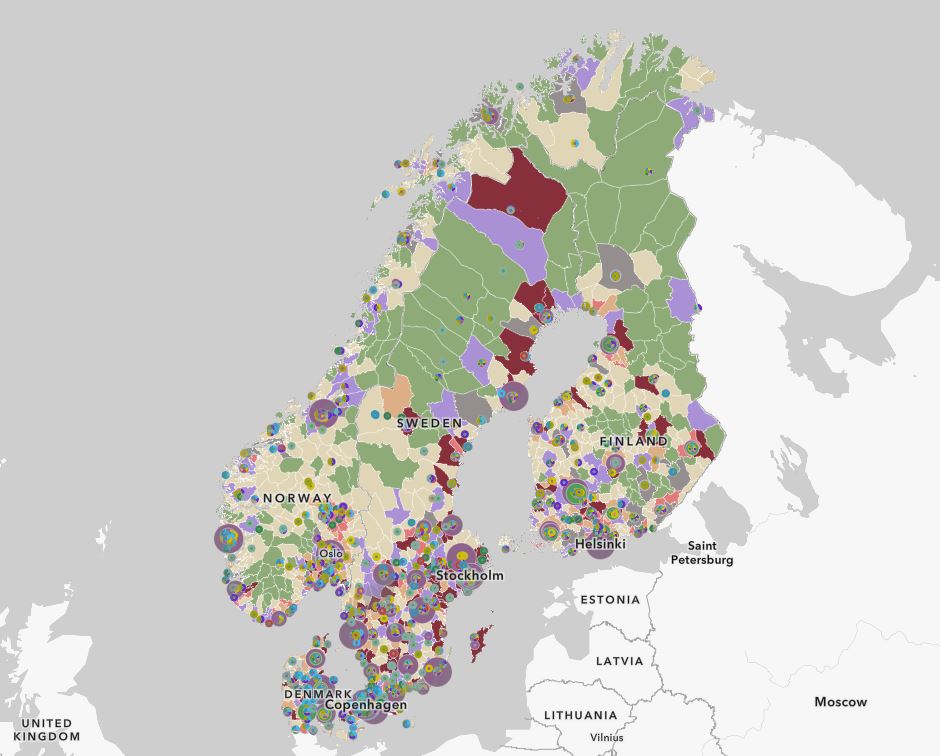
Municipalities by degree of urbanisation and functional urban areas
This map shows Nordic municipalities differentiated between their degree of urbanisation. The degree of urbanisation is the relationship between the population living in urban (and rural) areas and the total population of the municipality. The degree of urbanisation is a difficult concept to display but is useful as a way of adding nuance to the debate on urban-rural relations. The map also displays the functional urban areas in the Nordic Region. Cities with at least 50% of the population living in high-density clusters are highlighted in red. Towns and suburbs with less than 50% of the population living in high-density clusters and in rural areas are highlighted in dark blue. Rural areas with more than 50% of the population living in rural areas are highlighted in light blue. Functional urban areas are circled in black. The core cities of the 31 urban functional areas in the Nordic Region correspond to the cities as defined by degree of urbanisation. In the functional urban areas of Esbjerg and Aalborg in Denmark, for instance, there are however no densely populated urban centres. The hinterlands in most functional urban areas in the Nordic Region do include towns and suburbs as well as rural areas. Moreover, municipalities in sparsely populated areas can display a high degree of urbanisation, such as, for example, Kiruna and Gällivare in Sweden. The map is based on data from the Joint Research Center, the OECD Eurostat and EC-DG Region 2011 and 2014. In Iceland, the FUA Reykjavik is represented by NUTS-2 region IS001/Capital region.
- 2018 February
- Administrative and functional divisions
- Nordic Region