67 Maps
Gone missing: Nordic people!
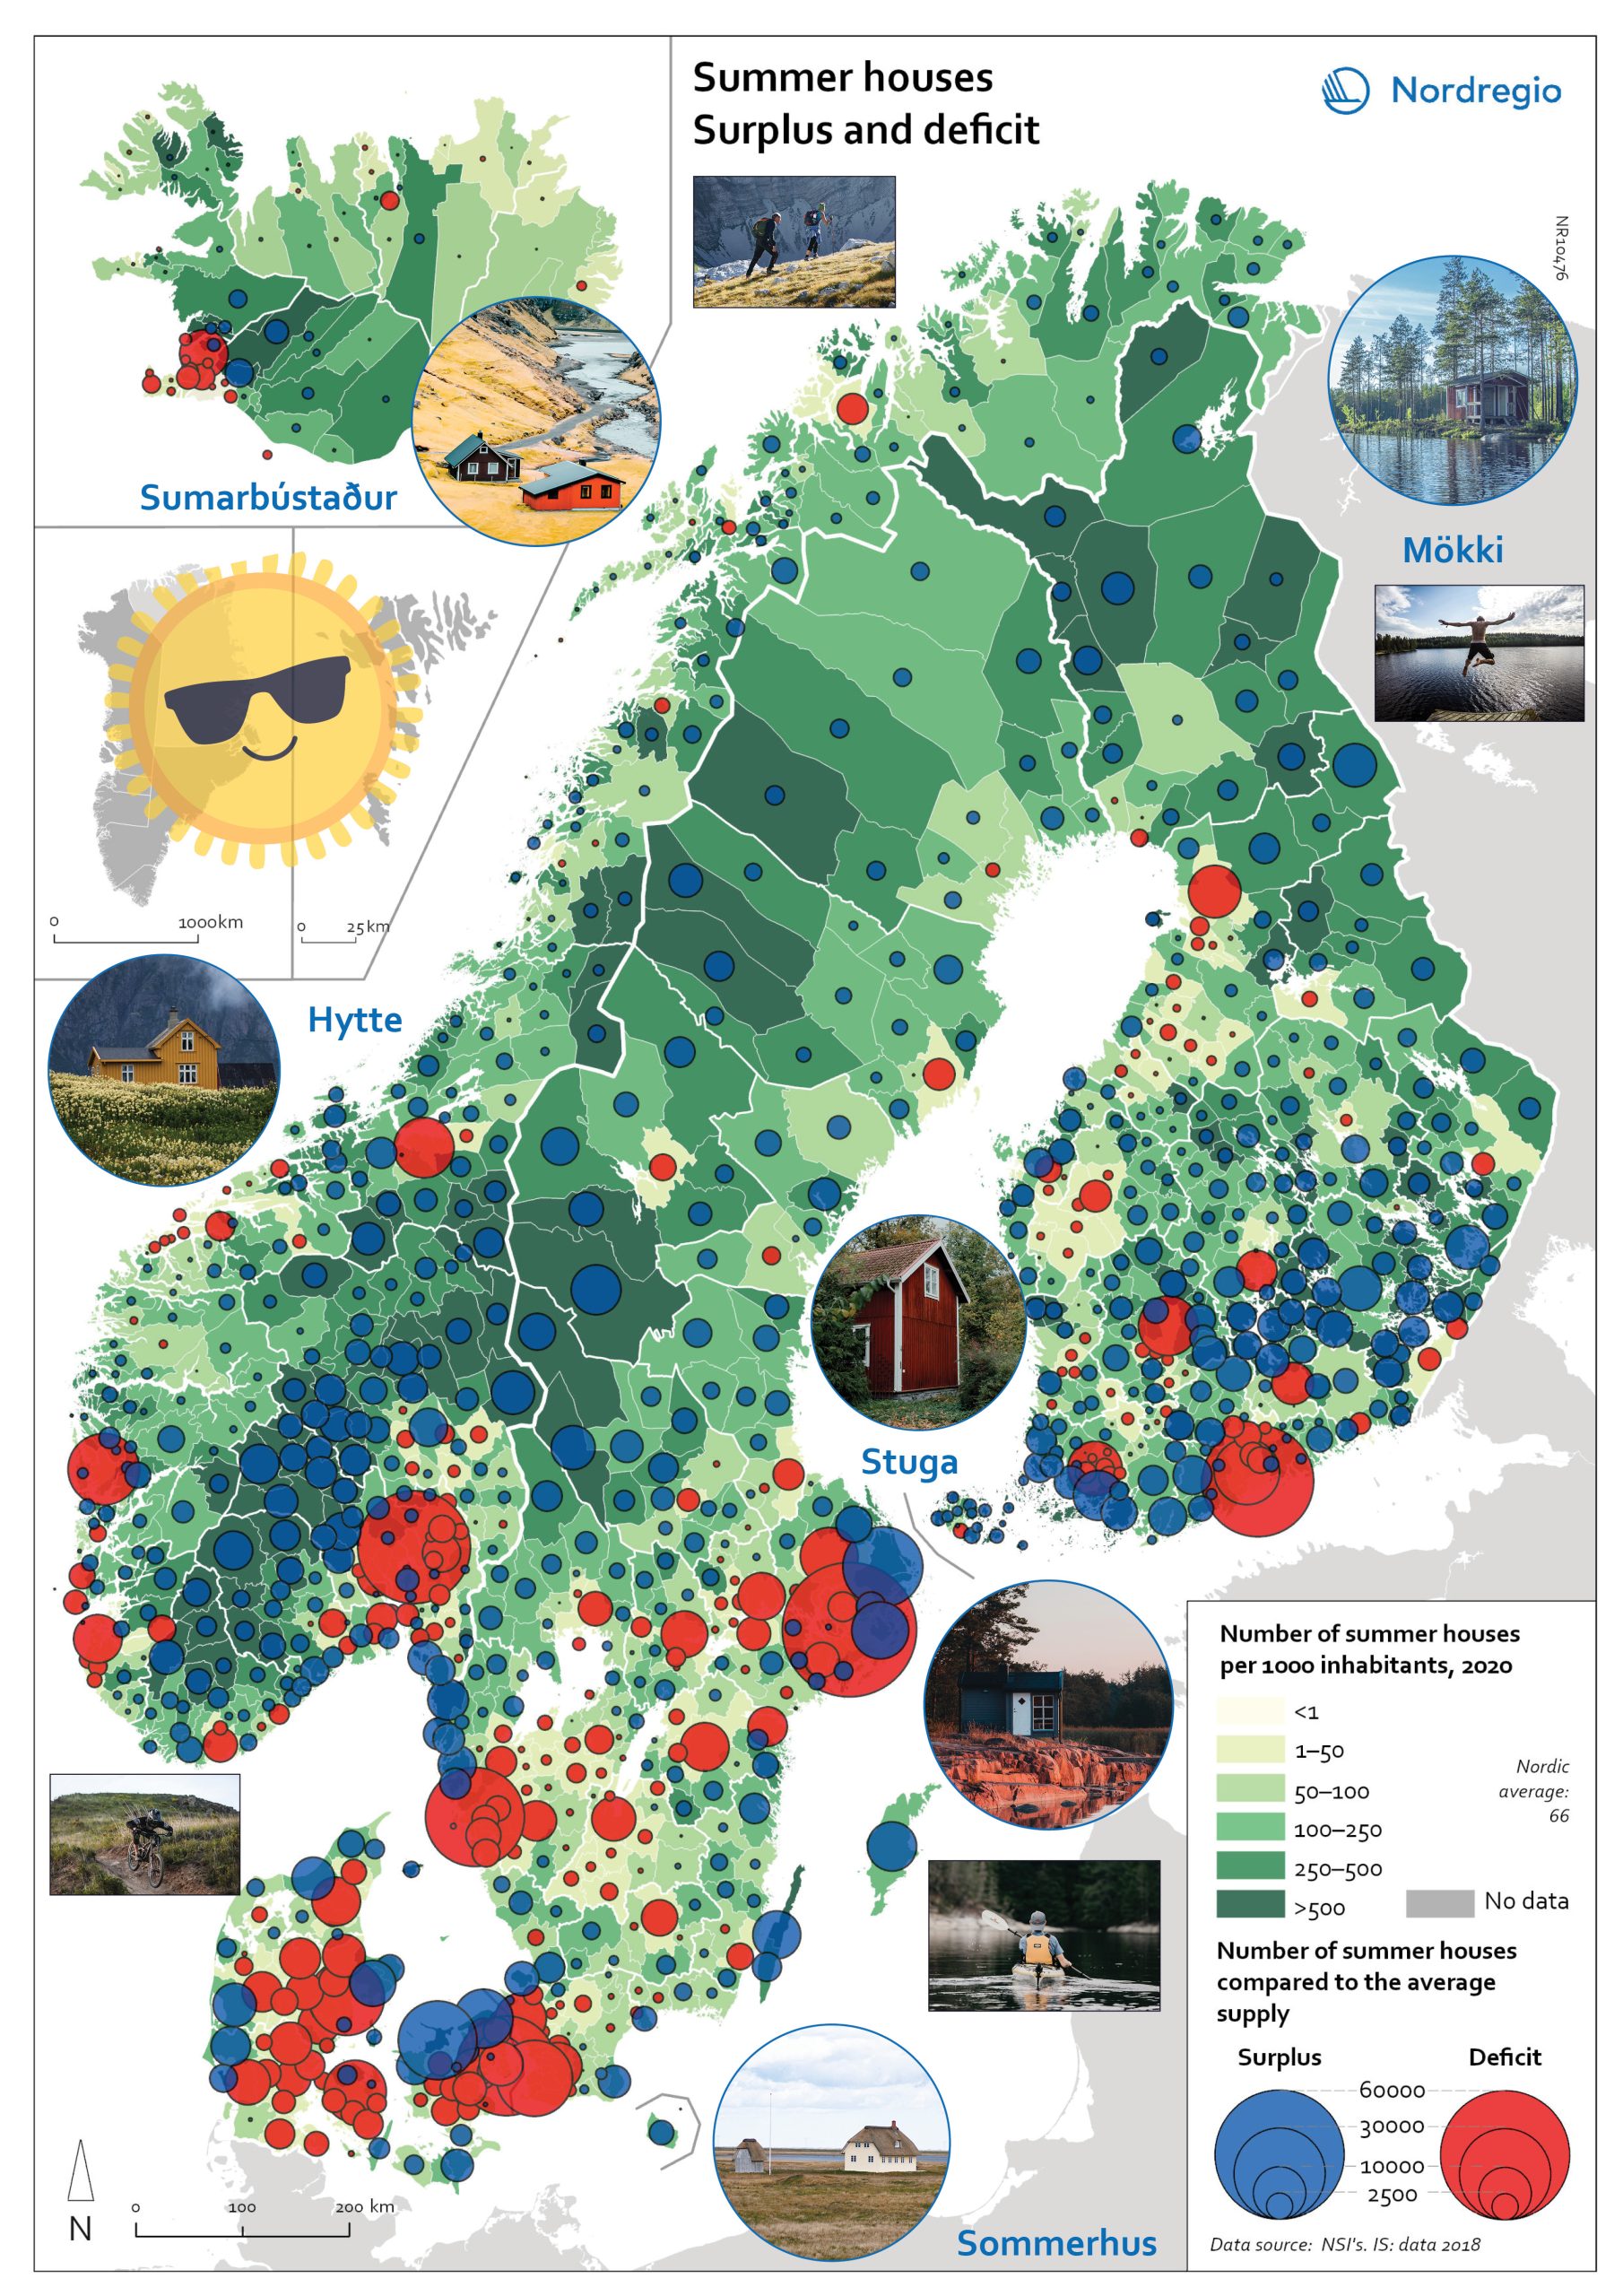
Nordregio Summer Map 2022: Empty streets, closed restaurants – where is everyone? Nordic cities are about to quiet down as millions of people are logging out from work. But where do they go – Mallorca? Some yes, but the Nordic people are known for their nature-loving and private spirit, and most like to unwind in isolation. So, they head to their private paradises – to one of the 1.8 million summer houses around the Nordics, or as they would call them: sommerhus, stuga, hytte, sumarbústaður or mökki. The Nordregio Summer Map 2022 reveals the secret spots. The Finnish and Norwegians are most likely already packing their cars and leaving the cities: the highest supply of summer houses per inhabitant is found in Finland (92 summer houses per 1000 inhabitants) closely followed by Norway (82). The Swedish (59) Danish (40) and Icelandic (40) people seem to have more varied summer activities. There are large regional differences in the number of summer houses and the number of potential users – so not enough cabins where people would want them! And this is the dilemma Nordregio Summer Map 2022 shows in detail. Most people live in the larger urban areas while many summer houses are located in more remote and sparsely populated areas. The largest deficit of summer houses is found in Stockholm: with almost 1 million inhabitants, there is a need for 65,000 summer houses but the municipality has only 2,000 to offer! So, people living in Stockholm need to go elsewhere to find a summer house. The same goes for the other capital municipalities which have large deficits in summer houses: Oslo is missing 44,000, Helsinki 43,000, and Copenhagen 34,000. Fortunately, there are places that would happily accommodate these second-home searchers. Good news for Stockholm after all as the top-scoring municipality…
 2022 June
 - Nordic Region
- Tourism
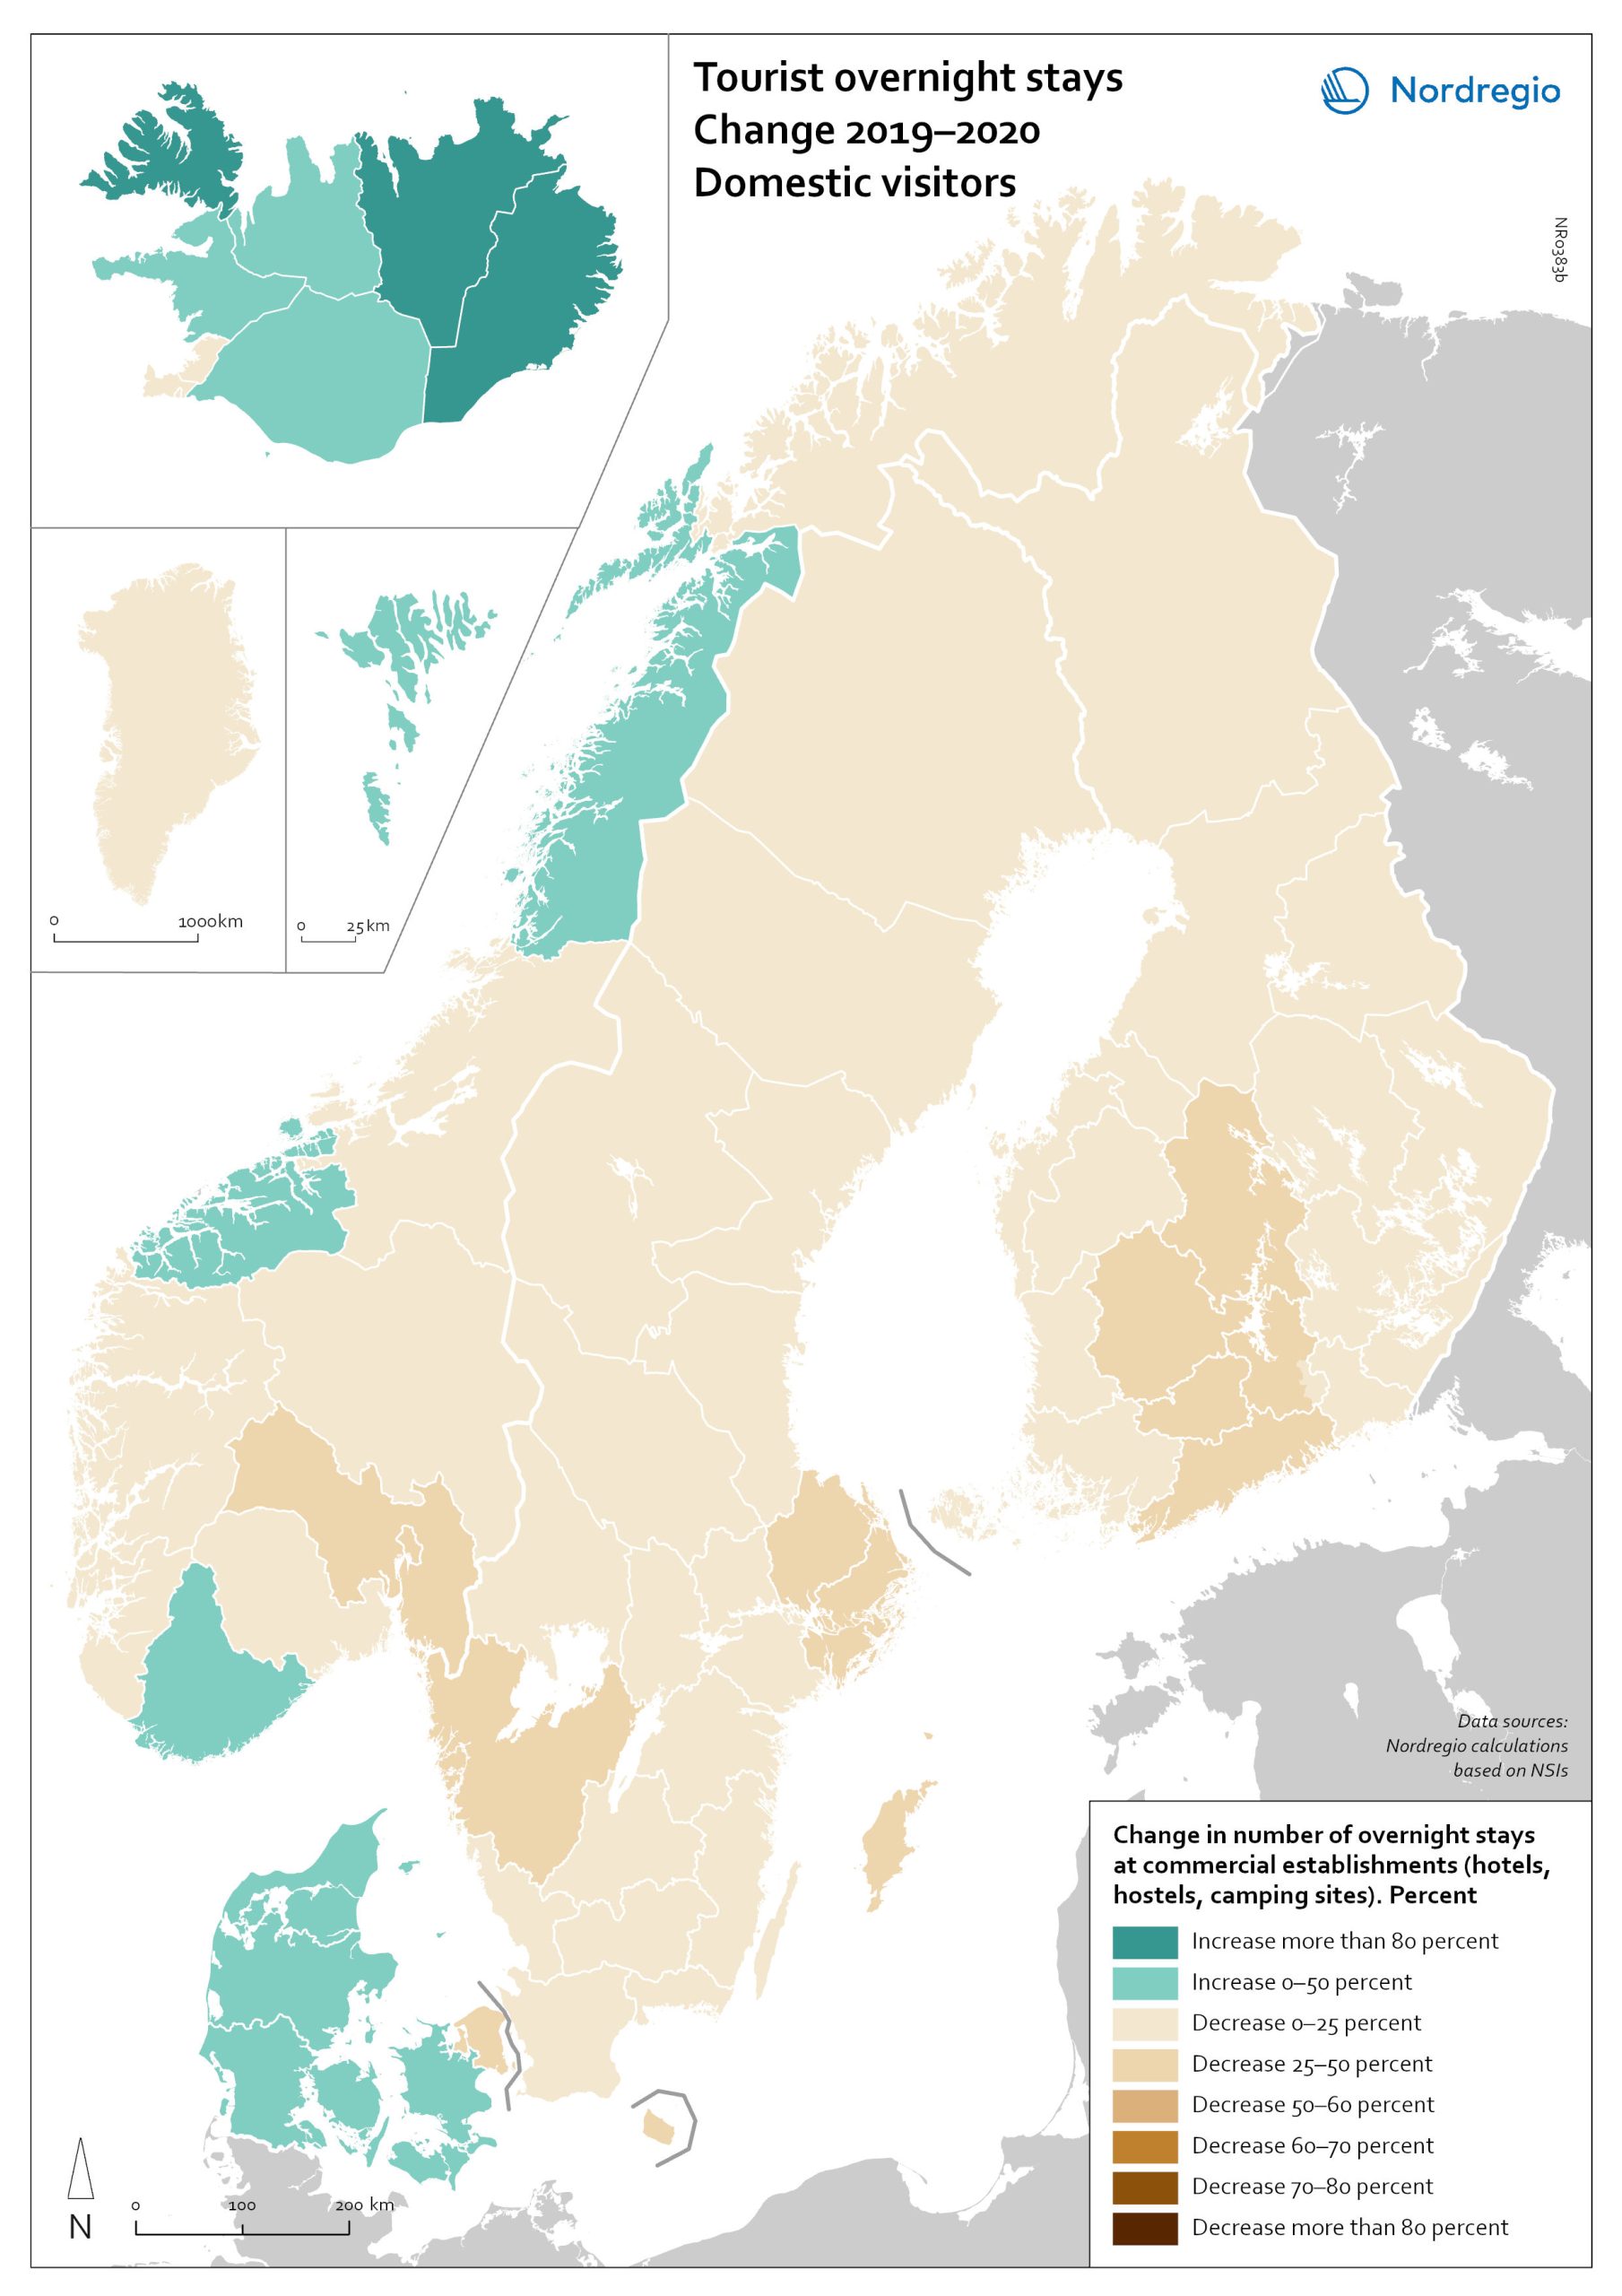
Change in overnight stays for domestic visitors 2019–2020
The map shows the relative change in the number of overnight stays at the regional level between 2019 and 2020 for domestic visitors. This map is related to the same map showing change in overnight stays for foreign visitors 2019–2020. The sharpest fall in visitors from abroad was in destinations where foreign tourists usually make up a high proportion of the total visitors. This is particularly relevant to islands like Åland (89% decrease on foreign visitors, from early 2019 to mid-2020) and to Iceland (66-77% drop depending on region). Lofoten and Nordland County in Norway, as well as Western Norway with Møre and Romsdal, which also have a high proportion of international tourists during the summer season due to their scenic landscape, also recorded sharp falls of 77-79% on foreign visitors during the same period. In Finland, the lake district (South Savo) and Southern Karelia, as well as the coastal Central Ostrobothnia (major cities Vasa and Karleby), recorded a 75-77% drop in the number of visitors from abroad. The fall here was mainly due to the lack of tourists from Russia. Even Finnish Lapland suffered a major fall in international visits during the winter peak period. For many local businesses that rely heavily on winter holidaymakers, the 2021/22 winter was a make-or-break season. In Sweden, the regions of Kalmar, Västra Götaland, Värmland and Örebro lost 77–79% of visitors from abroad, probably due to much fewer visitors from neighbouring Norway and from Denmark. In Denmark, the number of overnight stays by visitors from abroad to the Capital Region was down by 73%, whereas the number of domestic visitors declined by 27%. No region lost as many overnight visitors, both from abroad and domestic, as the capital cities and larger urban areas in the Nordic countries. Copenhagen, Oslo, Stockholm, Helsinki and Reykjavik…
- 2022 March
- Nordic Region
- Tourism
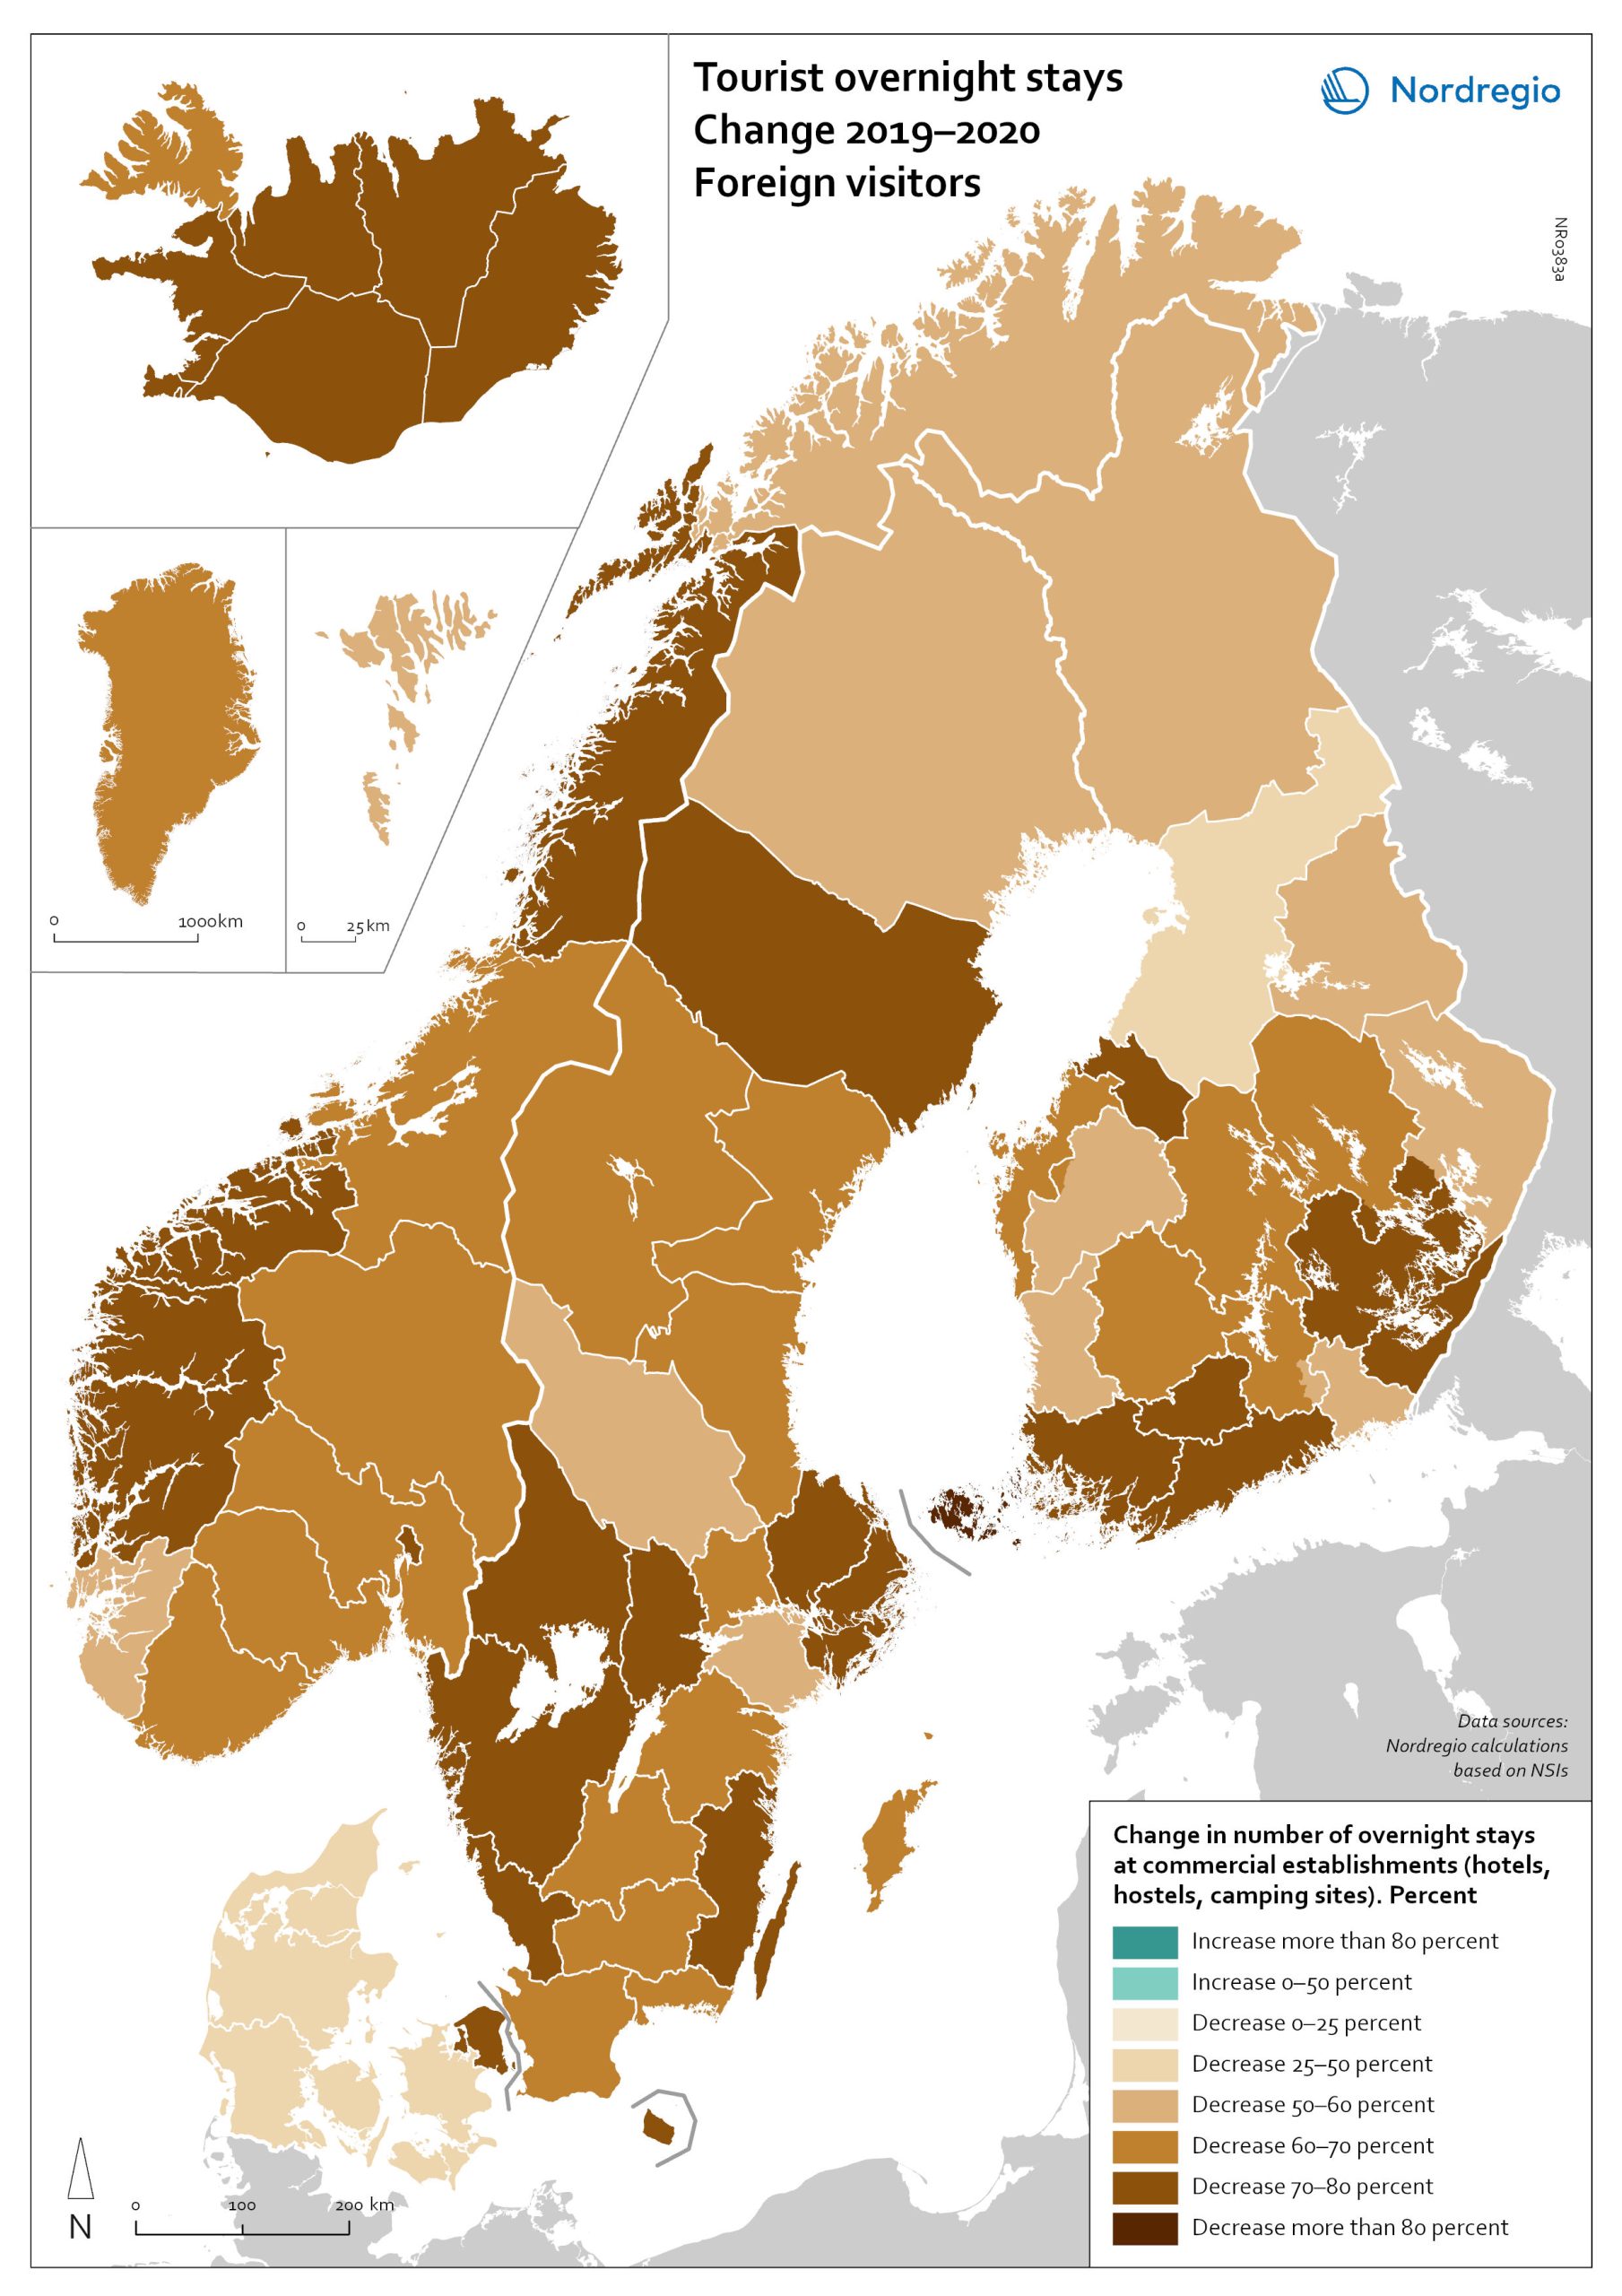
Change in overnight stays for foreign visitors 2019–2020
The map shows the relative change in the number of overnight stays at the regional level between 2019 and 2020 for foreign visitors. This map is related to the same map showing change in overnight stays for domestic visitors 2019–2020. The sharpest fall in visitors from abroad was in destinations where foreign tourists usually make up a high proportion of the total visitors. This is particularly relevant to islands like Åland (89% decrease on foreign visitors, from early 2019 to mid-2020) and to Iceland (66-77% drop depending on region). Lofoten and Nordland County in Norway, as well as Western Norway with Møre and Romsdal, which also have a high proportion of international tourists during the summer season due to their scenic landscape, also recorded sharp falls of 77-79% on foreign visitors during the same period. In Finland, the lake district (South Savo) and Southern Karelia, as well as the coastal Central Ostrobothnia (major cities Vasa and Karleby), recorded a 75-77% drop in the number of visitors from abroad. The fall here was mainly due to the lack of tourists from Russia. Even Finnish Lapland suffered a major fall in international visits during the winter peak period. For many local businesses that rely heavily on winter holidaymakers, the 2021/22 winter was a make-or-break season. In Sweden, the regions of Kalmar, Västra Götaland, Värmland and Örebro lost 77–79% of visitors from abroad, probably due to much fewer visitors from neighbouring Norway and from Denmark. In Denmark, the number of overnight stays by visitors from abroad to the Capital Region was down by 73%, whereas the number of domestic visitors declined by 27%. No region lost as many overnight visitors, both from abroad and domestic, as the capital cities and larger urban areas in the Nordic countries. Copenhagen, Oslo, Stockholm, Helsinki and Reykjavik…
- 2022 March
- Nordic Region
- Tourism
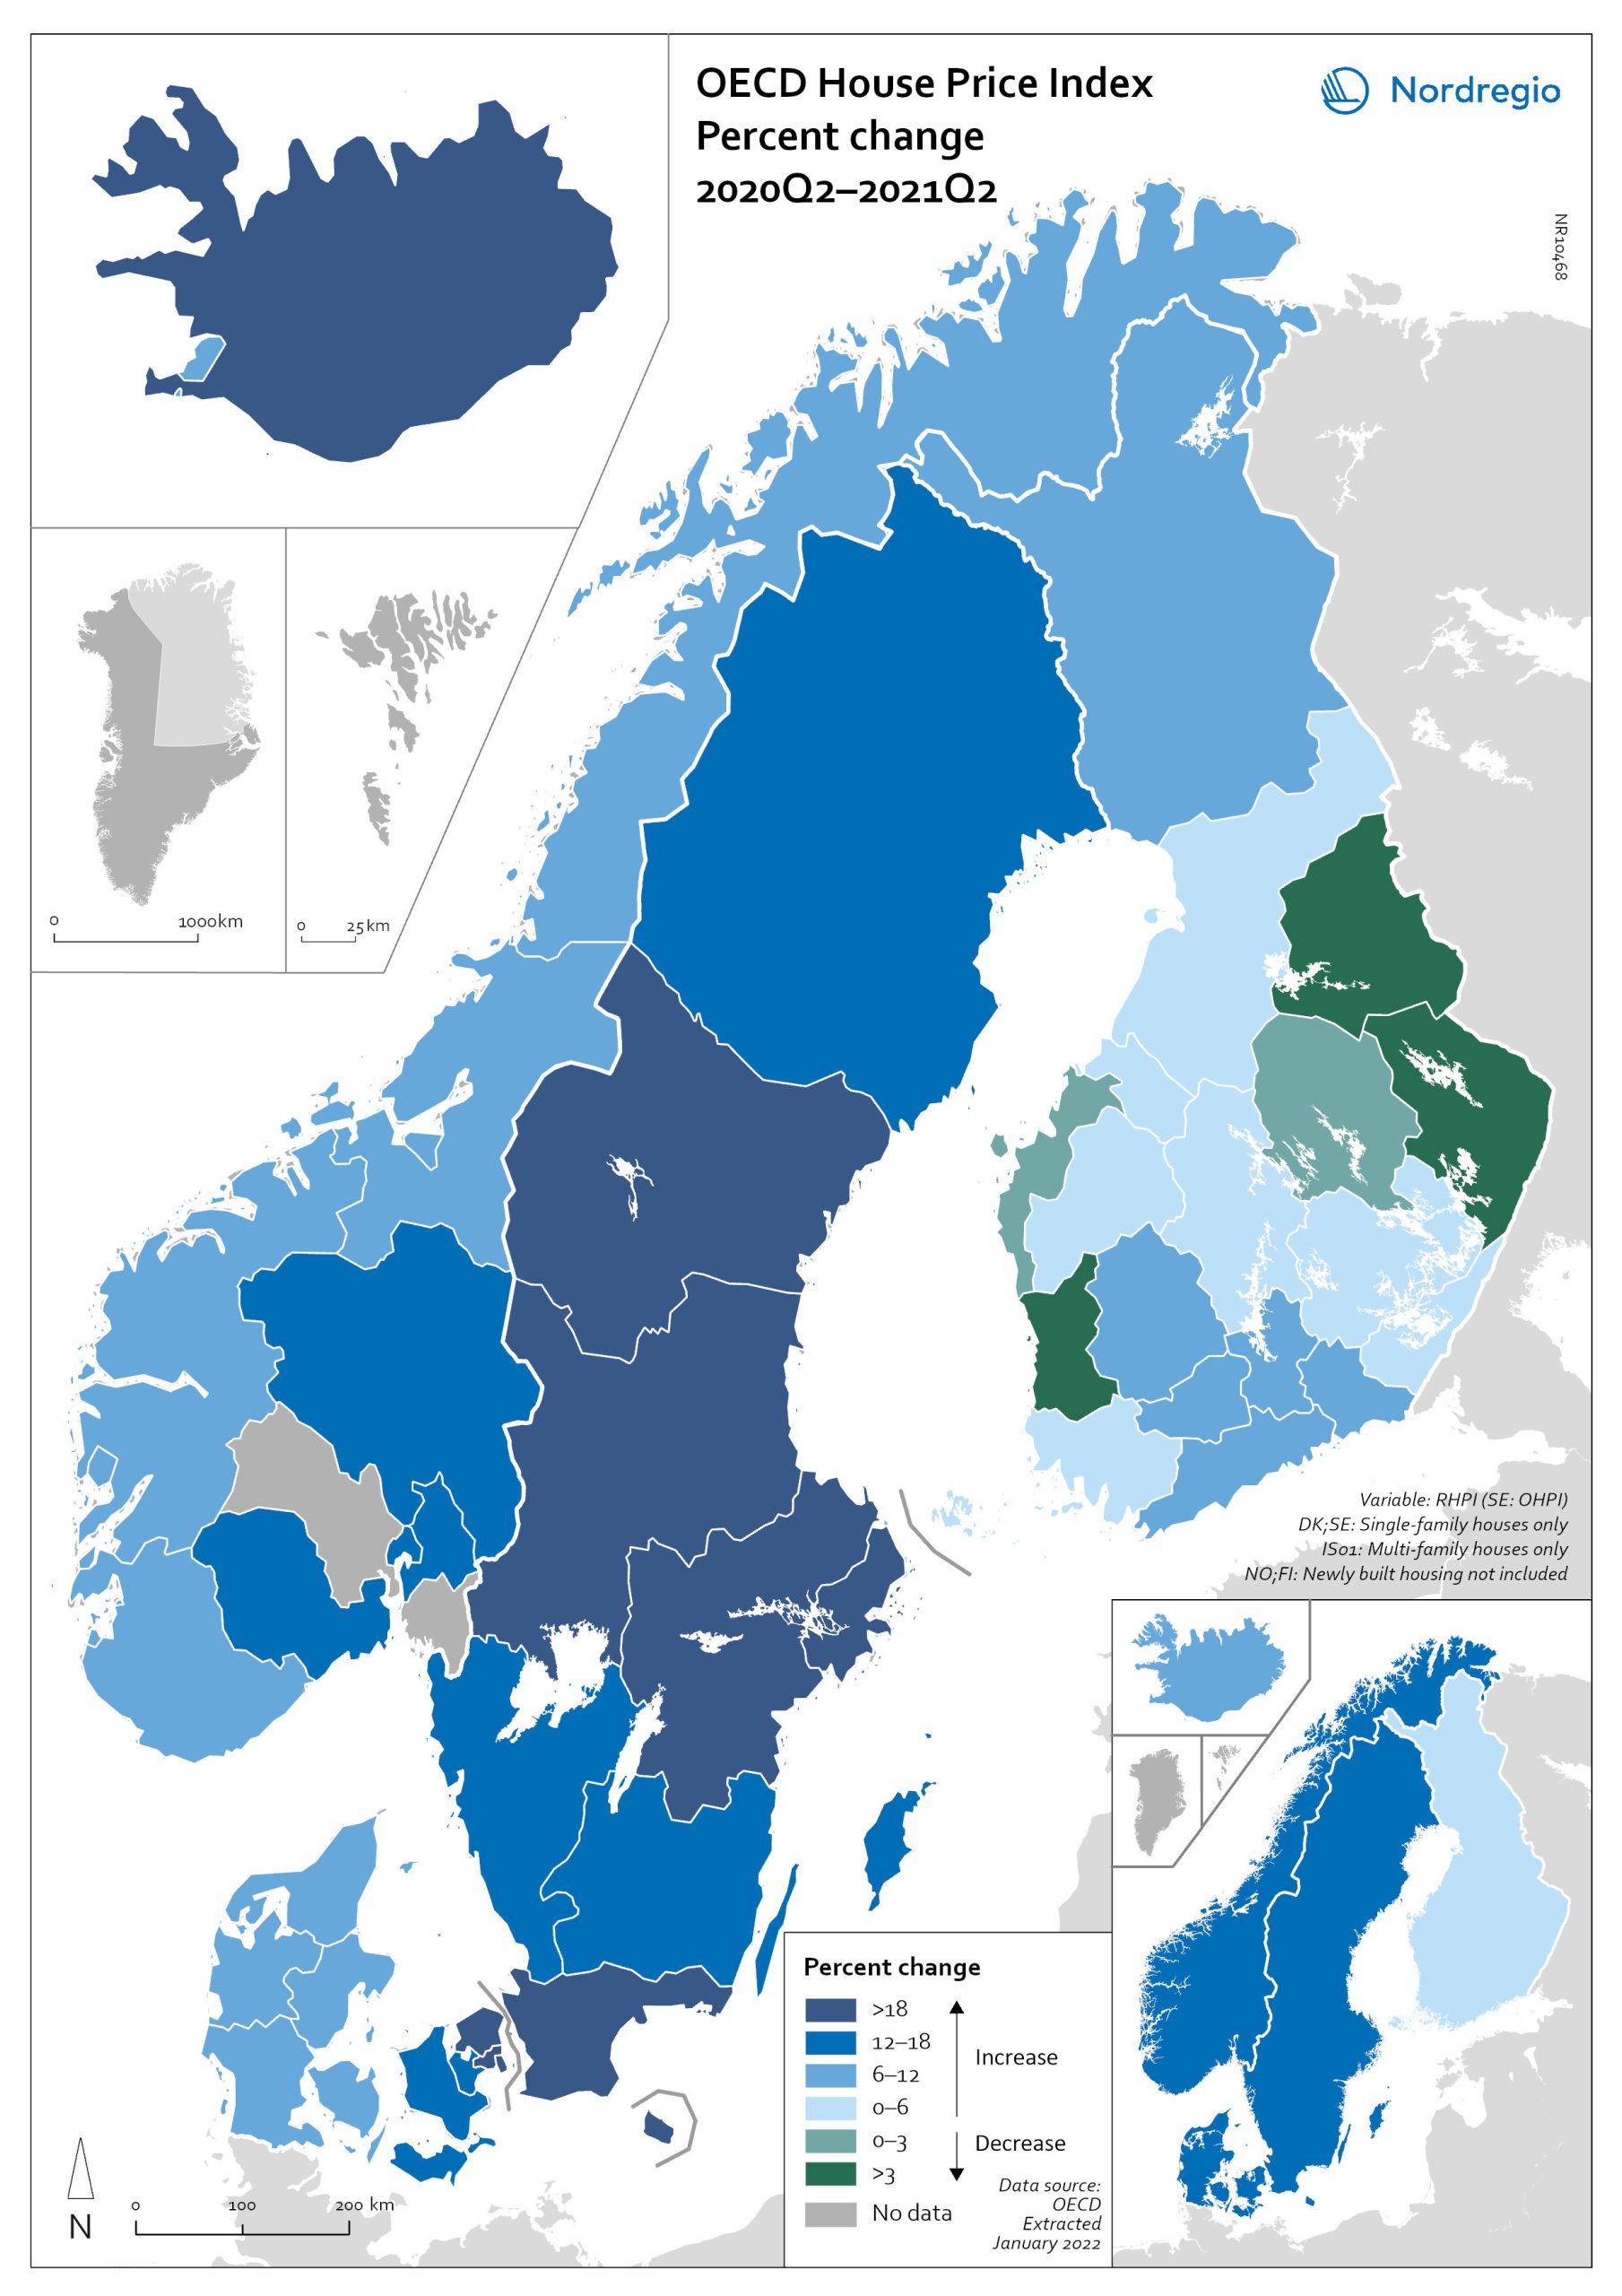
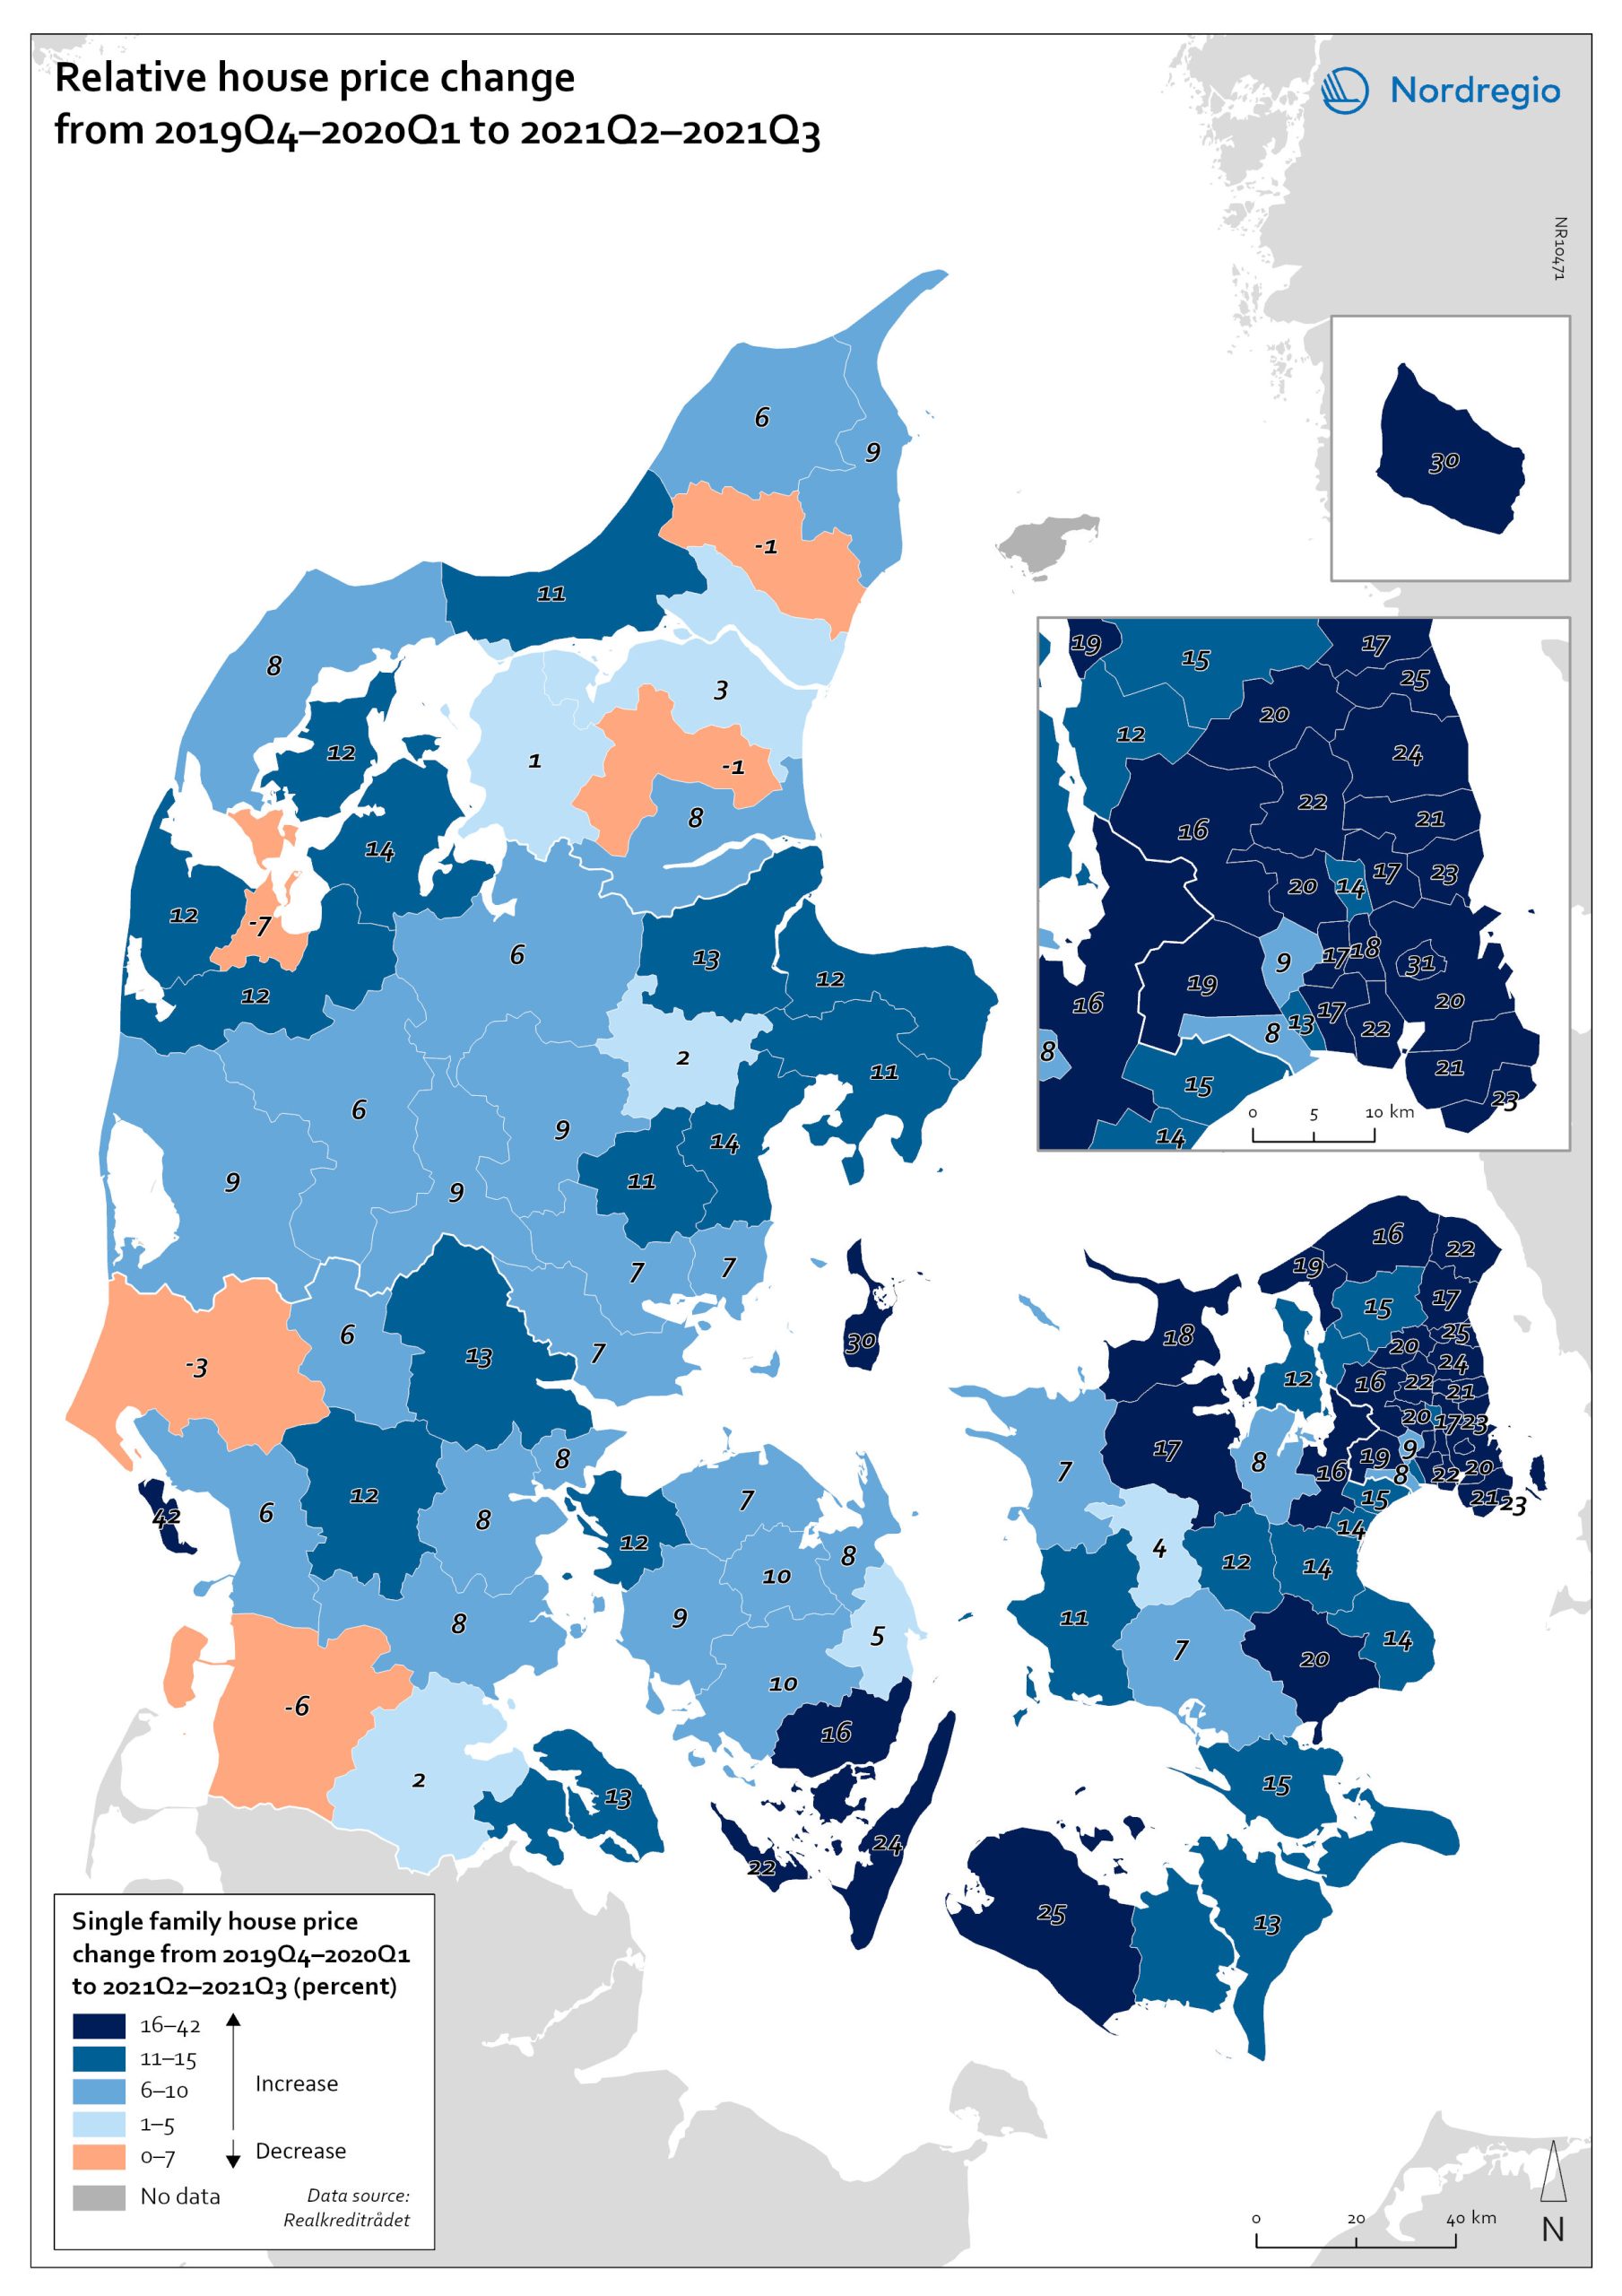
OECD House Price Index. Change 2020Q2–2021Q2
The map shows the relative change of the OECD House Price Index from Q2 2020 to Q2 2021. The map shows that the price development was not uniform within the countries. Iceland recorded the largest price increases overall, with the most marked price increases found outside of the capital region. All Swedish regions recorded increases above 20%, with the highest increases in the Stockholm and Malmö regions. All Norwegian regions showed price increases, though to a lesser extent than Swedish regions in most cases. In Denmark, Bornholm, Sjælland and the rural islands of Lolland and Falster recorded relatively high price increases, although many rural areas developed from low absolute prices in 2020. Finland was the only country where some regions saw property prices decrease. Moderate increases were still observed in some of the southern regions, where the major cities are located, and in the north.
- 2022 March
- Economy
- Nordic Region
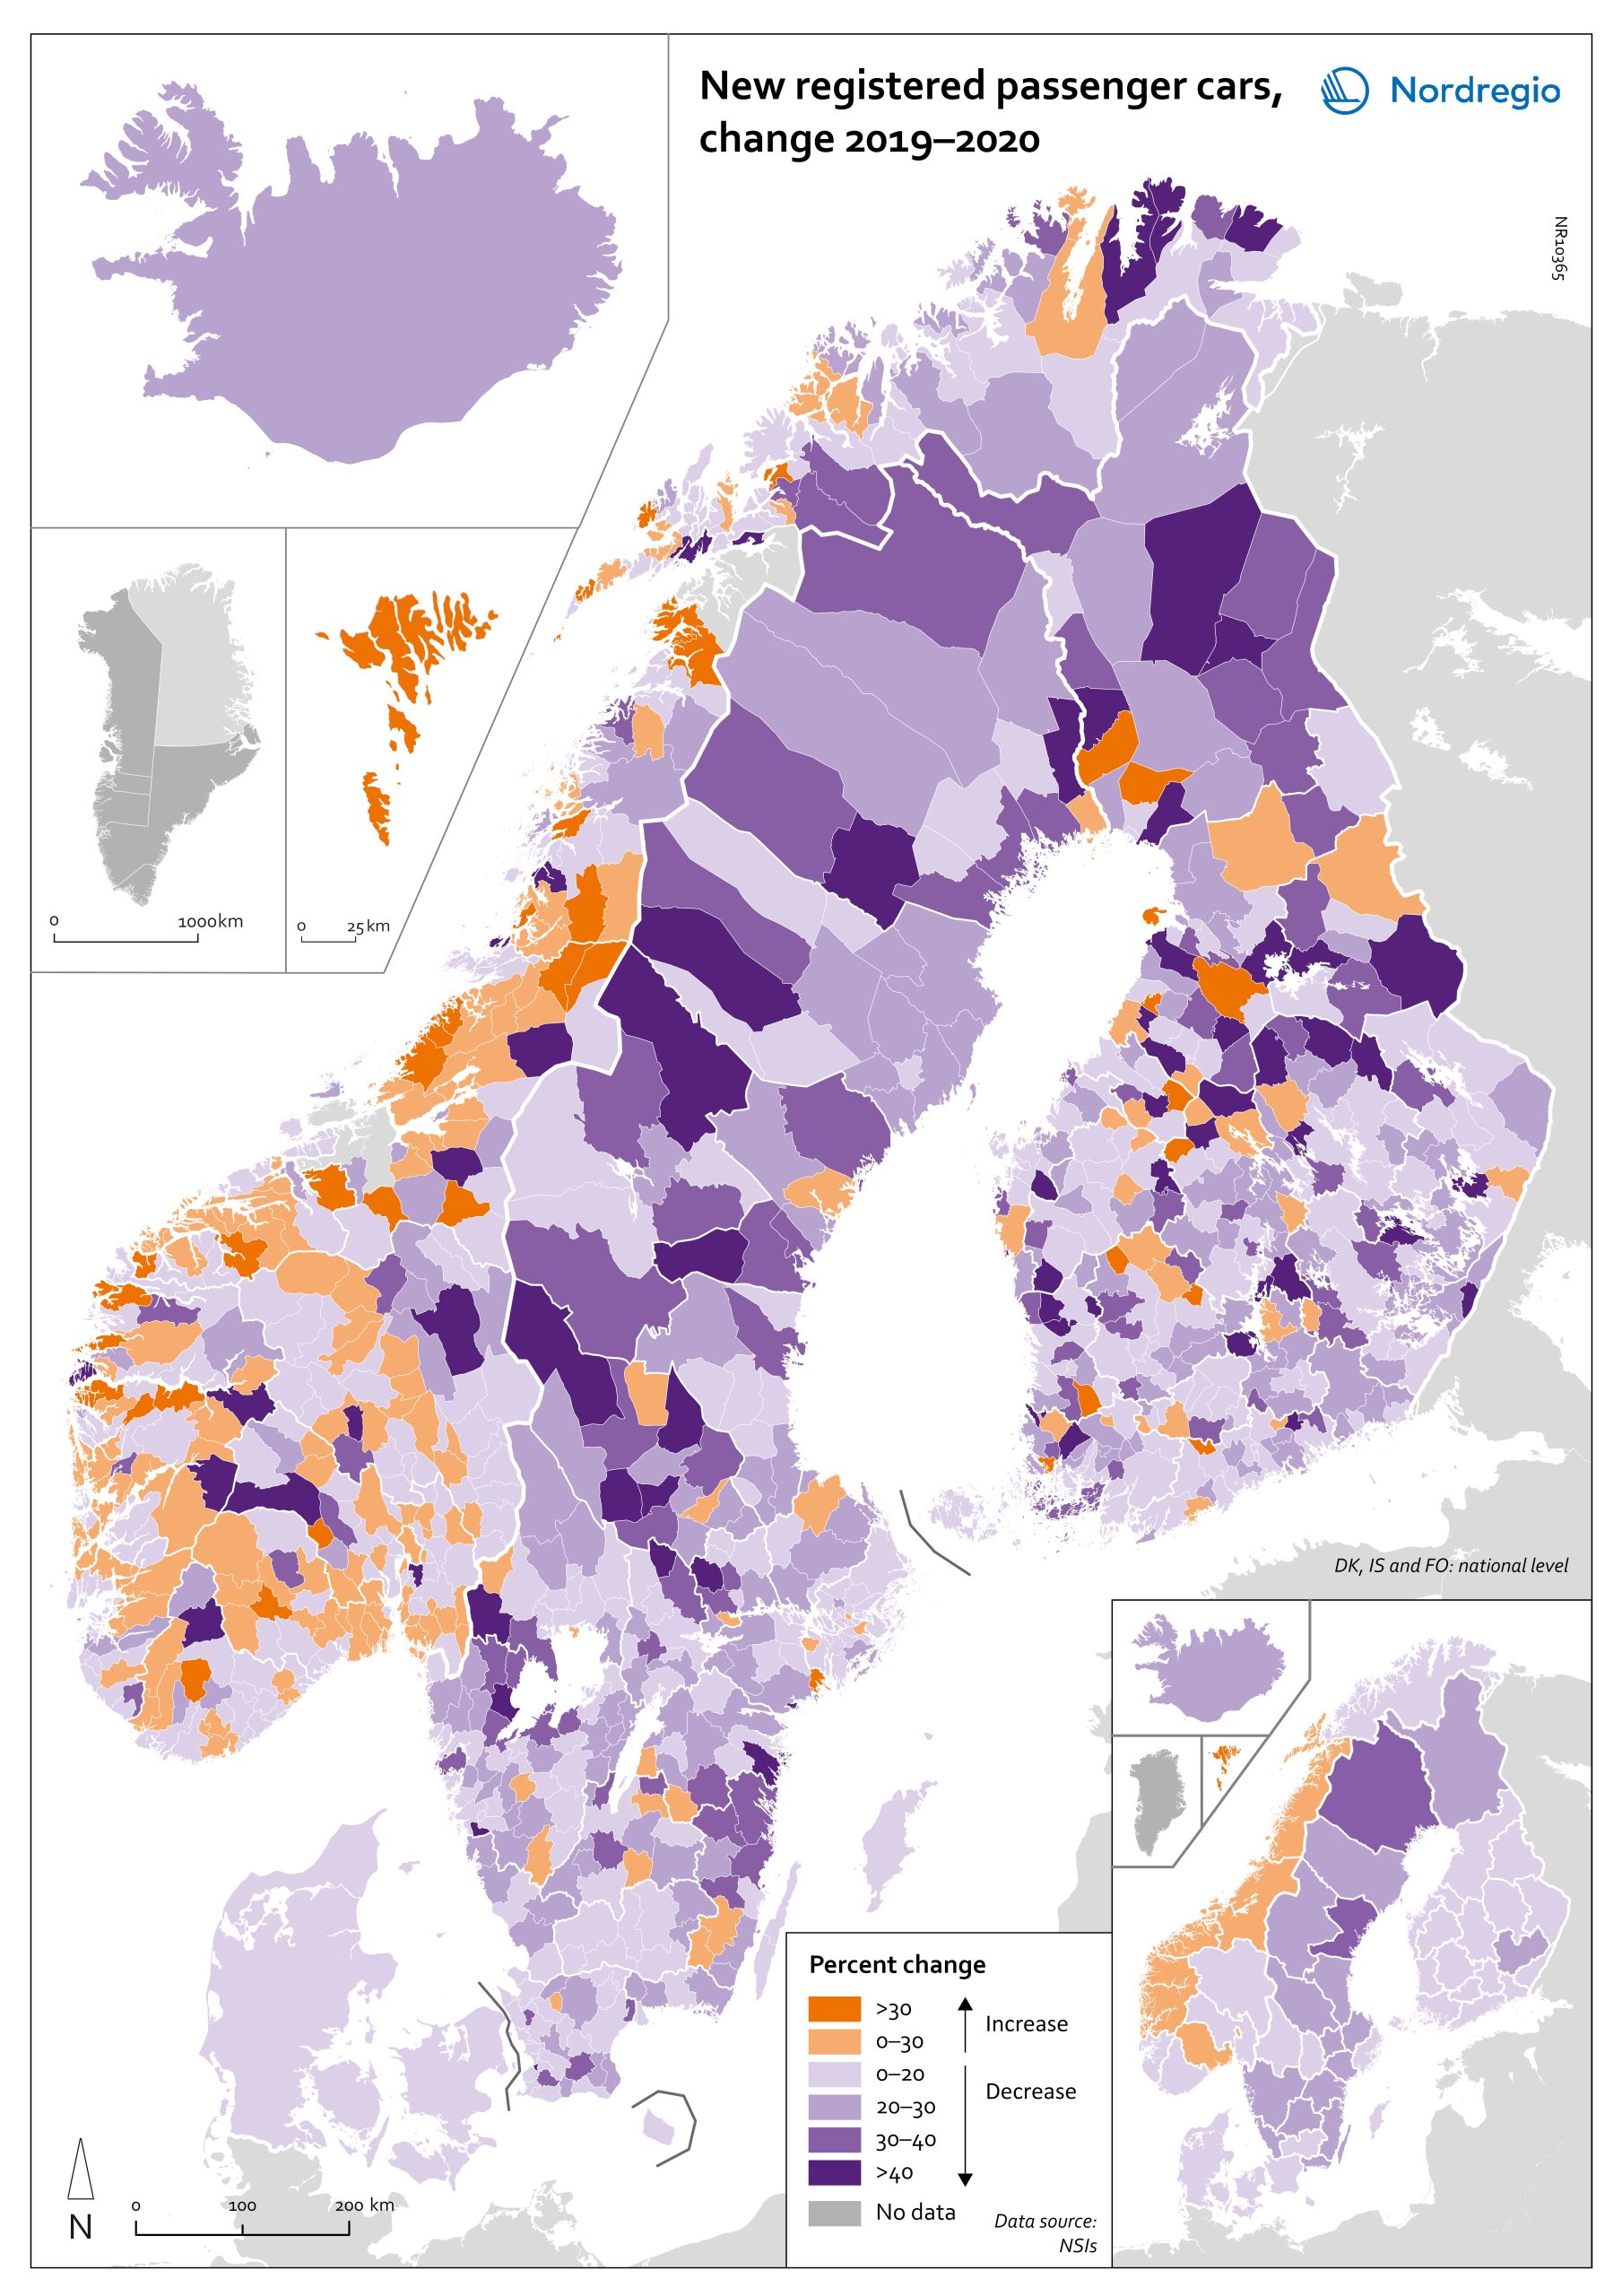
Change in new registered cars 2019-2020
The map shows the change in new registered passenger cars from 2019 to 2020. In most countries, the number of car registrations fell in 2020 compared to 2019. On a global scale, it is estimated that sales of motor vehicles fell by 14%. In the EU, passenger car registrations during the first three quarters of 2020 dropped by 28.8%. The recovery of consumption during Q4 2020 brought the total contraction for the year down to 23.7%, or 3 million fewer cars sold than in 2019. In the Nordic countries, consumer behaviour was consistent overall with the EU and the rest of the world. However, Iceland, Sweden, Finland, Åland, and Denmark recorded falls of 22%–11% – a far more severe decline than Norway, where the market only fell by 2.0%. The Faroe Islands was the only Nordic country to record more car registrations, up 15.8% in 2020 compared to 2019. In Finland, Iceland, Norway, and Sweden, there were differences in car registrations in different parts of the country. In Sweden and Finland, the position was more or less the same in the whole of the country, with only a few municipalities sticking out. In Finland and Sweden, net increases in car registrations were concentrated in rural areas, while in major urban areas, such as Uusimaa-Nyland in Finland and Västra Götaland and Stockholm in Sweden, car sales fell between 10%–22%. Net increases in Norway were recorded in many municipalities throughout the whole country in 2020 compared to 2019.
- 2022 March
- Economy
- Nordic Region
- Transport
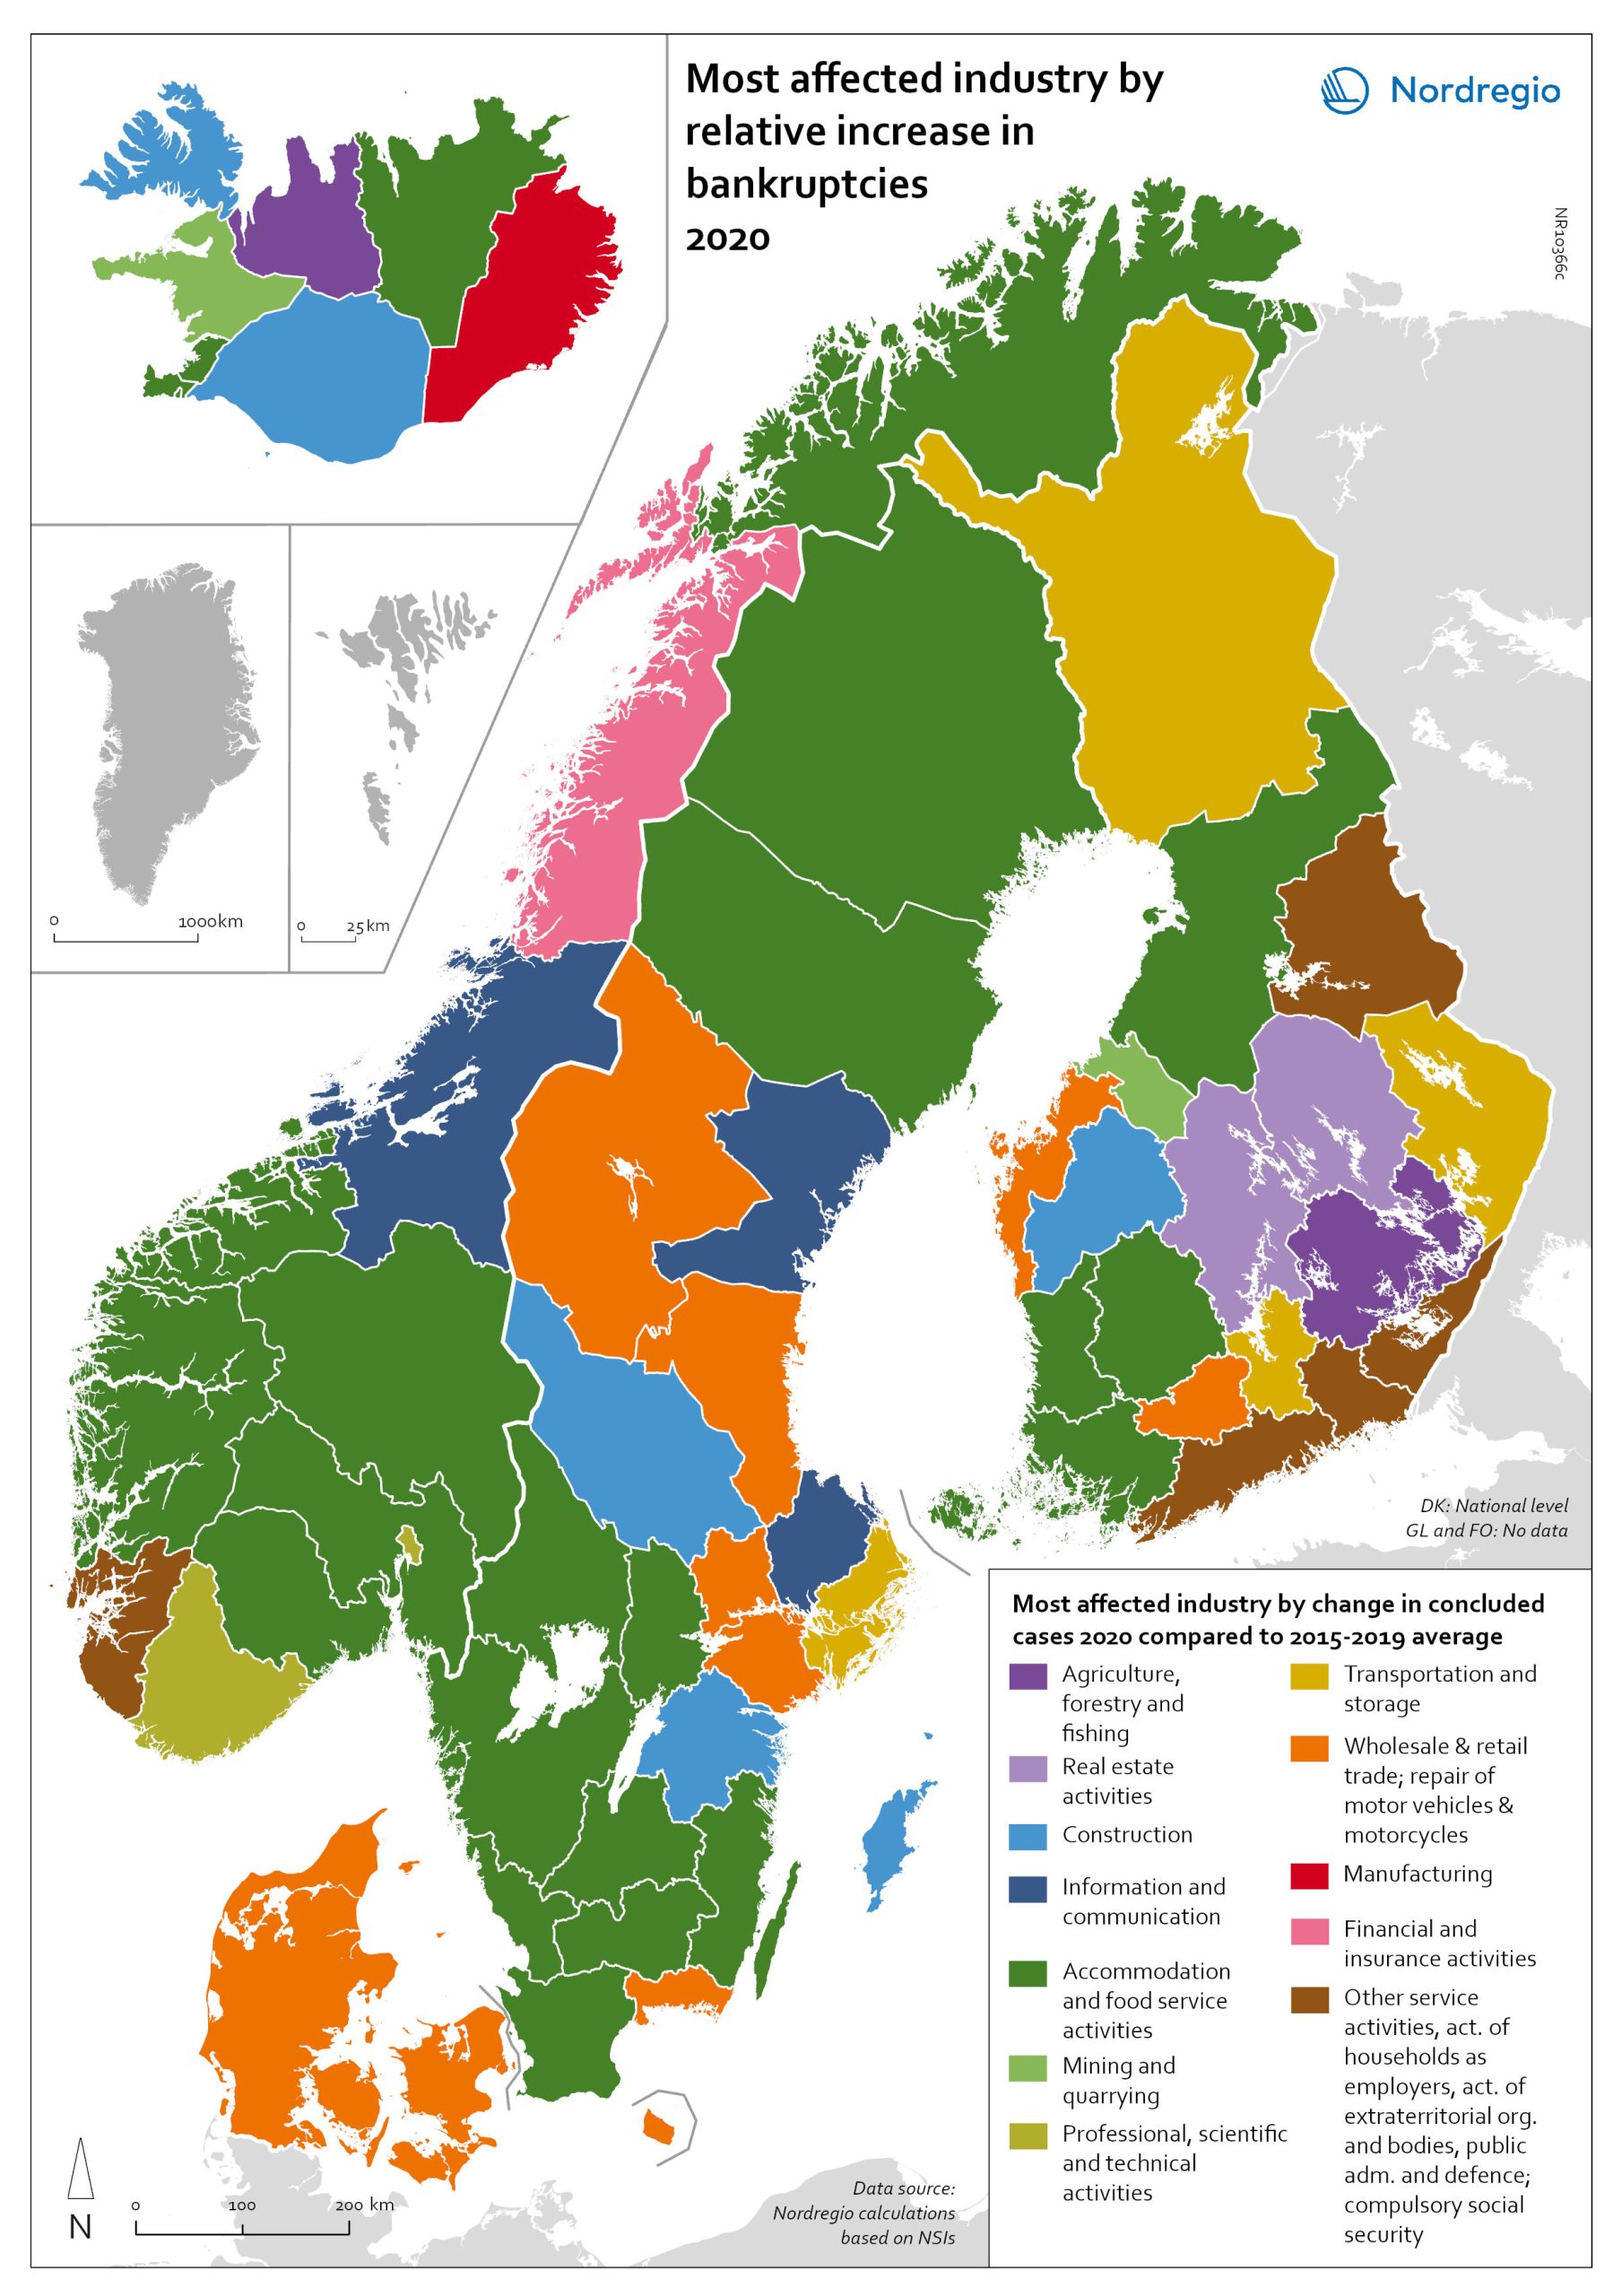
Bankruptcies in 2020 by industry and region
The map shows the most affected industry by relative increase in concluded business bankruptcies 2020 compared to 2015–2019 average. Regional patterns in business failures are linked to factors ranging from the effectiveness of the measures adopted by the various governments to the exposure of regional economies to vulnerable sectors. Regions with higher numbers of bankruptcies tend to reflect the concentration of economic activity in sectors particularly affected by the pandemic. It comes as little surprise that Accommodation and food service activities were the industries with the largest increase in business bankruptcies in 2020 compared to the 2015–2019 baseline. In the Nordic Region as a whole, the number rose by 28.6%. This pattern is also discernible at the regional level. Hotels and restaurants were the activities with the biggest increase in the number of bankruptcies in a significant number of Swedish, Norwegian and Finnish regions. Other sectors suffering higher-than-average numbers of business bankruptcies are service industries, particularly those requiring closer social interaction, like Education (16.5% increase), Other service activities (12.0% increase) and Administrative and support service activities (7.9% increase). The logistics sector was also greatly affected, with major impact localised around logistics centres and transport nodes in the different countries. In the capital regions of Oslo, Stockholm and Helsinki, Transportation and storage was the sector with the largest increase in bankruptcies. Wholesale and retail trade; repair of motor vehicles and motorcycles was the industry to suffer the most in Denmark and several Finnish and Swedish regions.
- 2022 March
- Economy
- Nordic Region
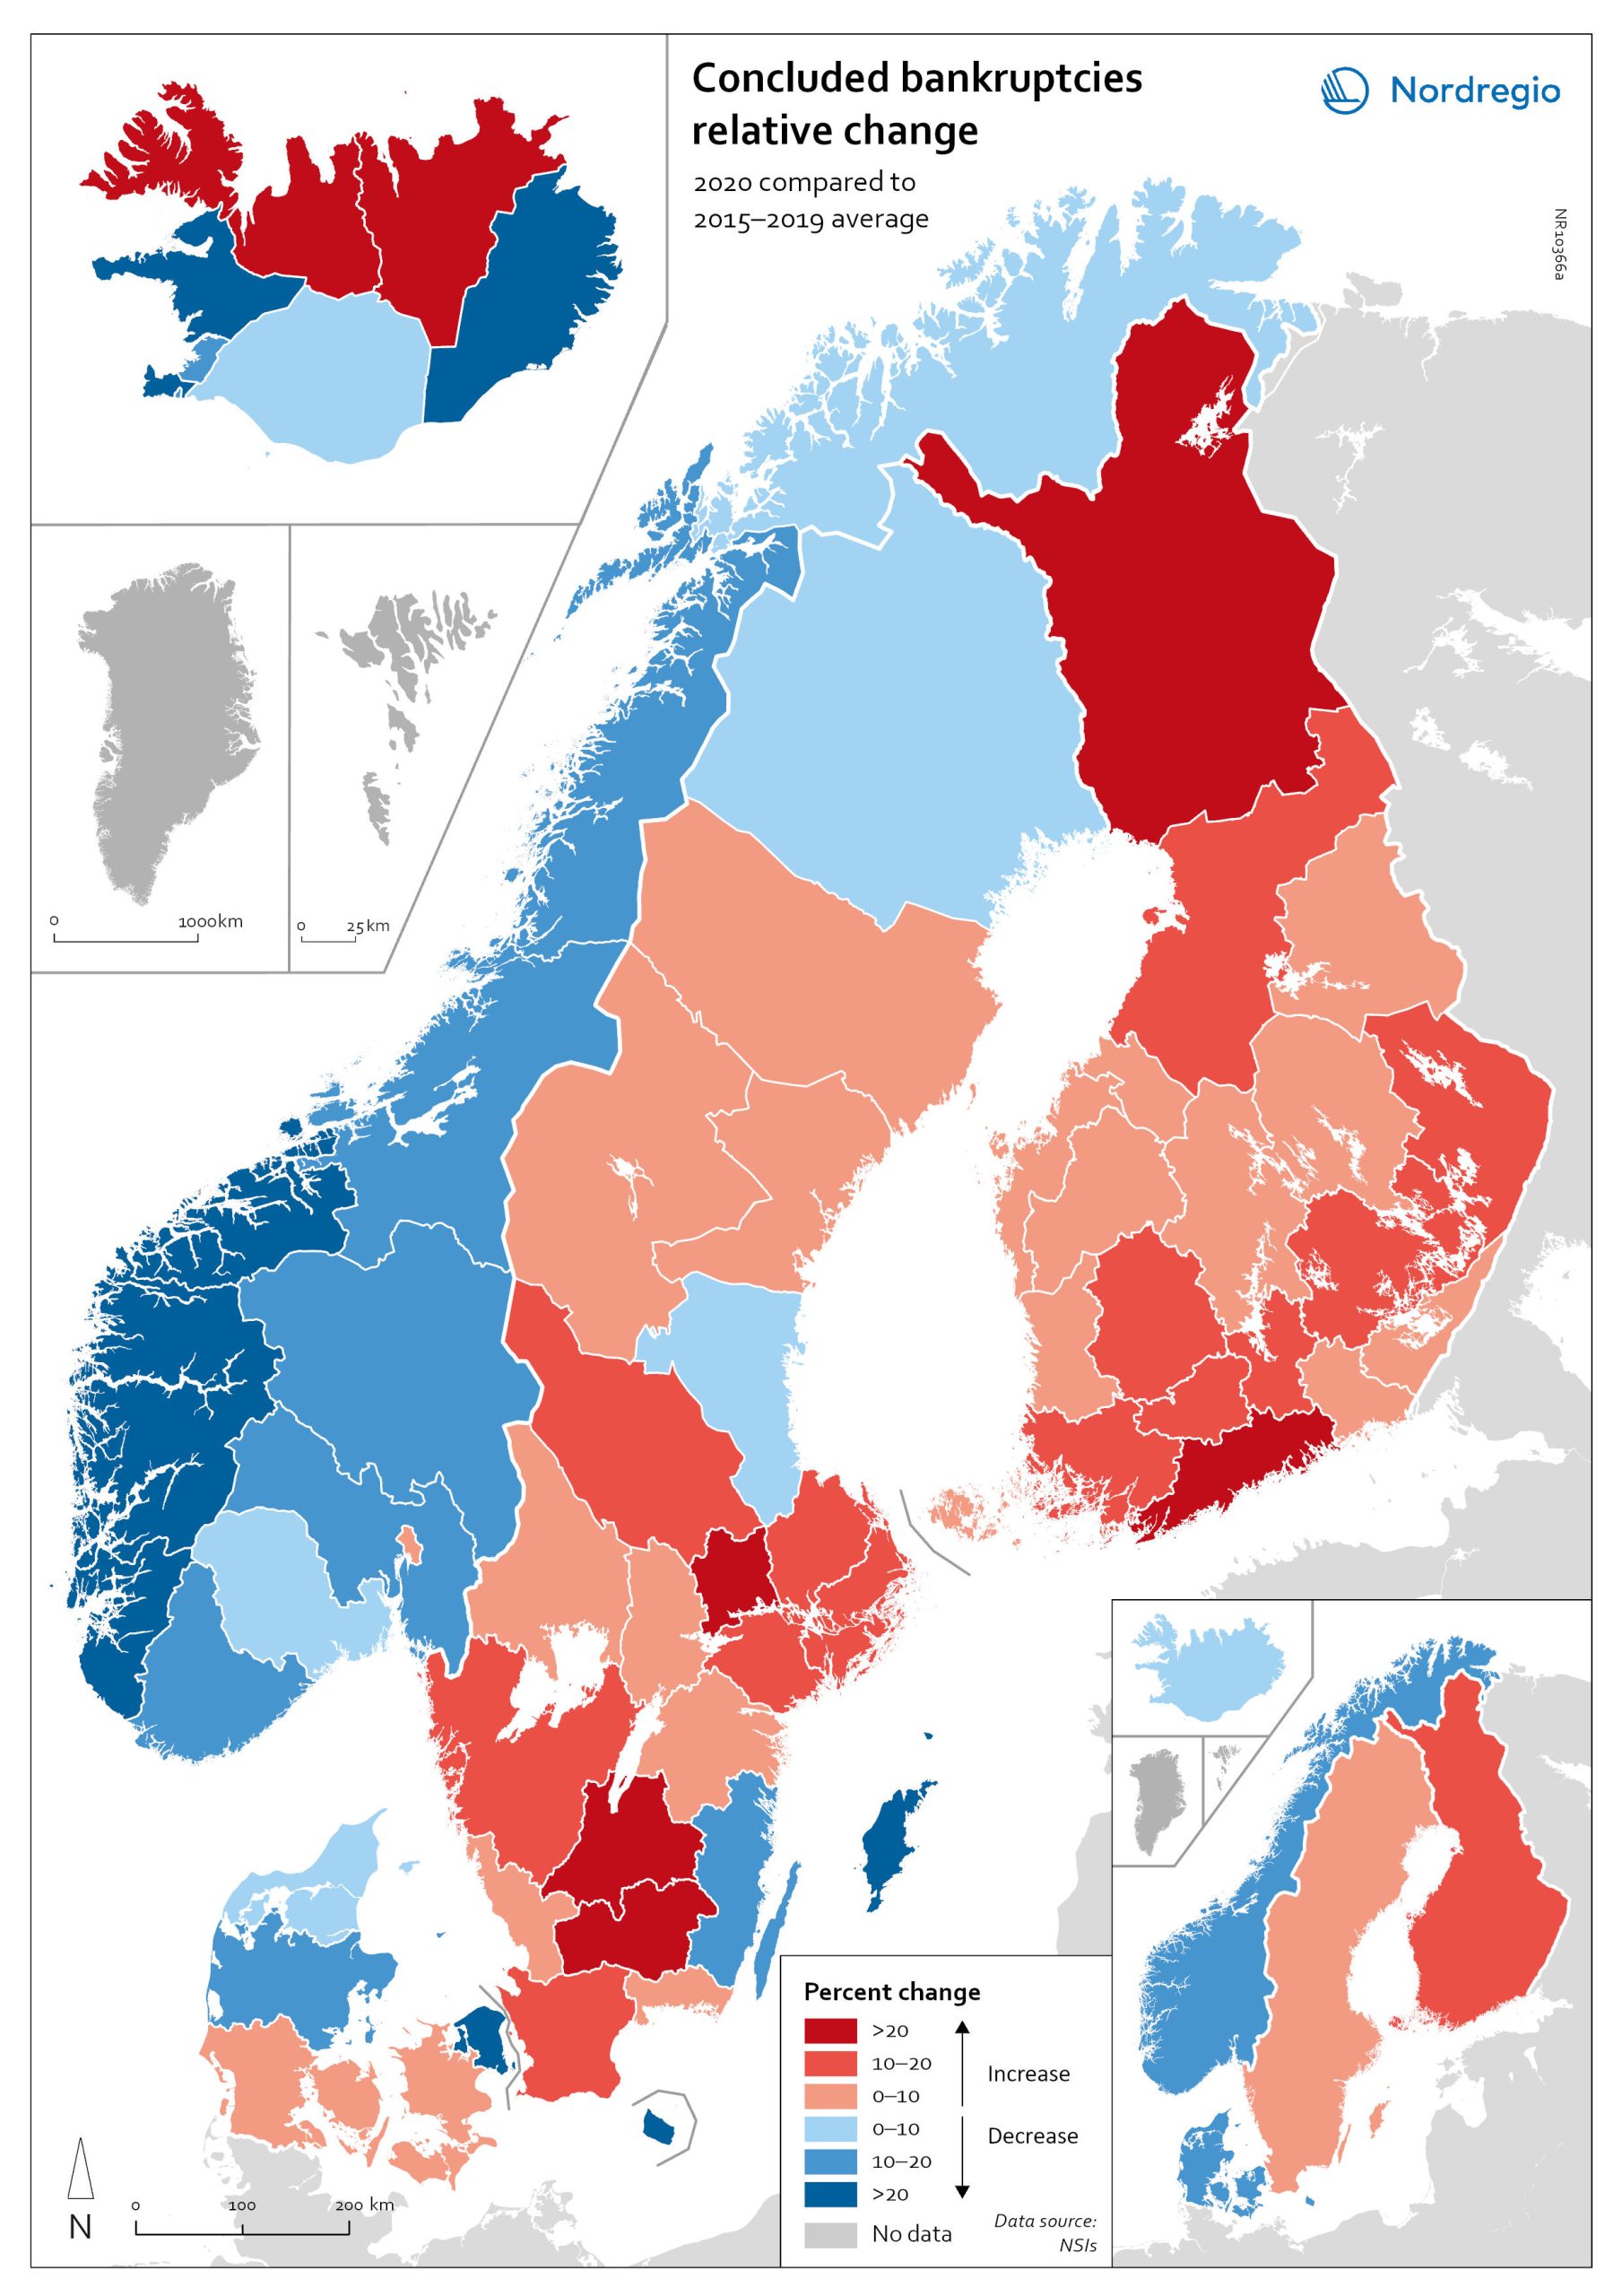
Relative change in the number of business bankruptcies
The map shows the relative change in the number of concluded business bankruptcies by region, 2015–2019 average compared to 2020. At sub-national levels, the distribution of business bankruptcies does not show a clear territorial pattern. In Iceland and Denmark, businesses in the most urbanised areas, including the capital regions, seem to have been those that benefited most from the economic mitigation measures (-23.9% in Höfuðborgarsvæðið and -24.4% in Region Hovedstaden). By contrast, Oslo is the only Norwegian region where there were more business bankruptcies in 2020 compared to the 2015–2019 baseline (1.9% increase). Most Norwegian regions did, in fact, have fewer bankruptcies in 2020, particularly in the western regions. One plausible explanation for this could be that the number of business failures during the baseline period was especially high in western Norway due to the fall in oil prices in 2014–2015. In Sweden the situation is even more mixed. Here, businesses in urban areas seem to have been more exposed to the distress caused by the Covid-19 pandemic. The most urbanised regions in the Stockholm-Gothenburg-Malmö corridor registered a greater increase in liquidations (Jönköping, Kronoberg and Södermanland regions saw surges of around 20%). However, predominantly rural regions in Sweden, such as Västerbotten and Jämtland, also recorded higher numbers of bankruptcies than average (9.8% and 8.8% increase, respectively). In Finland, the impact was greater in Lapland (26.9%) and around Helsinki (Uusimaa, 25.9%) than in the central parts of the country. Åland also experienced a moderate rise in business bankruptcies in 2020 (4.0%), mostly related to the tourism sector.
- 2022 March
- Economy
- Nordic Region
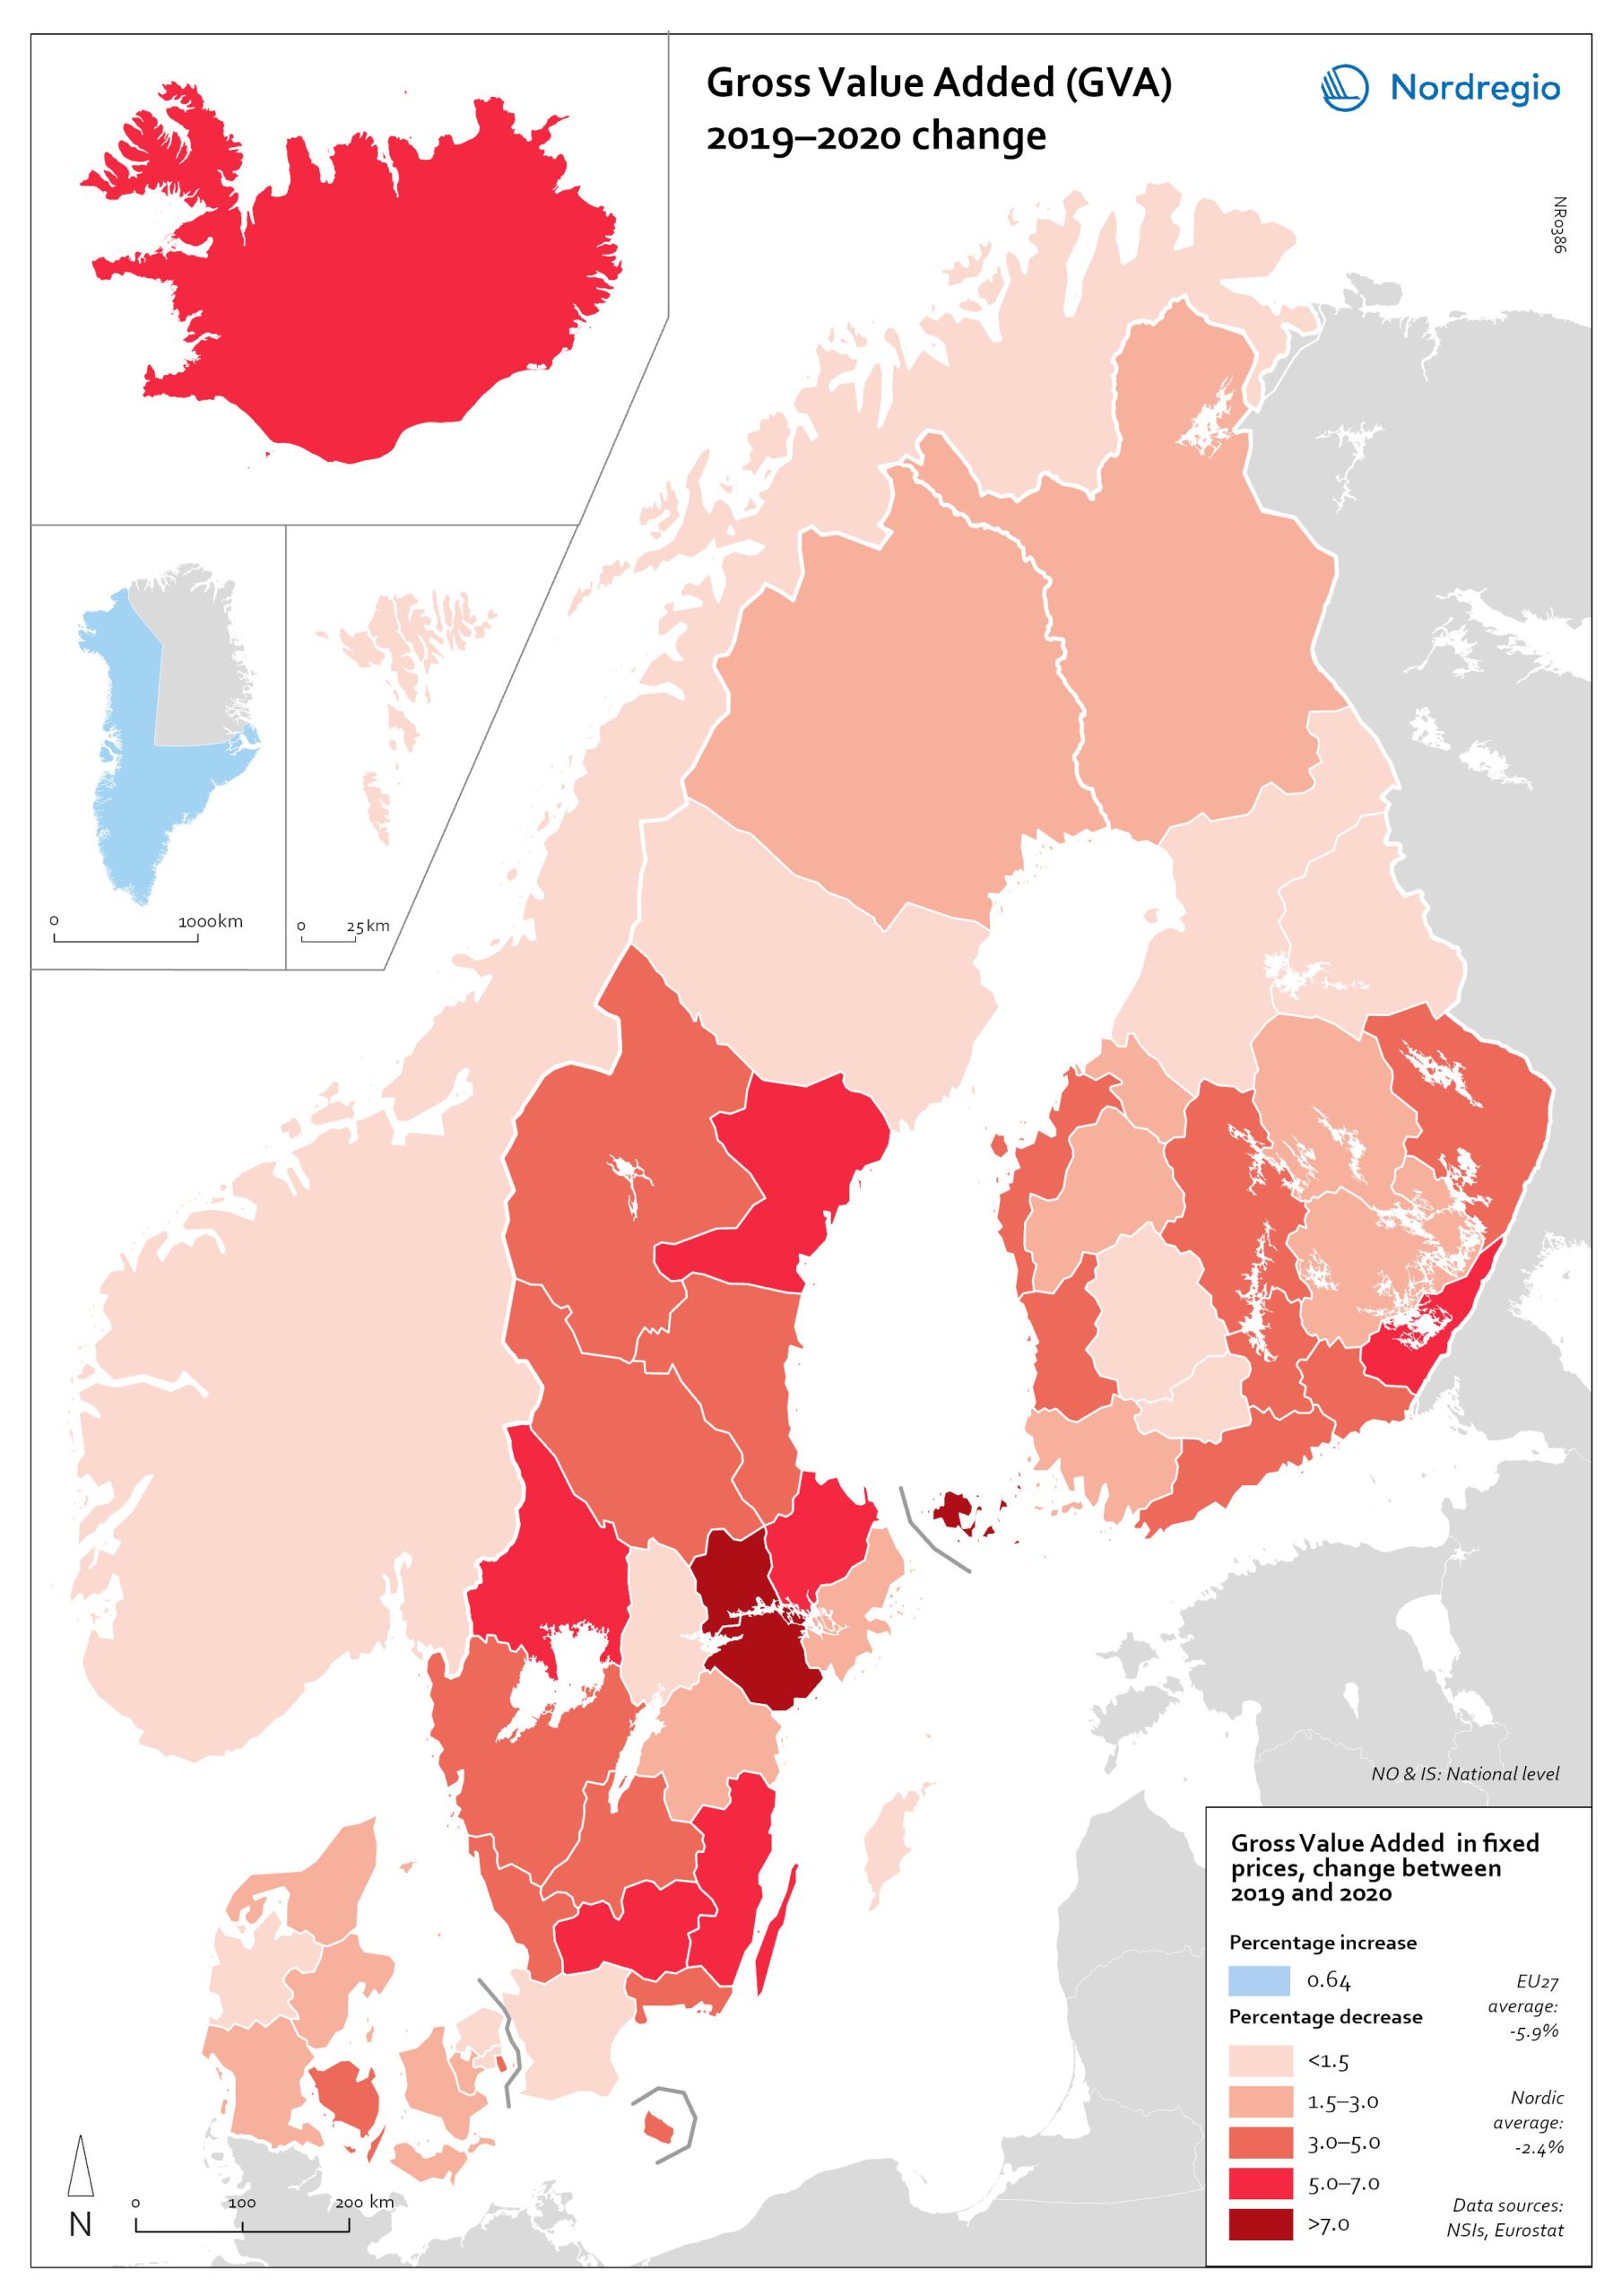
Gross Value Added (GVA) change 2019-2020
The map shows the change in regional Gross Value Added (GVA) from 2019 to 2020 (in fixed prices). As shown in the map, aggregated production levels, in terms of Gross Value Added (GVA), contracted in nearly all of the Nordic regions between 2019 and 2020. In general, the variability was comparatively smaller within each country than it was between countries, even when comparing regions with similar economic profiles from different countries. On average, the impact was greater on regions in Sweden and Finland than those in Denmark. Still, some relevant territorial patterns emerge from the changes to regional GVA shown in the map. The contraction was larger in regions with higher dependence on tourism services and hospitality (Åland and some municipalities in South Karelia, Finland, and Bornholm, Denmark), as well as on mass-market retail and logistics, particularly in the areas surrounding the capital regions (Södermanland and Västmanland in Sweden and Greater Copenhagen in Denmark). In Sweden and Finland, a remarkable regional divide can also be traced between territories specialised in transformation sectors with limited vulnerability to the impact of Covid-19, including forestry and specific types of processing (e.g. pulp, cement), like Nord Ostrobothnia, Kainuu and Pirkanmaa in Finland, and Gotland, Västerbotten and Örebro in Sweden. Aggregated output in these regions fell less than in regions with greater exposure to industrial manufacturing, like Kymenlaakso in Finland and Kronobergs in Sweden. Similarly, the impact on the financial centres in Denmark (Greater Copenhagen) and Sweden (Stockholm) was less than regions with mid-sized cities and diversified urban economies, like Vestjylland (Århus) in Denmark and Upsala in Sweden. Interestingly, the shock to the Finnish economy was greater in the Helsinki metropolitan area (-3.6% Uusimaa) than it was for the Tampere region (-0.5% in Pirkanmaa). This may be due to the relatively higher concentration…
- 2022 March
- Economy
- Nordic Region
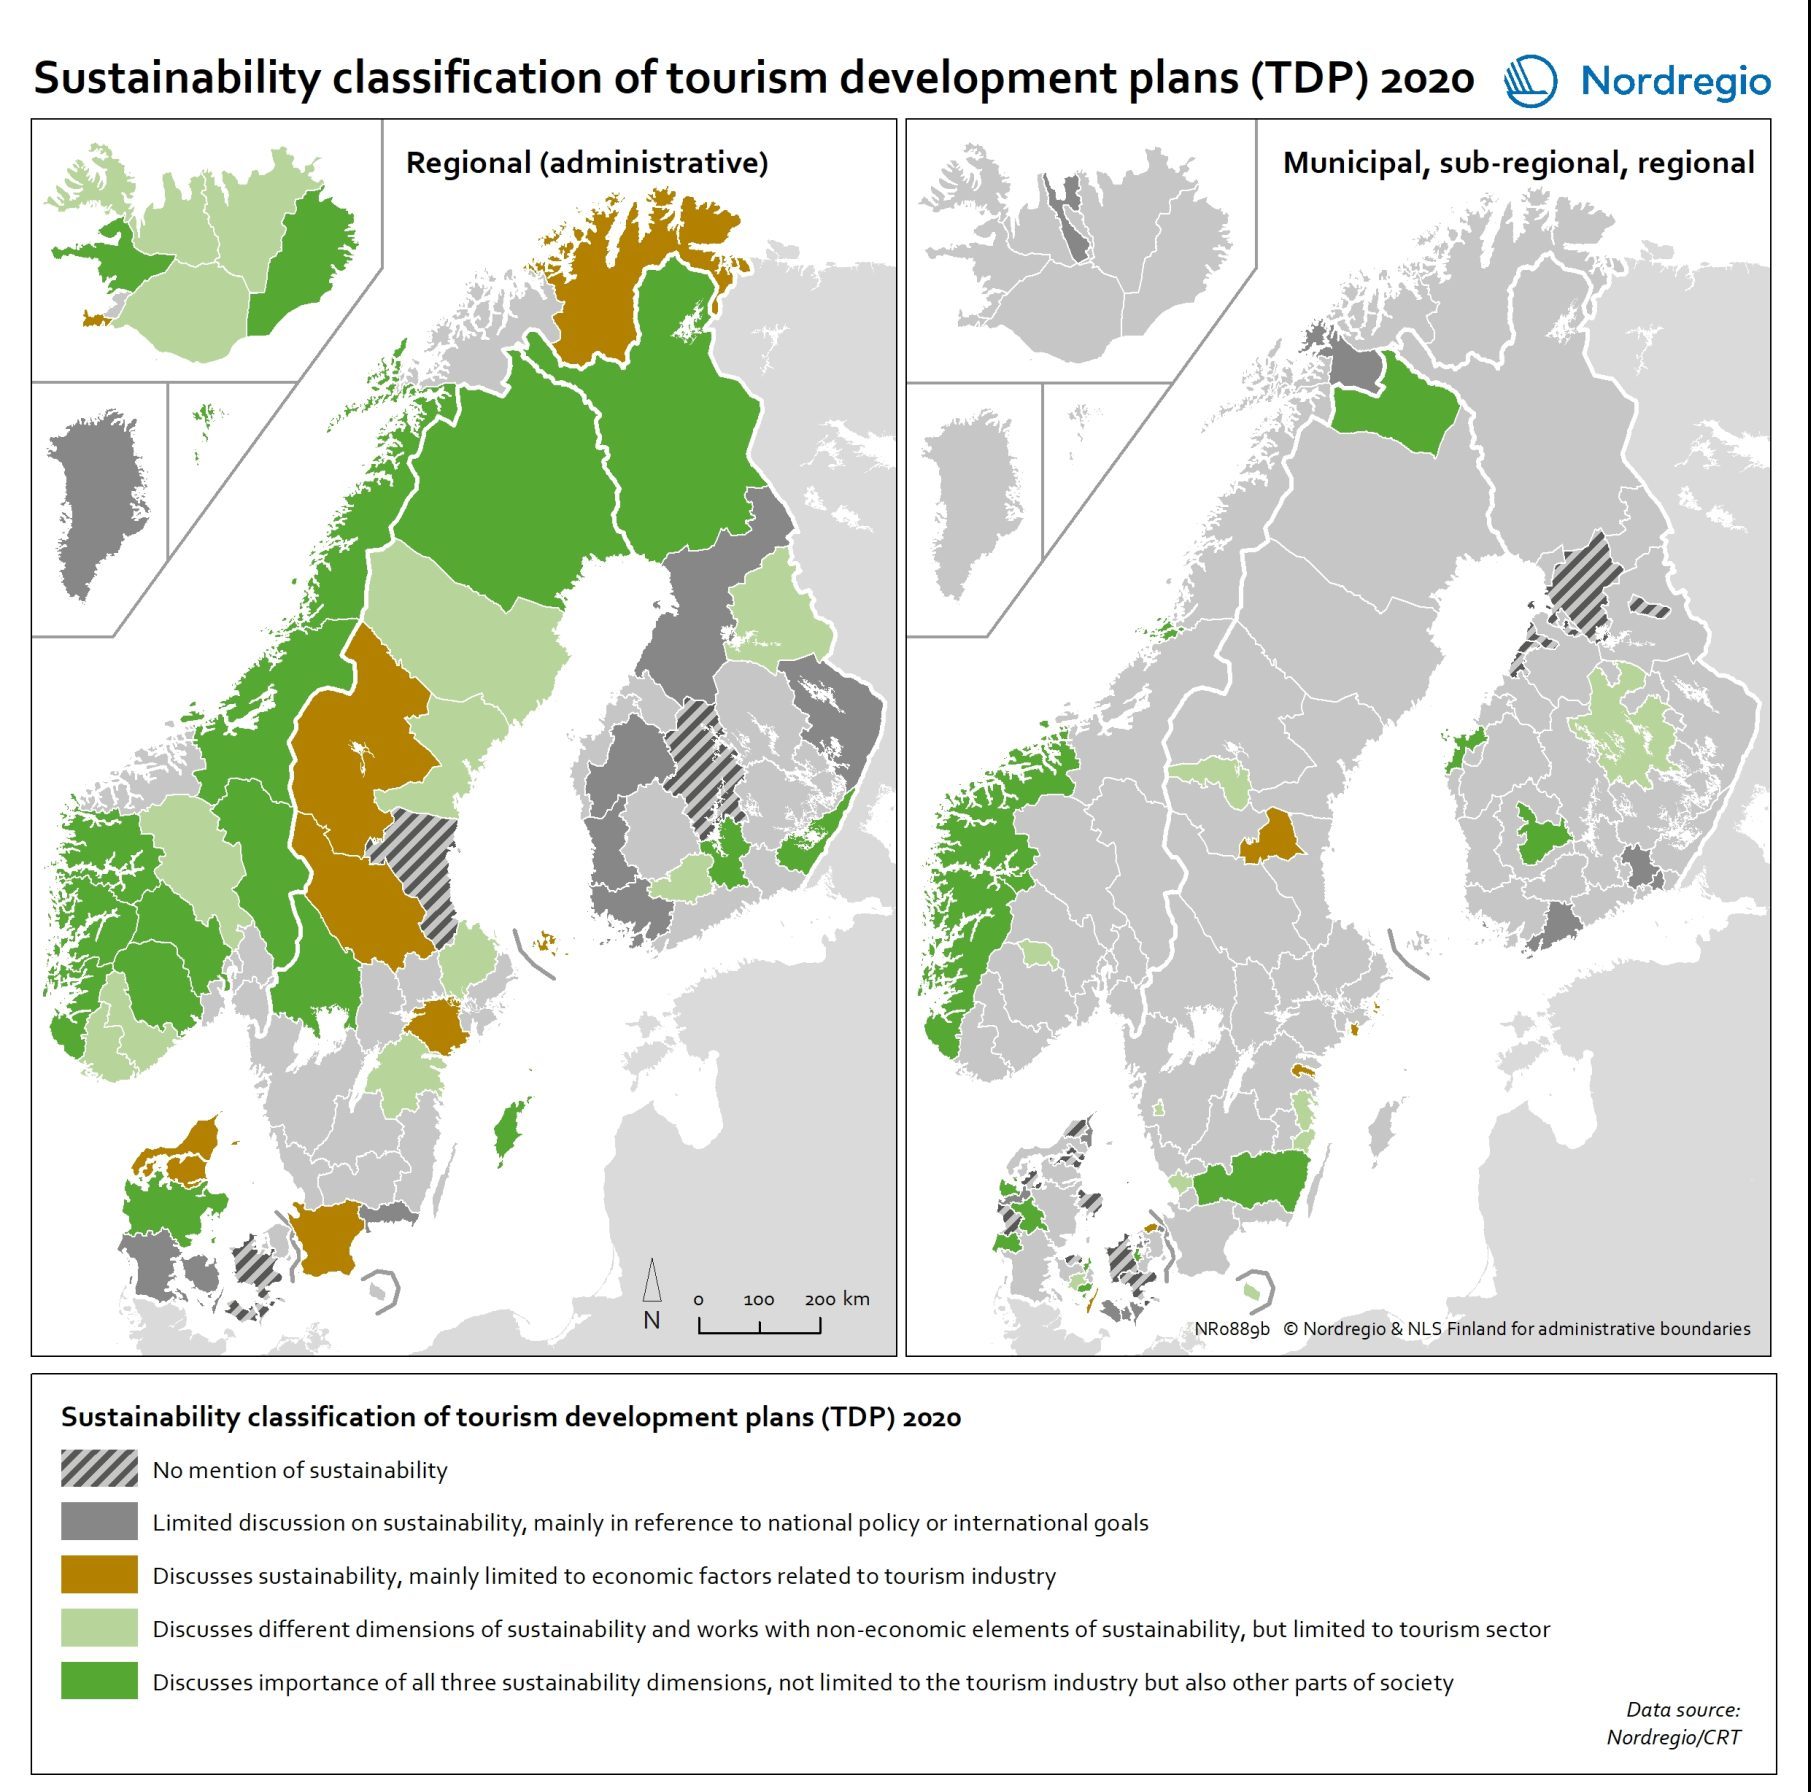
Sustainability classification of tourism development plans (TDPs)
This map indicates the distribution of different TDP sustainability concern treatment classes in the Nordic Region in 2020 Sustainability is seen as an important part of the tourism development in large parts of the Nordic rural regions, at least on paper. Some tourism policies even state it as the point of departure, the light that guides the way in everything that tourism involves. A growing public awareness of the need to transition to more sustainable practices, increased public pressure, along with political statements and commitments to do so, means that we should expect to find sustainability concerns and the SDGs strongly reflected in sub-national plans for tourism development, too. In this map, the dotted areas represent those TDPs that do not mention sustainability in any way. These mainly come from Denmark, as well as a few from Finland, Norway, and Sweden. The grey areas represent TDPs who mention the concept of sustainability, but in a very limited way, as a reference to an overall, global or international or national agenda, but without further operationalising or setting any goals regarding this for the local context. This type of treatment of sustainability concerns is mainly present in Finland, followed by Denmark and Sweden, plus a few cases from Norway and Iceland. Together, these two types represent almost two out of every five TDPs. They greyish green areas represent those TDPs which limit their discussion of sustainability to the economic sustainability of tourism businesses. This type of TDP is mainly found in Sweden, followed by Denmark, and then a case from each from Finland, Norway and Iceland. The green areas, which represent just under half of the TDPs, engage in a holistic treatment of sustainability concerns, including their economic, social and environmental aspects. The light green TDPs, with a tourism-centred sustainability treatment, come…
- 2021 December
- Nordic Region
- Tourism

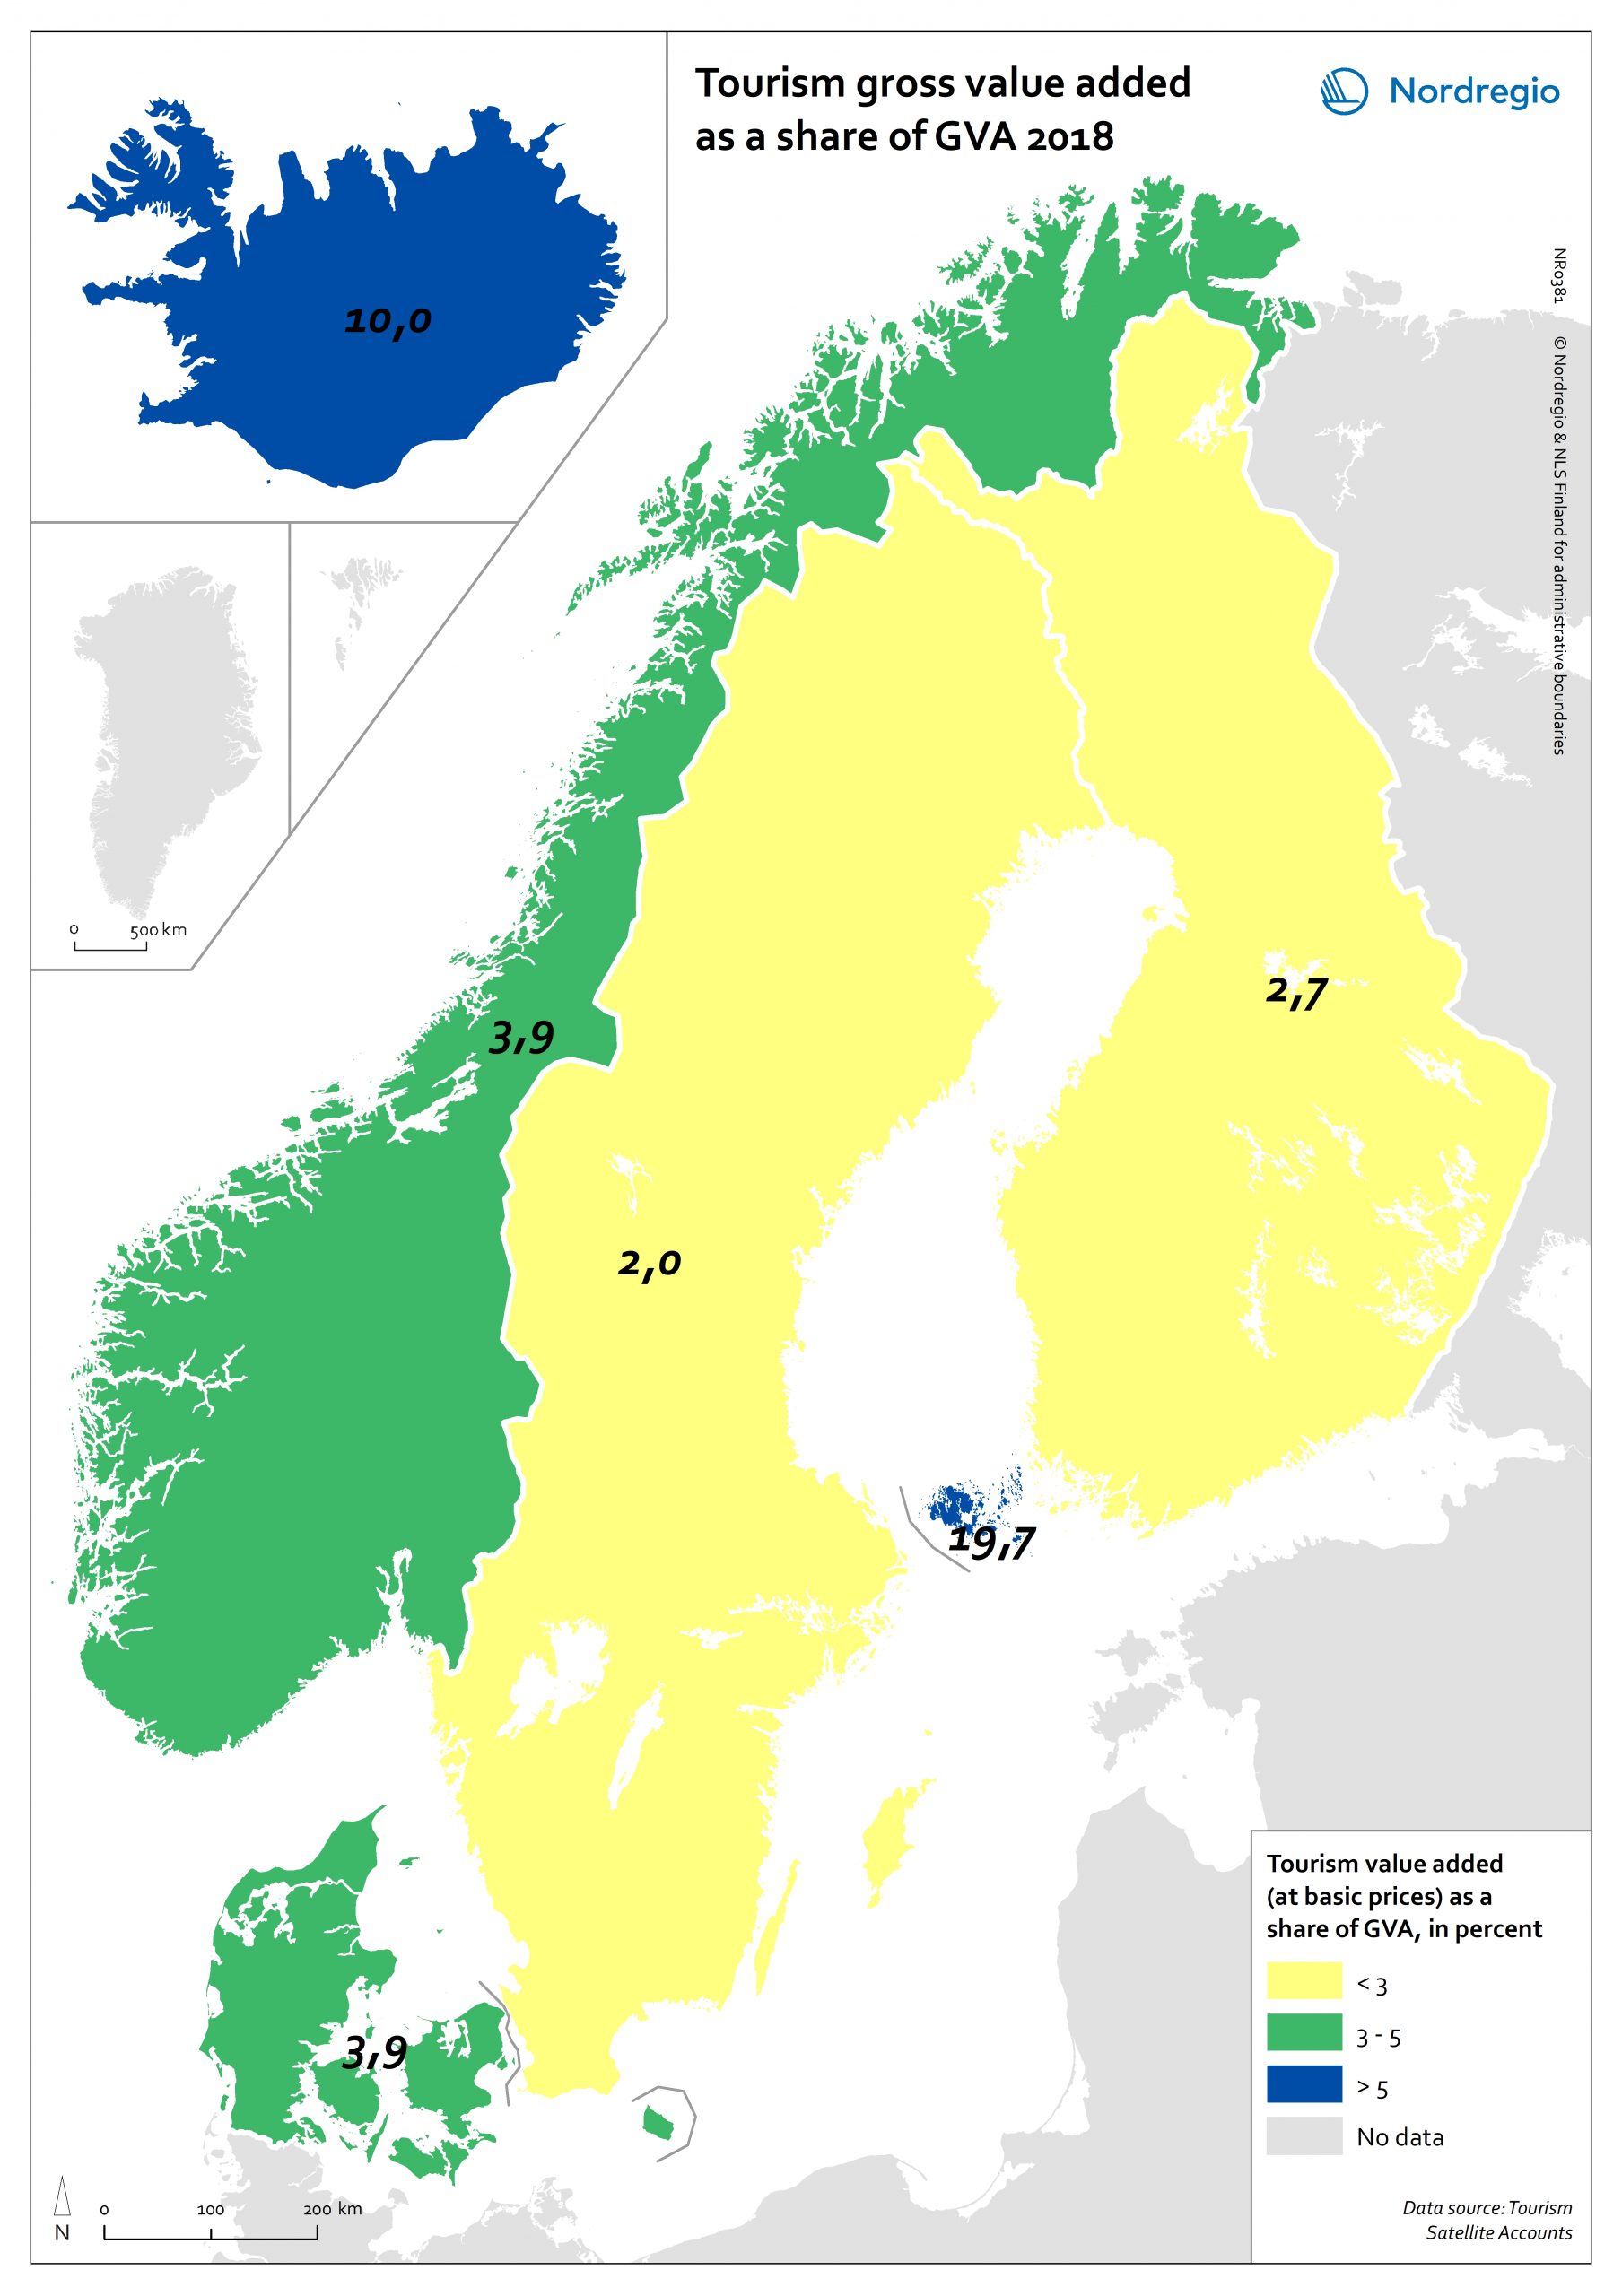
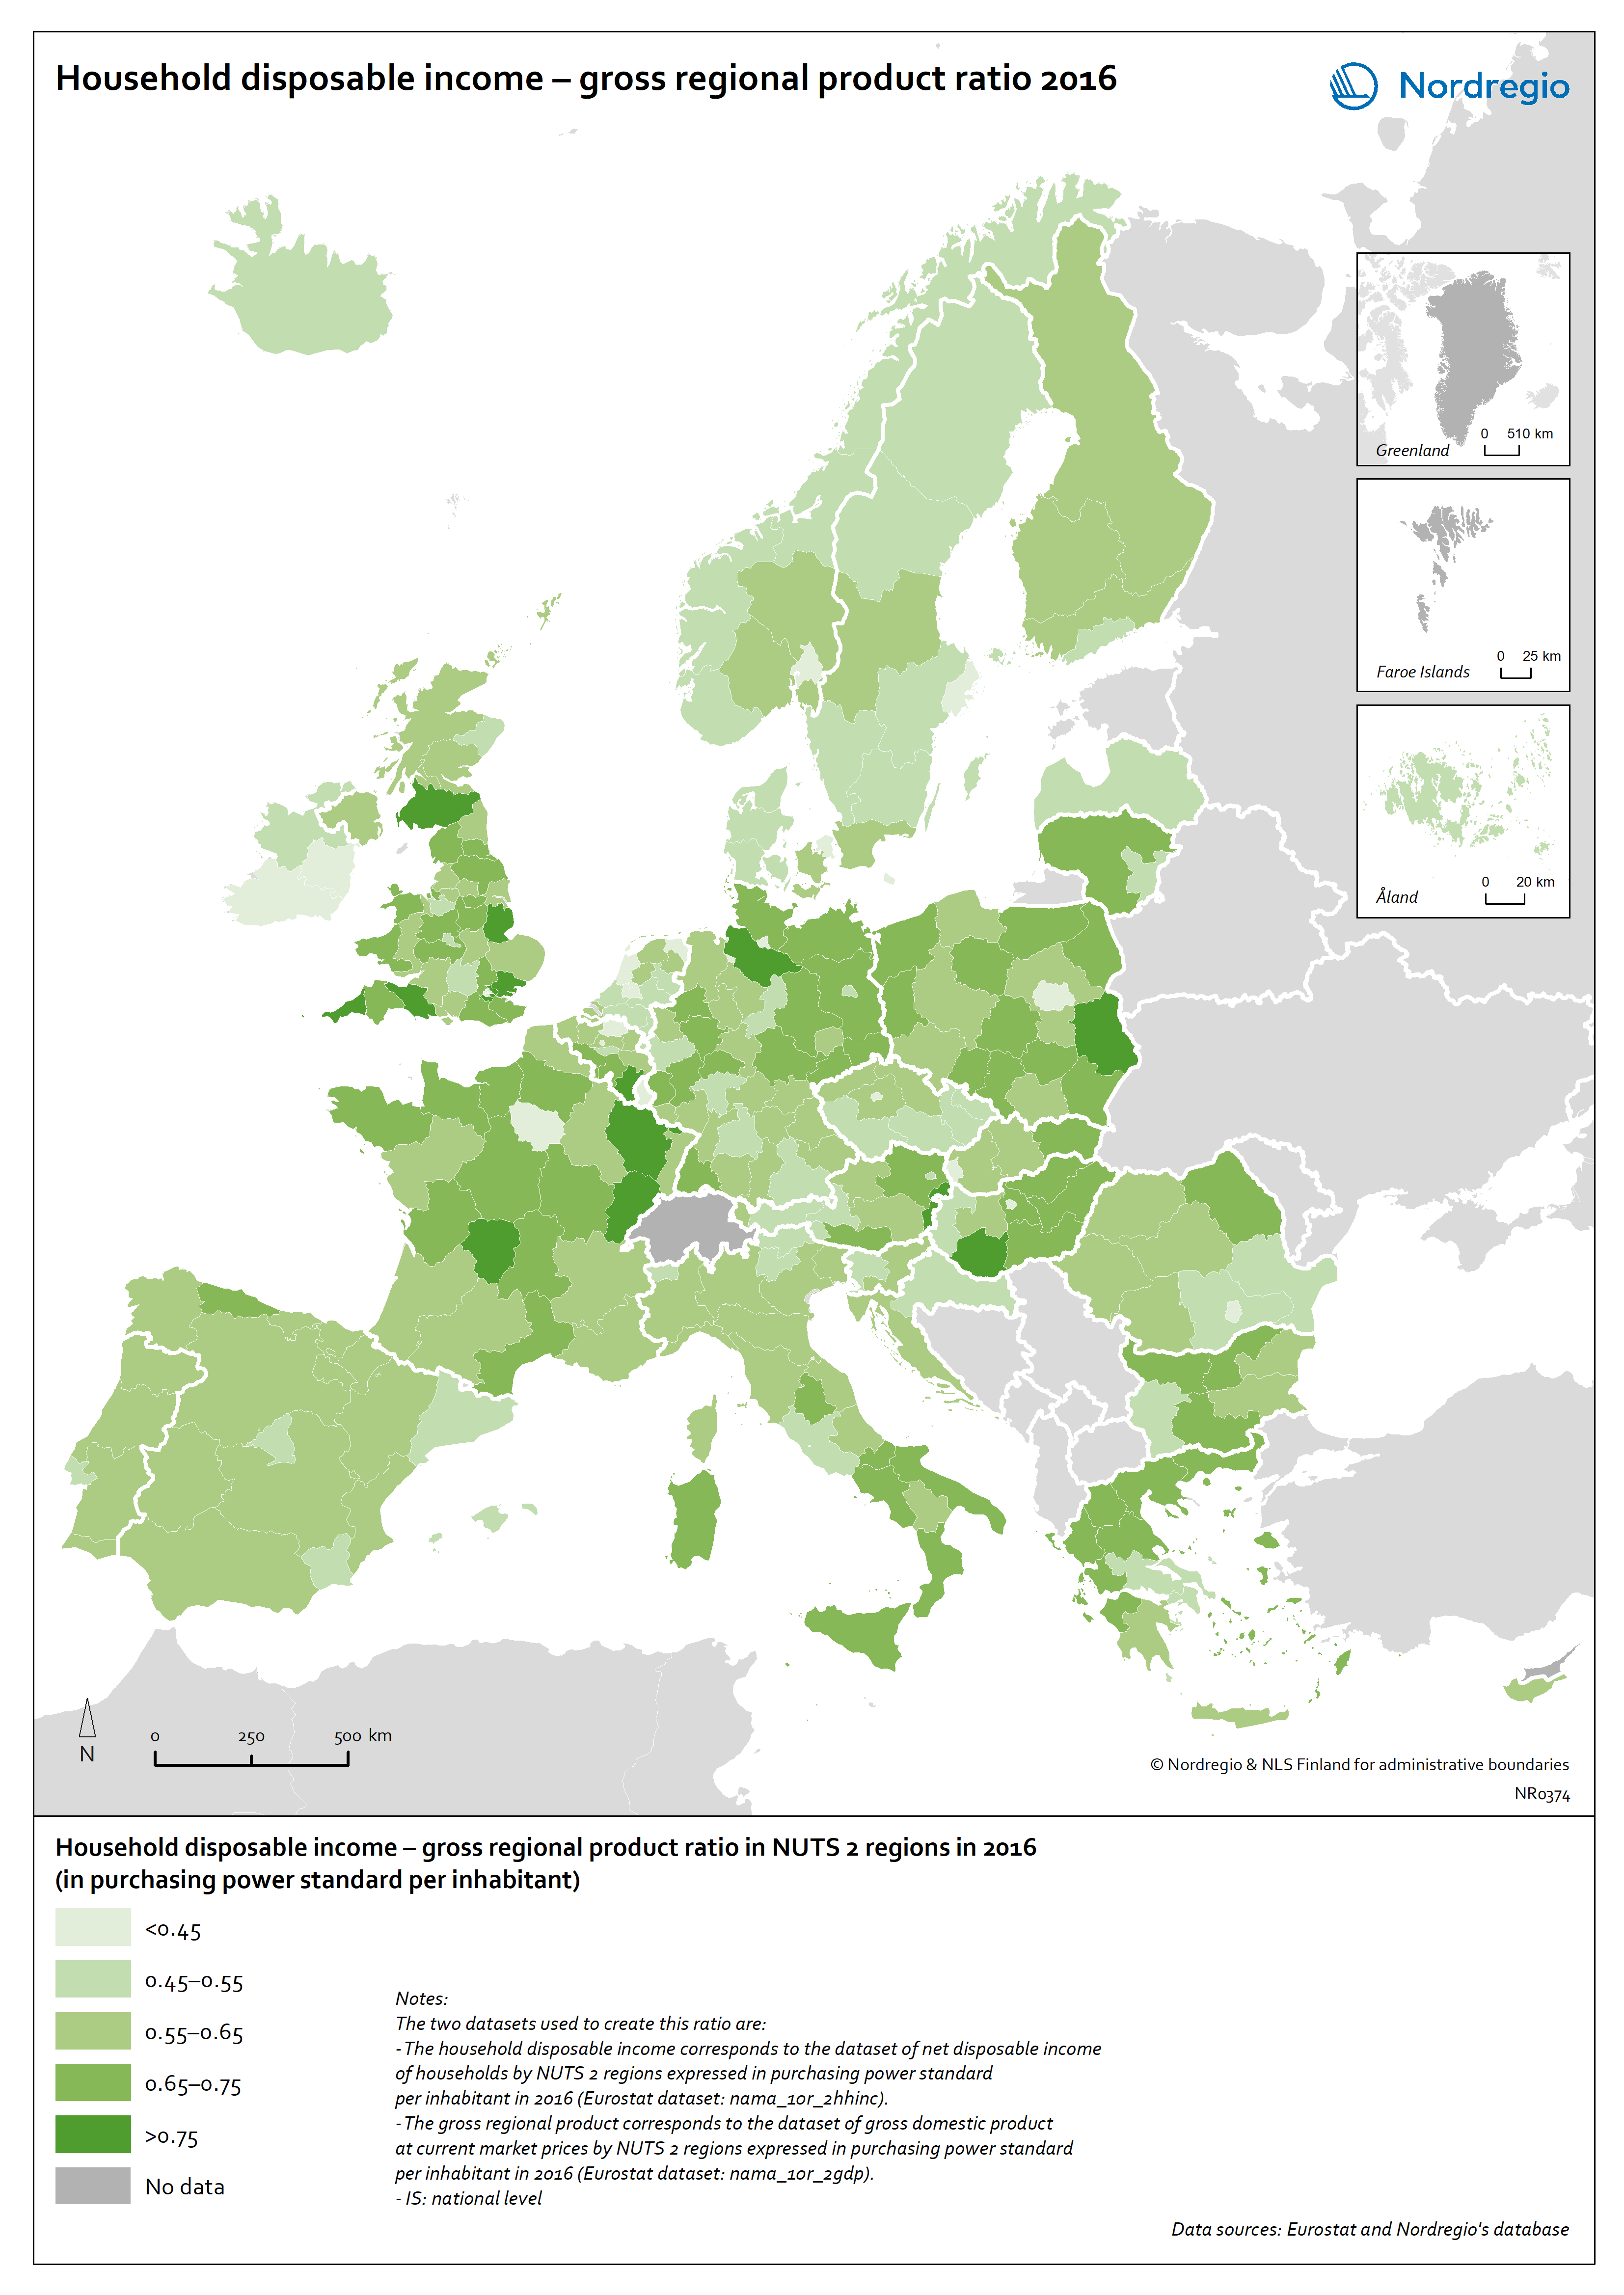
Tourism gross value added as a share of GVA 2018
Tourism gross added value (GVA) corresponds to the part of GVA generated by all industries in contact with visitors. This indicator is measured as a percentage of total GVA at basic prices in 2018 (No data for Greenland and Faroe Islands; data for Finland includes Åland). Data were retrieved from each country’s tourism satellite account. Åland and Iceland stand out as the country or territory where tourism added value accounts for over 10% of the total GVA. For Åland, tourism is so important an industry that added value related to tourism is equivalent to nearly 20% of the total GVA in Åland. The share of tourism related GVA is close to 4% of the total GVA in Norway and Denmark, and lower than 3% in Finland and Sweden.
- 2021 February
- Economy
- Nordic Region
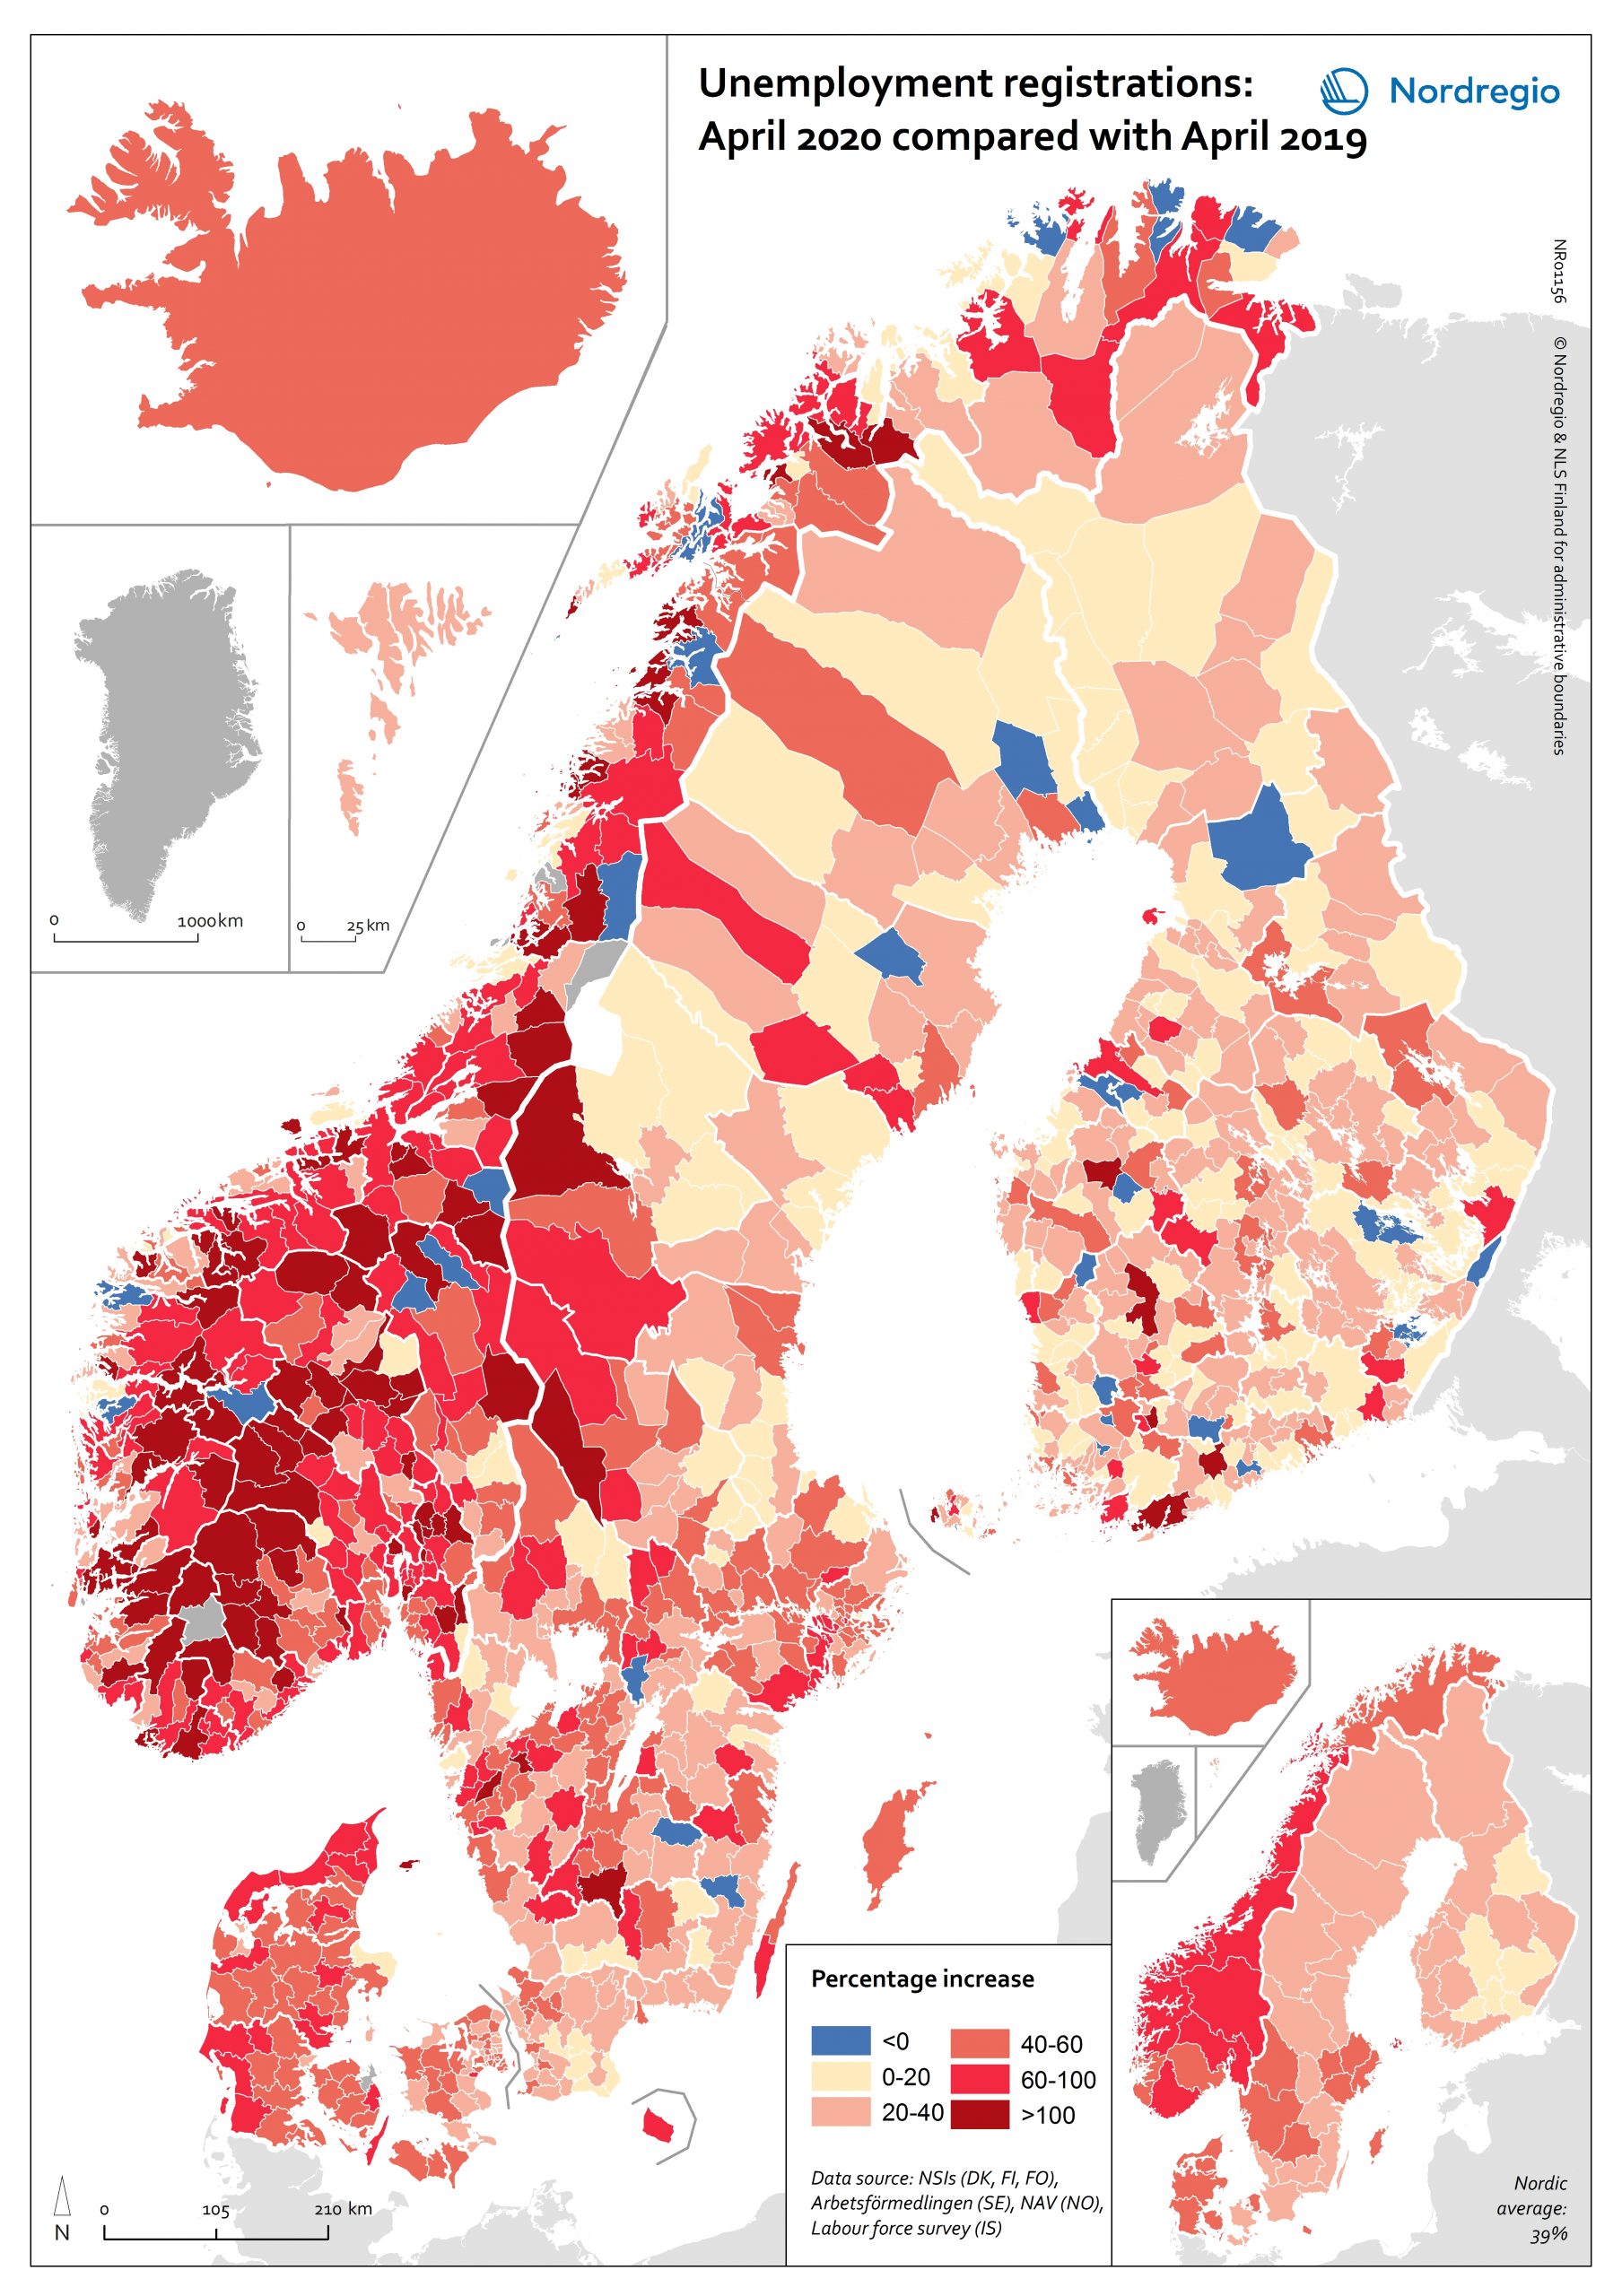
Labour market impacts of COVID-19
On May 17, 2020, 94% of the world’s workers were living in countries with some form of workplace closure measures in place (ILO, 2020). While it is too early to make predictions about the long-term consequences of this, it is possible to make some observations about the short-term labour market impacts in the Nordic Region. The map shows the number of people who registered as unemployed in April 2020 compared with the number of people who registered as unemployed in April 2019 at the municipal level for Denmark, Finland, Norway and Sweden and Åland Islands and at the national/territory level for Iceland and the Faroe Islands. The shading represents the increase in percent, with darker colours showing higher relative increases compared to the previous year and lighter colours lower relative increases. Municipalities shaded in blue on the map did not experience an increase in unemployment registrations in April 2020 compared to April 2019. Overall, the number of unemployment registrations across the Region was 38.9% higher in April 2020 than in April 2019. This increase equates to a total of 220 354 Nordic workers and has affected almost all Nordic municipalities and regions to some degree. Proportionally speaking, Norway saw the largest increase (69%), followed by Iceland (59%), Denmark (48%), Sweden (41%), and Finland (24%). Though between-municipality variation is evident, the greatest differences appears to be between countries. Interestingly, many Swedish municipalities along the southern coast between Sweden and Norway saw increases more consistent with the overall trend observed in Norway. This may be a reflection of the prevalence of cross-border commuting in these regions. It is important to note that the labour market situation in April 2019 has some baring on the results shown on the map. For example, the appearance of a sharper relative increase in Norway is primarily…
- 2020 October
- Economy
- Labour force
- Nordic Region
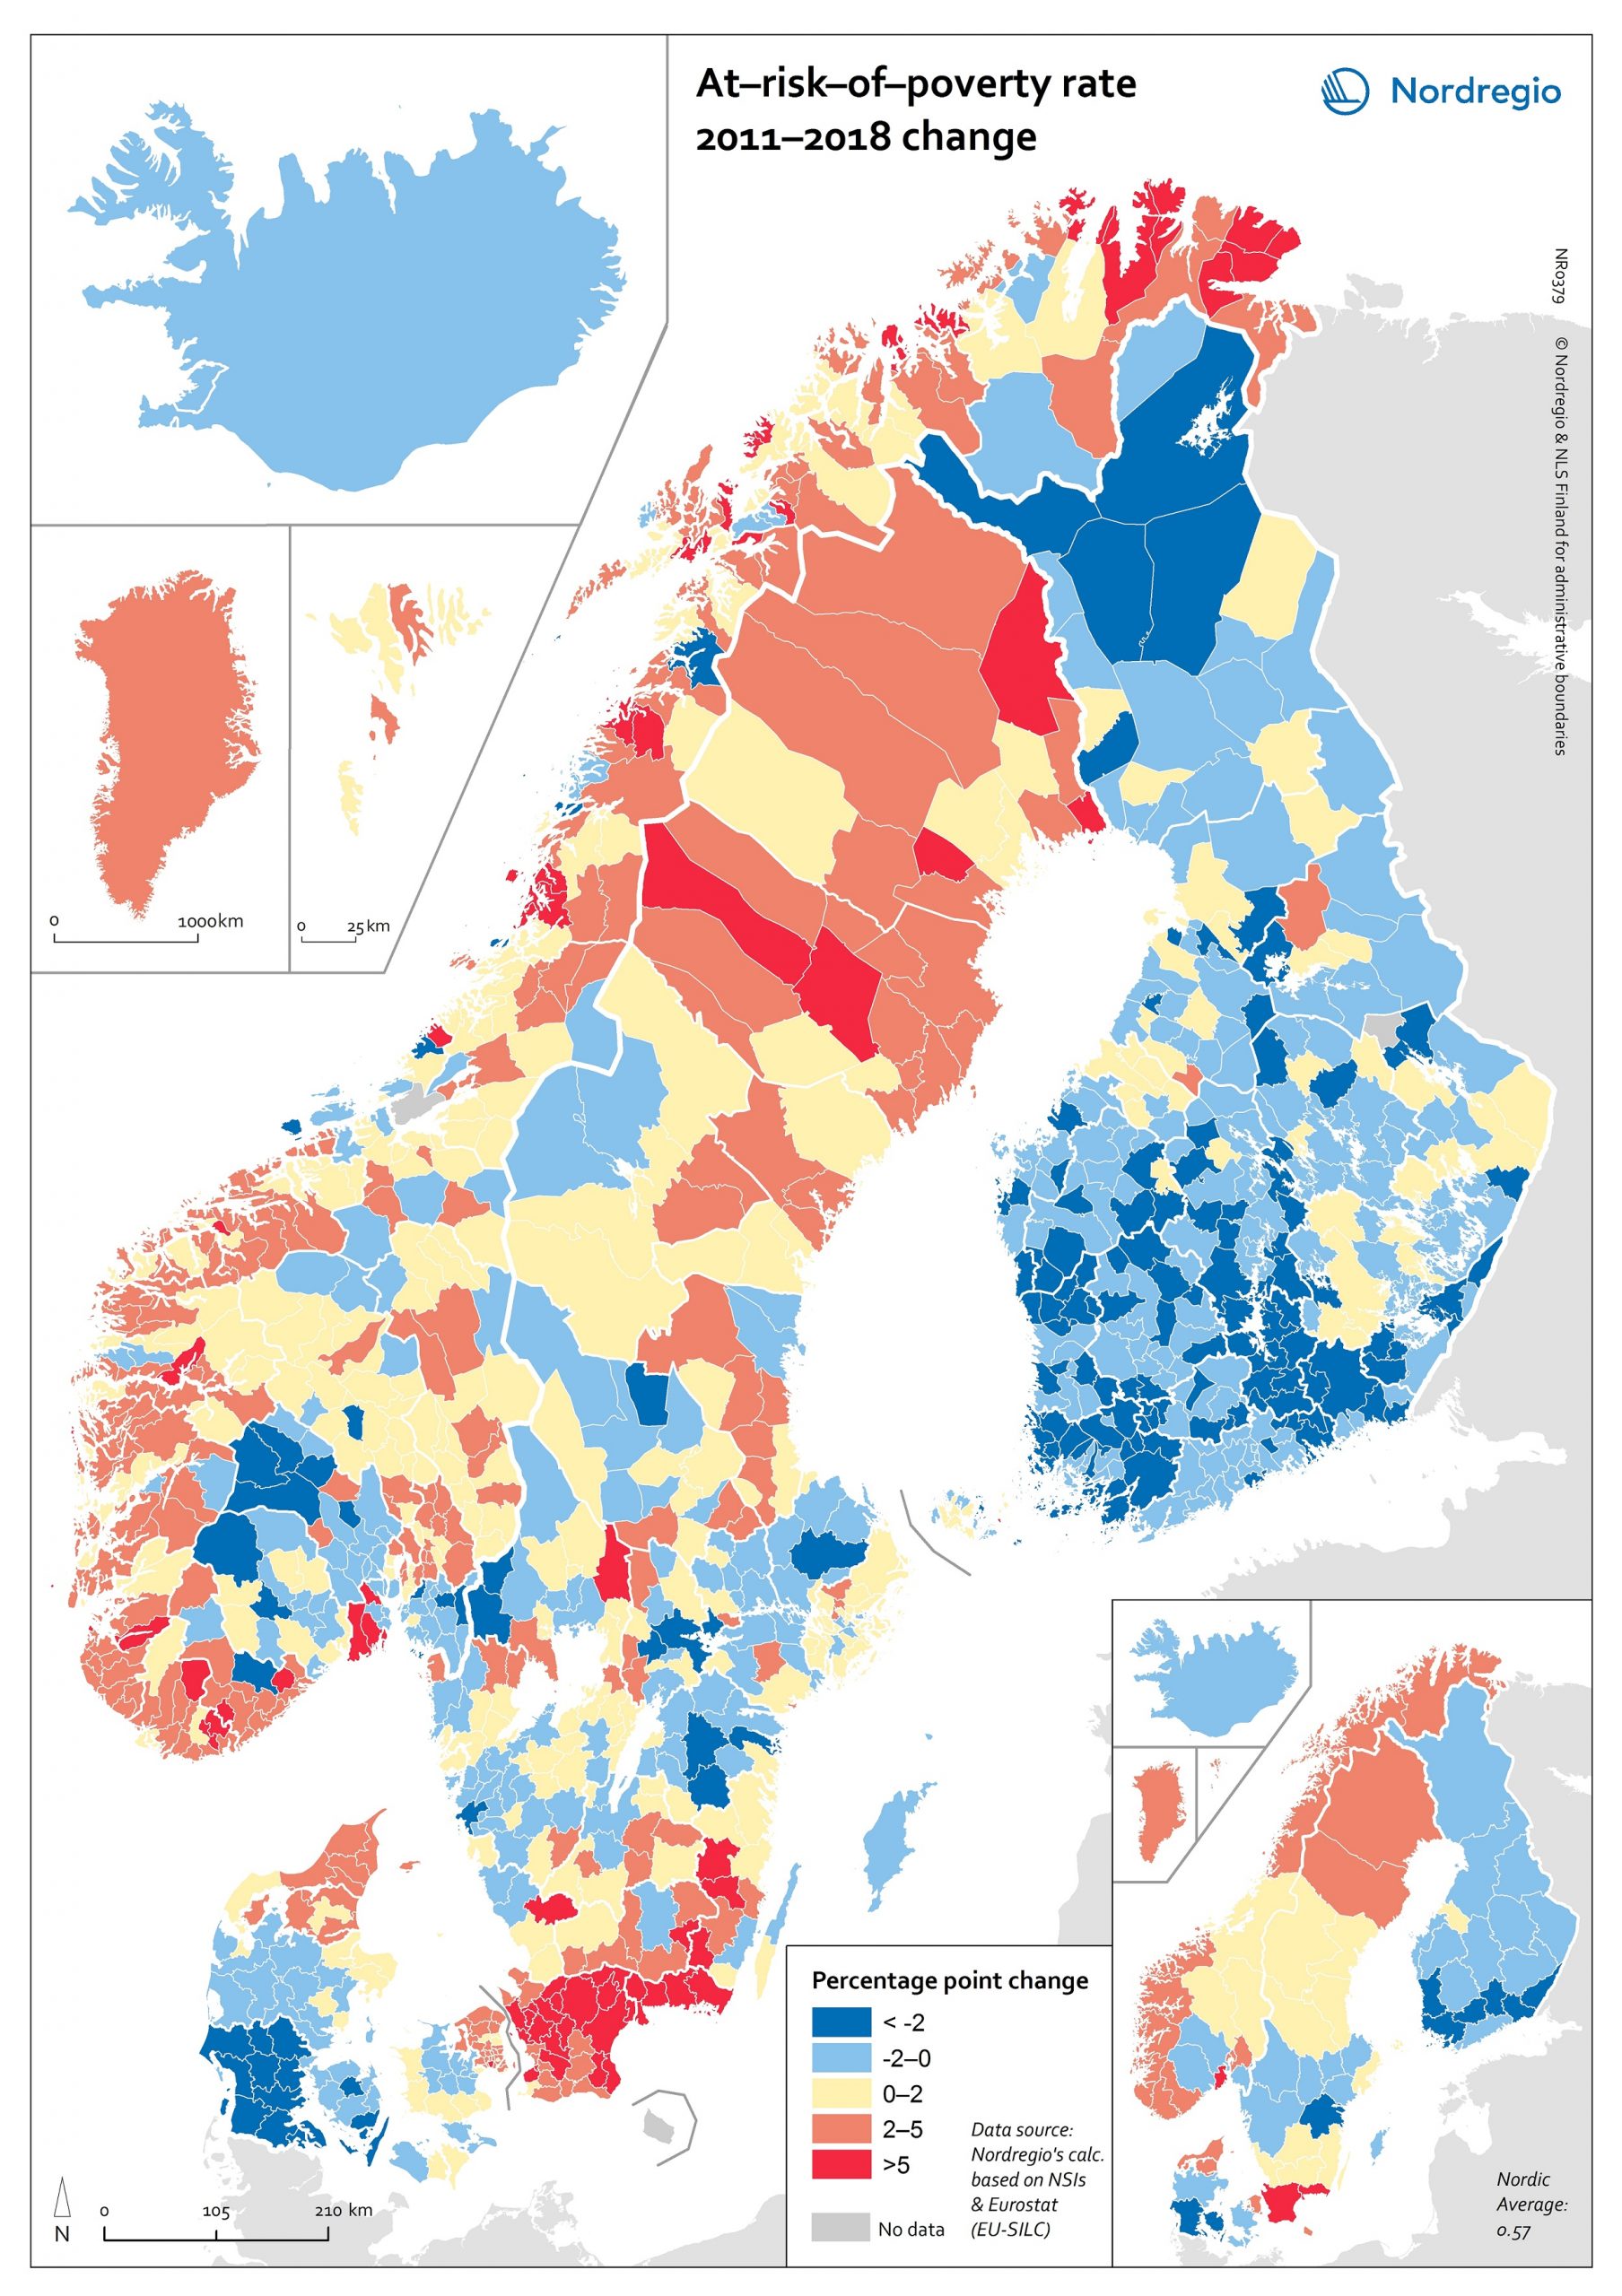
At-risk-of-poverty rate 2011-2018 change
The map shows the “at-risk-of-poverty” (AROP) rate in the Nordic Region. For the period from 2004 to 2018, the AROP rate increased in all Nordic countries except Iceland. This trend was strongest in Sweden. In Finland the AROP rate has been decreasing during the past few years, in line with what has previously been indicated – namely, on account of economic turmoil. This points to one of the weaknesses of using the AROP rate alongside several other measures of inequality. That is, while people have become poorer due to the economic crisis, the at-risk-of-poverty rate has paradoxically gone down. In addition, the AROP rate for Finland is higher in 2018 than it was in 2004. Looking at these trends on a regional level over a period of time (between 2011 and 2018), we can see that the AROP rate has decreased in almost all areas of Finland, whereas the pattern is rath er more varied in the other Nordic countries (we can also see a cohesive area in the south of Denmark where the AROP rate has decreased.) Again, Sweden has the most regions displaying increases in the AROP rate. Finland and Sweden contain the largest differences between the regions with the highest and lowest AROP rate. Hence the greatest regional differences are to be found in Sweden and Finland. Sweden also has the highest average AROP rate. About the At-risk-of-poverty The at-risk-of-poverty rate is a common measure of relative poverty and social inclusion. Most notably, it has been used for monitoring the EU2020 goal of inclusive growth. The at-risk-of-poverty rate is normally defined as “the share of people with an equivalised disposable income (after social transfer) below the at-risk-of-poverty threshold, which is set at 60% of the national median equivalised disposable income after social transfer.” (Eurostat). The indicator is…
- 2020 October
- Demography
- Economy
- Nordic Region
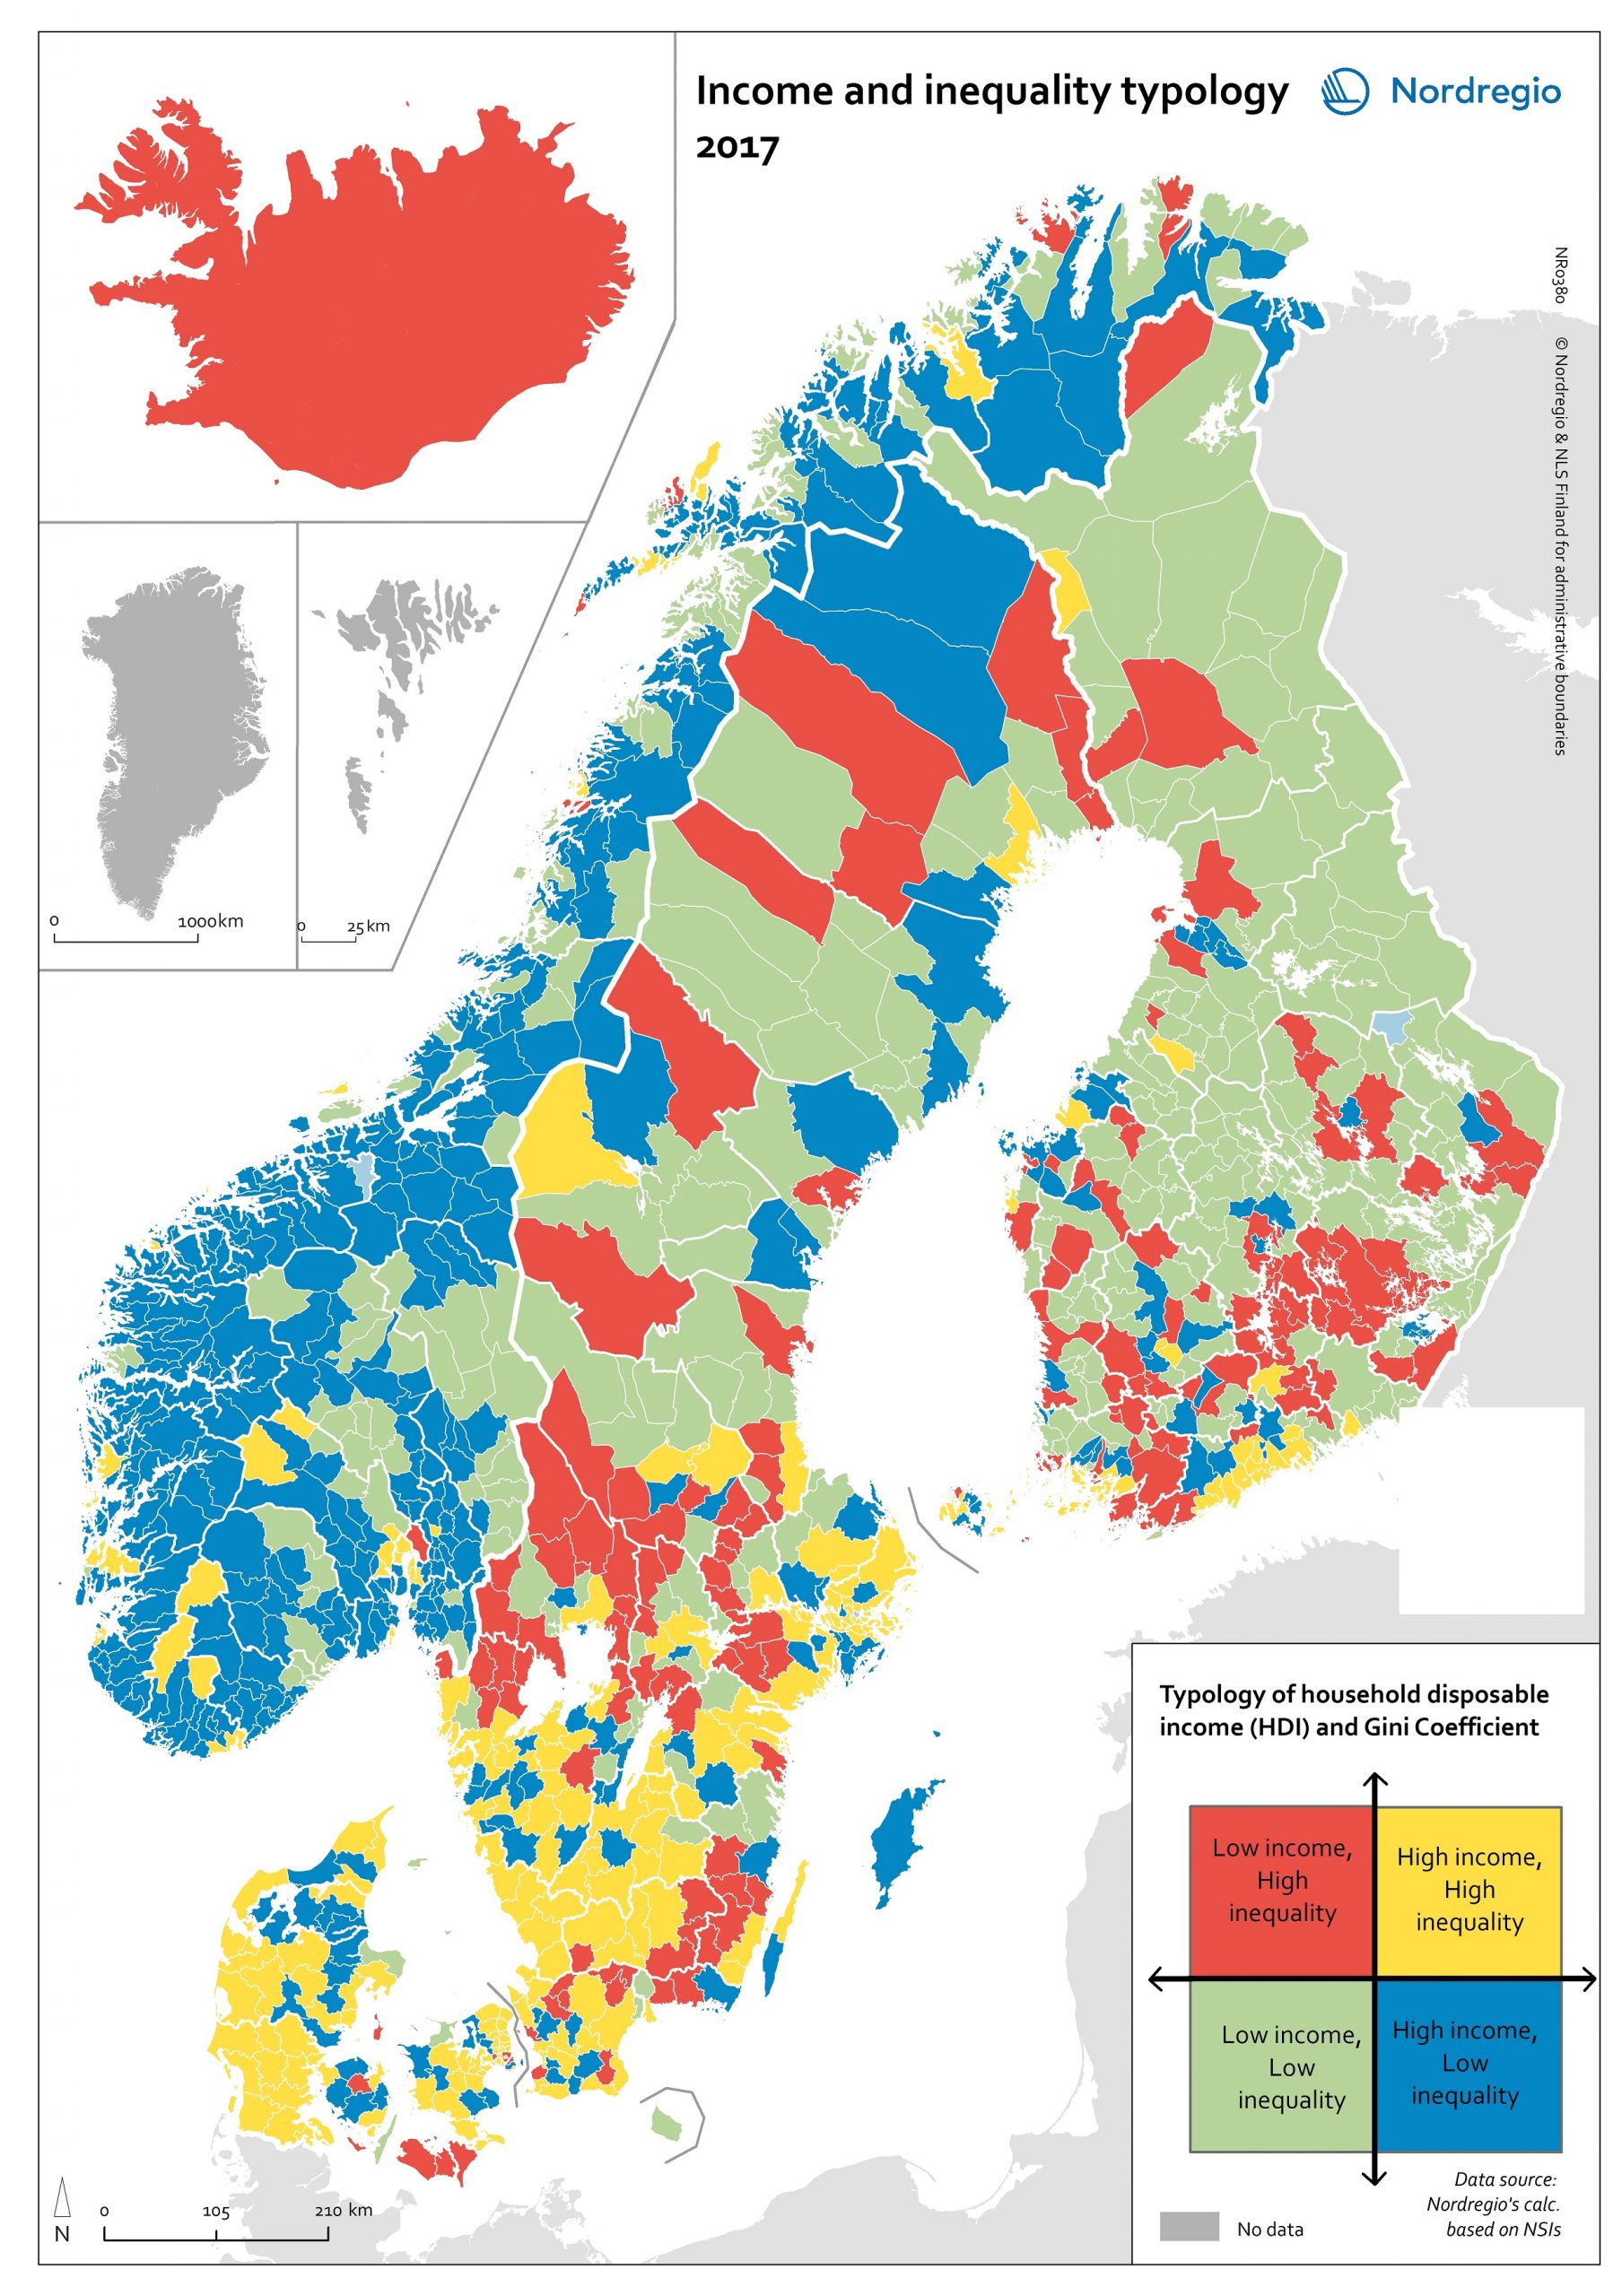
Income and inequality typology 2017
The map shows a typology, combining two indicators to display income disparities between and within municipalities. The map combines measurements of household disposable income (HDI) and the Gini Index to create four “types” of income distribution. Household disposable income is a common measure of income inequality. It measures the capacity of households (or individuals) to provide themselves with consumable goods or services. Comparing average HDIs is a convenient way of understanding inequality between municipalities. The Gini Index measures the extent to which the distribution of household income deviates from an equal distribution level. The Gini Index is therefore useful in understanding the inequality that exists within municipalities. Combining these measurements provides a comprehensive geographic overview of income in equality across the Nordic Region, both within and between municipalities. The municipalities shaded in yellow on the map have an average HDI above the Nordic average, as well as a Gini coefficient above the Nordic average (i.e. high income, but unevenly distributed). This category includes most of the wealthiest municipalities, including municipalities in the capital regions – e.g. most municipalities in the Stockholm Region (Lidingö, Danderyd, Ekerö, Täby, Sollentuna), Copenhagen (Gentofte, Hørsholm, etc.), and Helsinki (Kauniainen). Several municipalities in southern Sweden and Denmark also fall into this category. Most of these have average HDIs just above the Nordic average. The second category (blue on the map) consists of municipalities with HDI above the Nordic average and a Gini coefficient below the Nordic average (i.e. high income and even distribution). Most municipalities in this category are in Norway. Norway has a higher HDI and more even distribution than the other Nordic countries. The third category (green on the map) consists of municipalities with both an HDI and a Gini coefficient below the Nordic average (i.e. lower income, but more evenly distributed). This category…
- 2020 October
- Economy
- Nordic Region
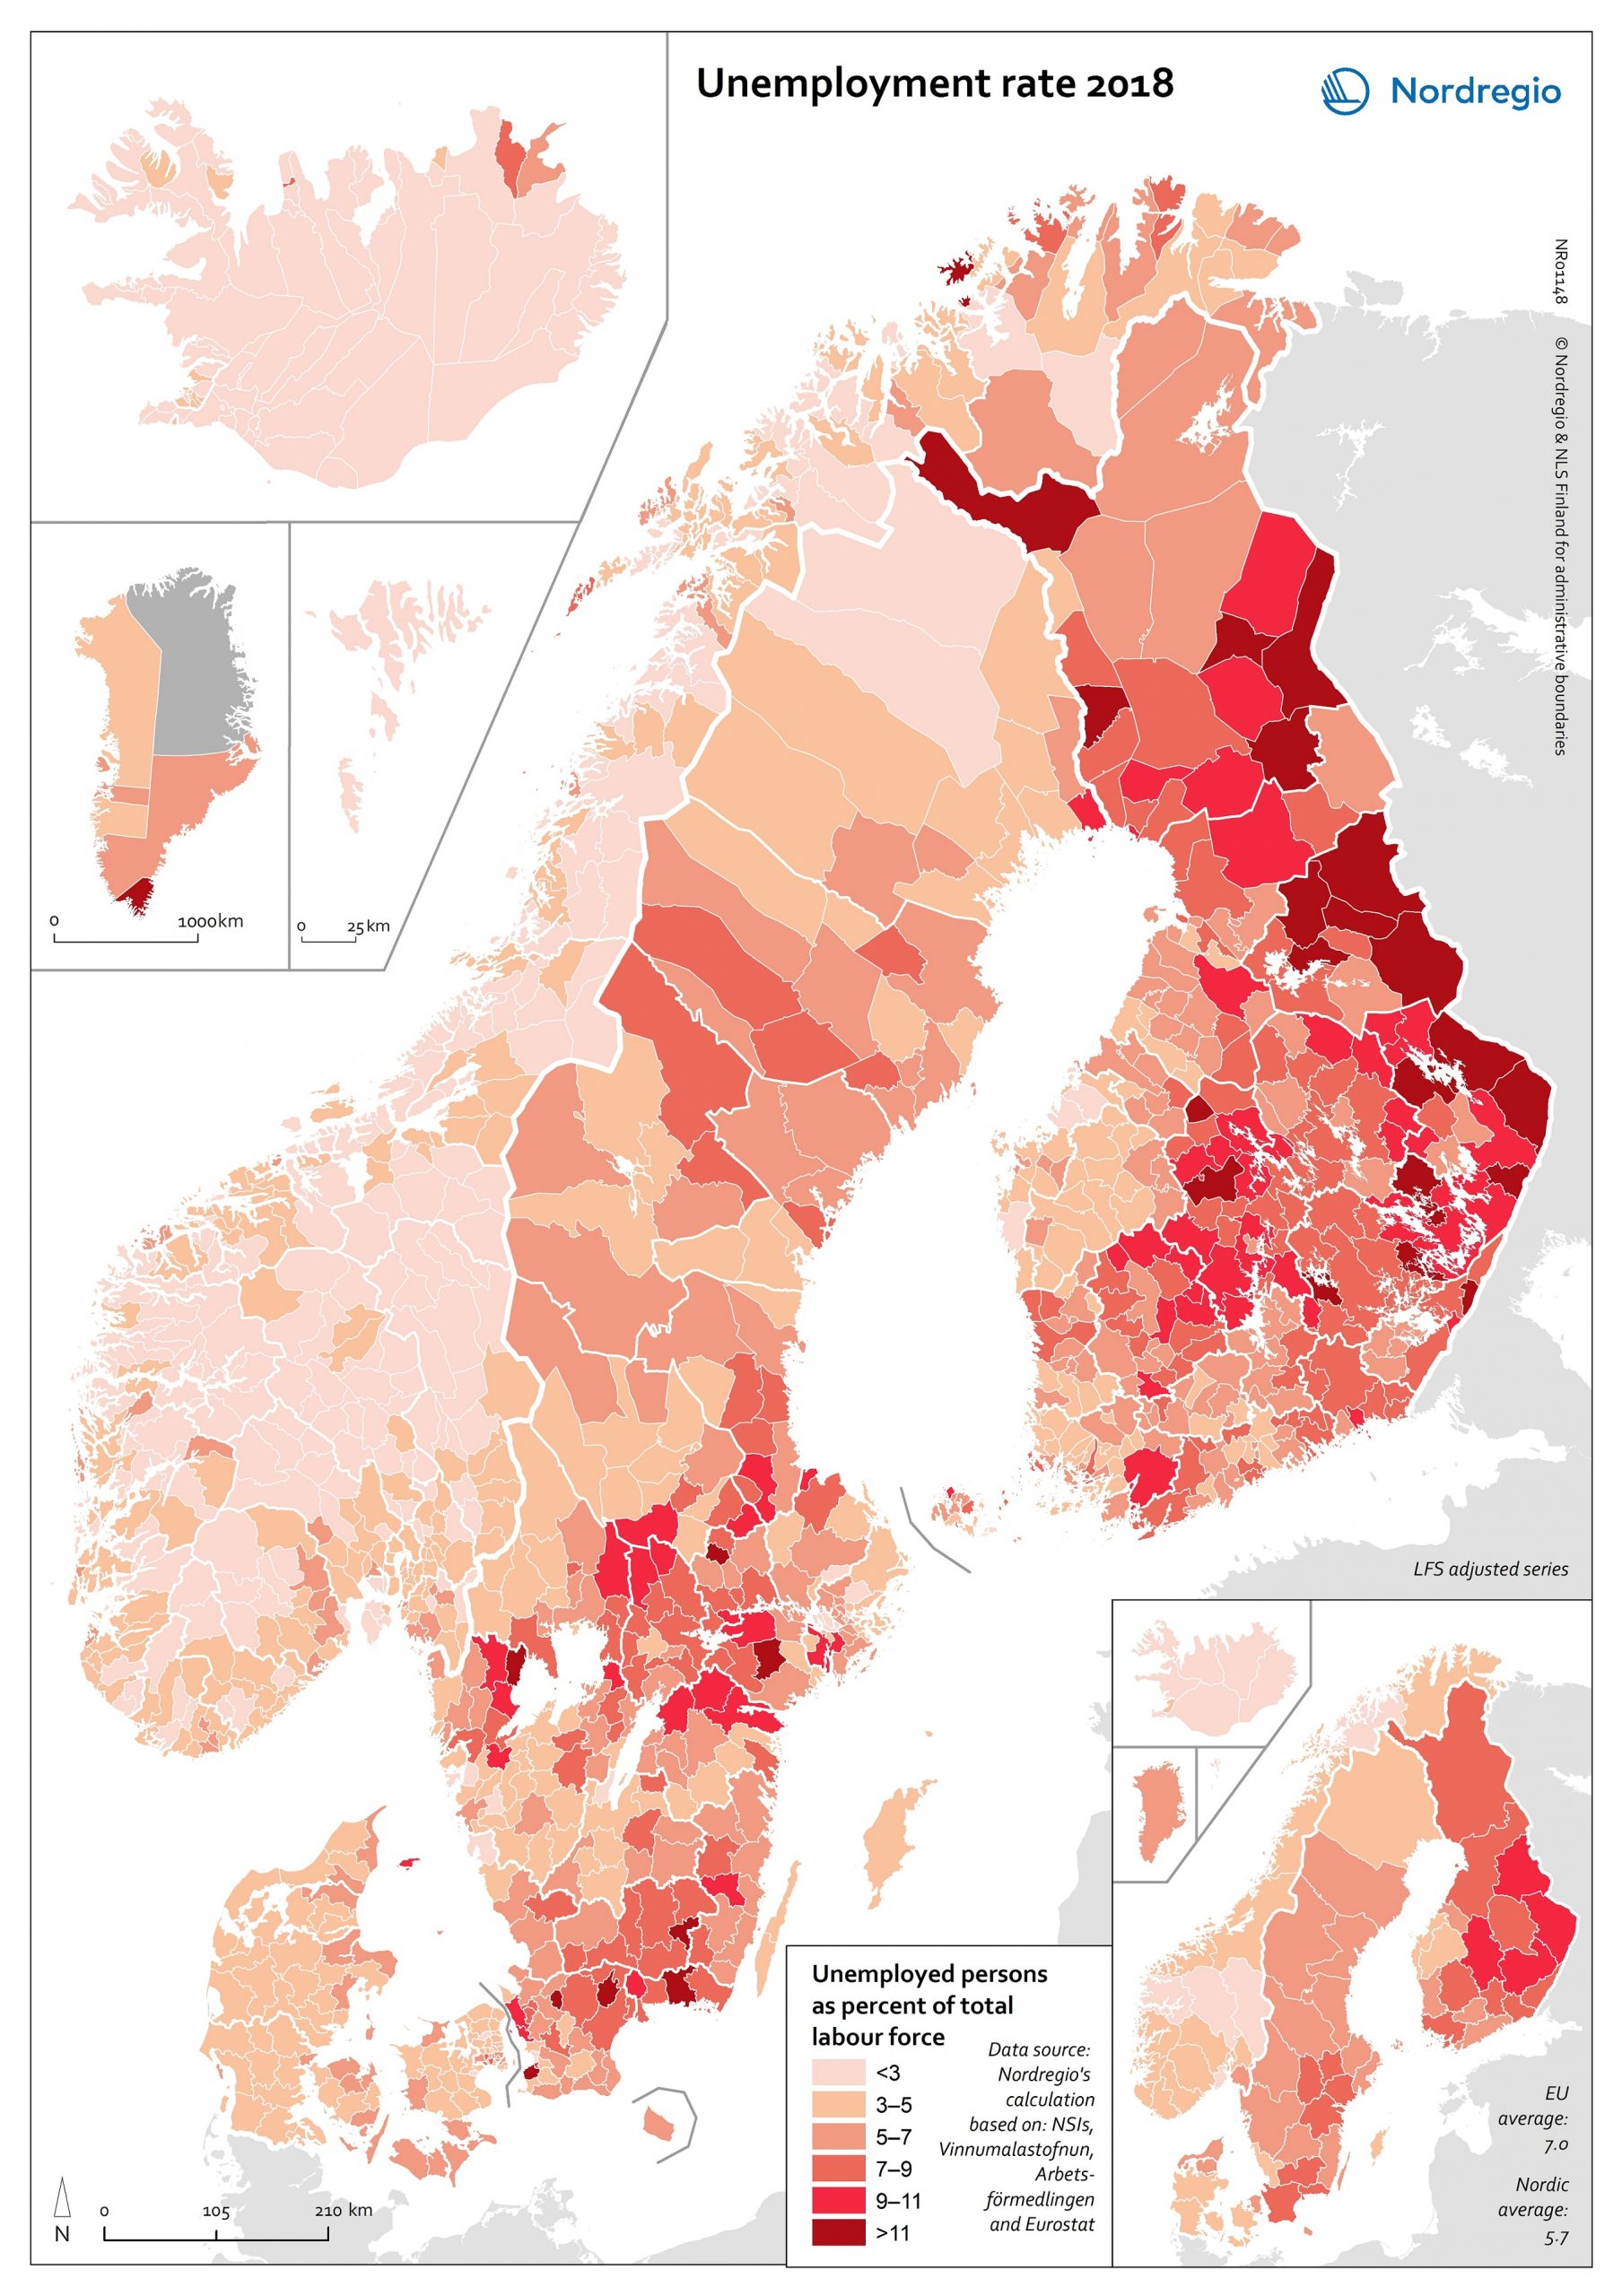
Unemployment rate 2018
The map shows the unemployment rate in the Nordic counties at the municipal level in 2018. Unemployment is measured as the total number of unemployed (i.e. people who were not in employment, but seeking job and available to take up an employment) as share of the total workforce (i.e. employed plus unemployed). The map is based on data from the labour force survey, which is the official way of measuring unemployment. In order to show the municipal level register data has been used as an allocation key. The lighter shades on the map represent lower levels of unemployment, and the darker shades represent higher levels. The Nordic Region has a low average unemployment rate (5.7%) compared with the EU average (7.0%). There is, however, substantial regional variation, both within and between countries. The lowest unemployment rates are found in Iceland, Norway and the Faroe Islands. The highest rates can be found in Finland (particularly in the east ern municipalities), parts of southern Sweden, and Kujalleq (Greenland). Unemployment rates in Den mark are higher than those found in Iceland and Norway, but lower than those found in Sweden and Finland – with the highest rates found in Nord Jylland. The unemployment rate also varies between population groups. In all Nordic countries, for ex ample, the foreign-born population are more likely to be unemployed than their native-born counter parts, particularly if they were born outside the EU (see Figure 4.5). This trend is most pronounced in Sweden and Finland. It can also be observed throughout the EU, where unemployment for foreign-born persons is more than twice that of the native-born population.
- 2020 October
- Economy
- Labour force
- Nordic Region
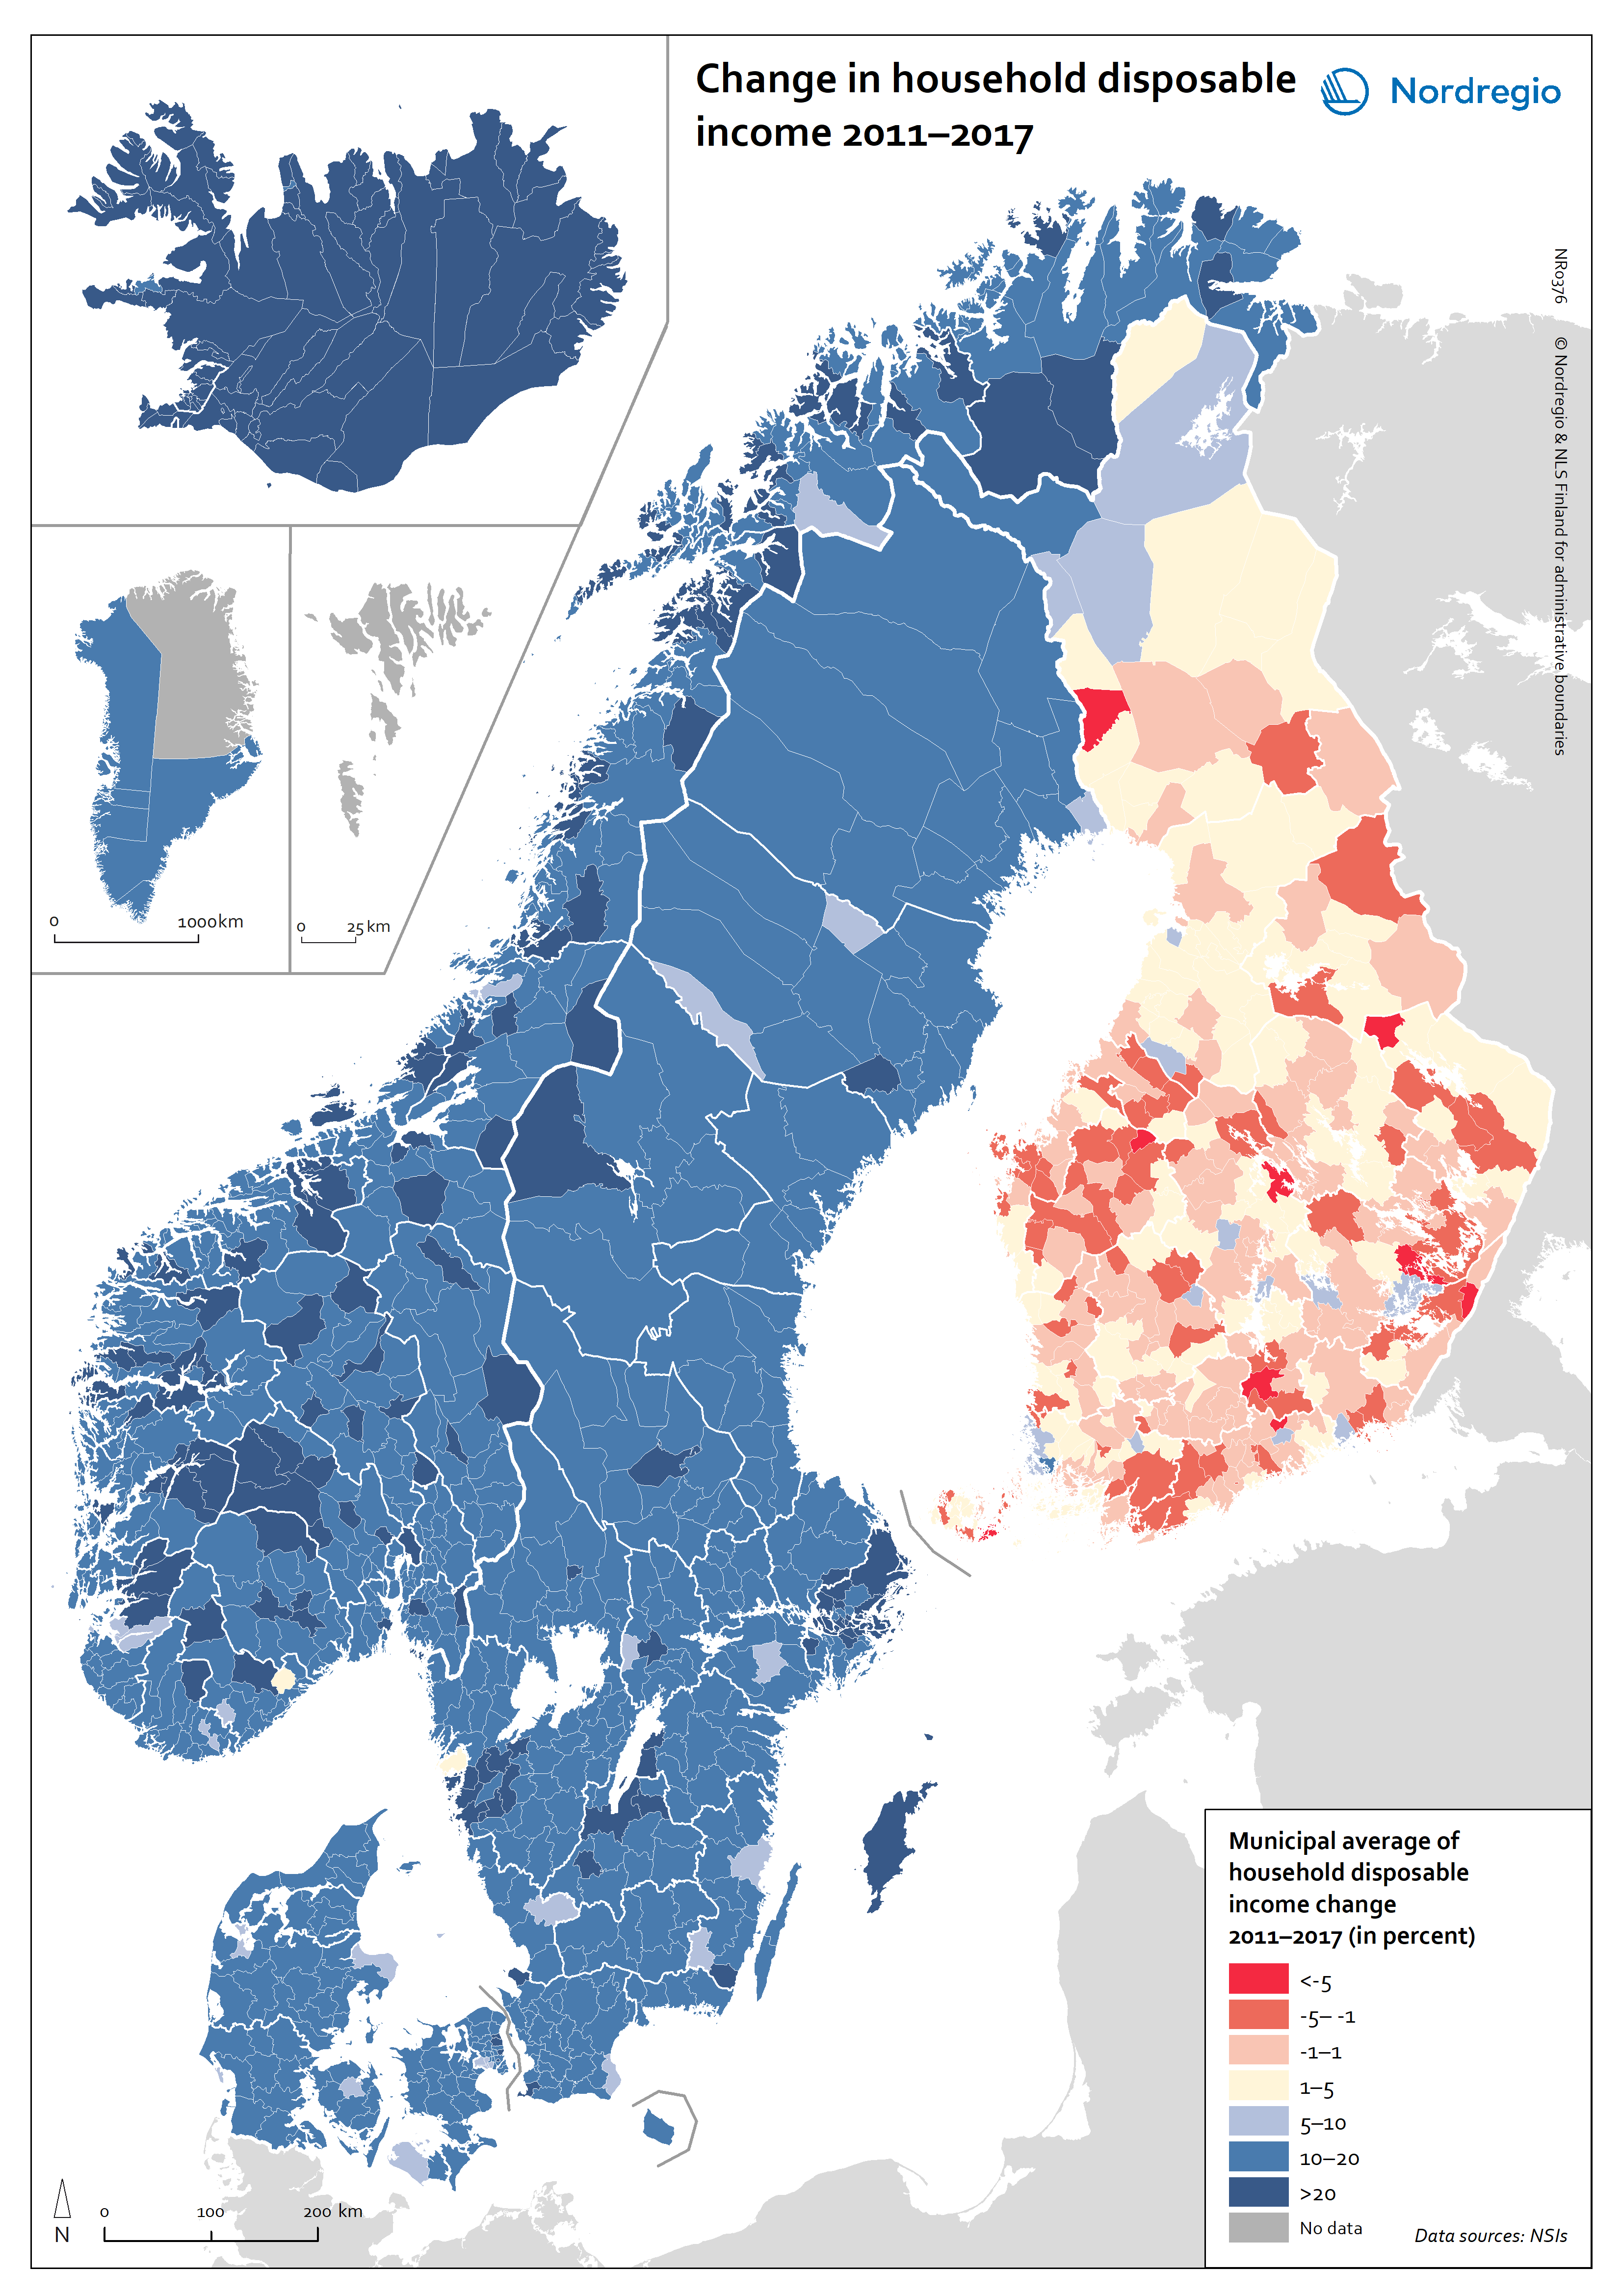
Change in household disposable income 2011–2017
This map shows the change in household disposable income at the municipal level during the period 2011-2017. The blue colours indicate an increase in average household disposable income and the red colours indicate a decrease in average household disposable income. Household disposable income is defined as the sum of the income of a household (i.e. income from employment, net property income, social transfers and social benefits) minus direct taxes and social contributions, with dividends and net interest taken into consideration. The map reveals that a striking difference between the trends in Finland and Åland and those in the rest of the Nordic Region. The average household disposable income has fallen in almost half of the municipalities in Finland and Åland, but increased in all municipalities in Denmark, Greenland, Iceland, Norway and Sweden. Vimpeli, Rautjärvi and Pukkila, all in Finland, are the municipalities which experienced the largest drop in average household income between 2011 and 2017. This negative trend in municipalities in Finland was largely the consequence of a prolonged recession in the early 2010s, when the manufacturing sector was hit by a structural crisis. The situation was exacerbated by out-migration to urban areas and a rise in the unemployment rate in Finland, which peaked in 2015. Read the digital publication here.
- 2020 February
- Economy
- Migration
- Nordic Region
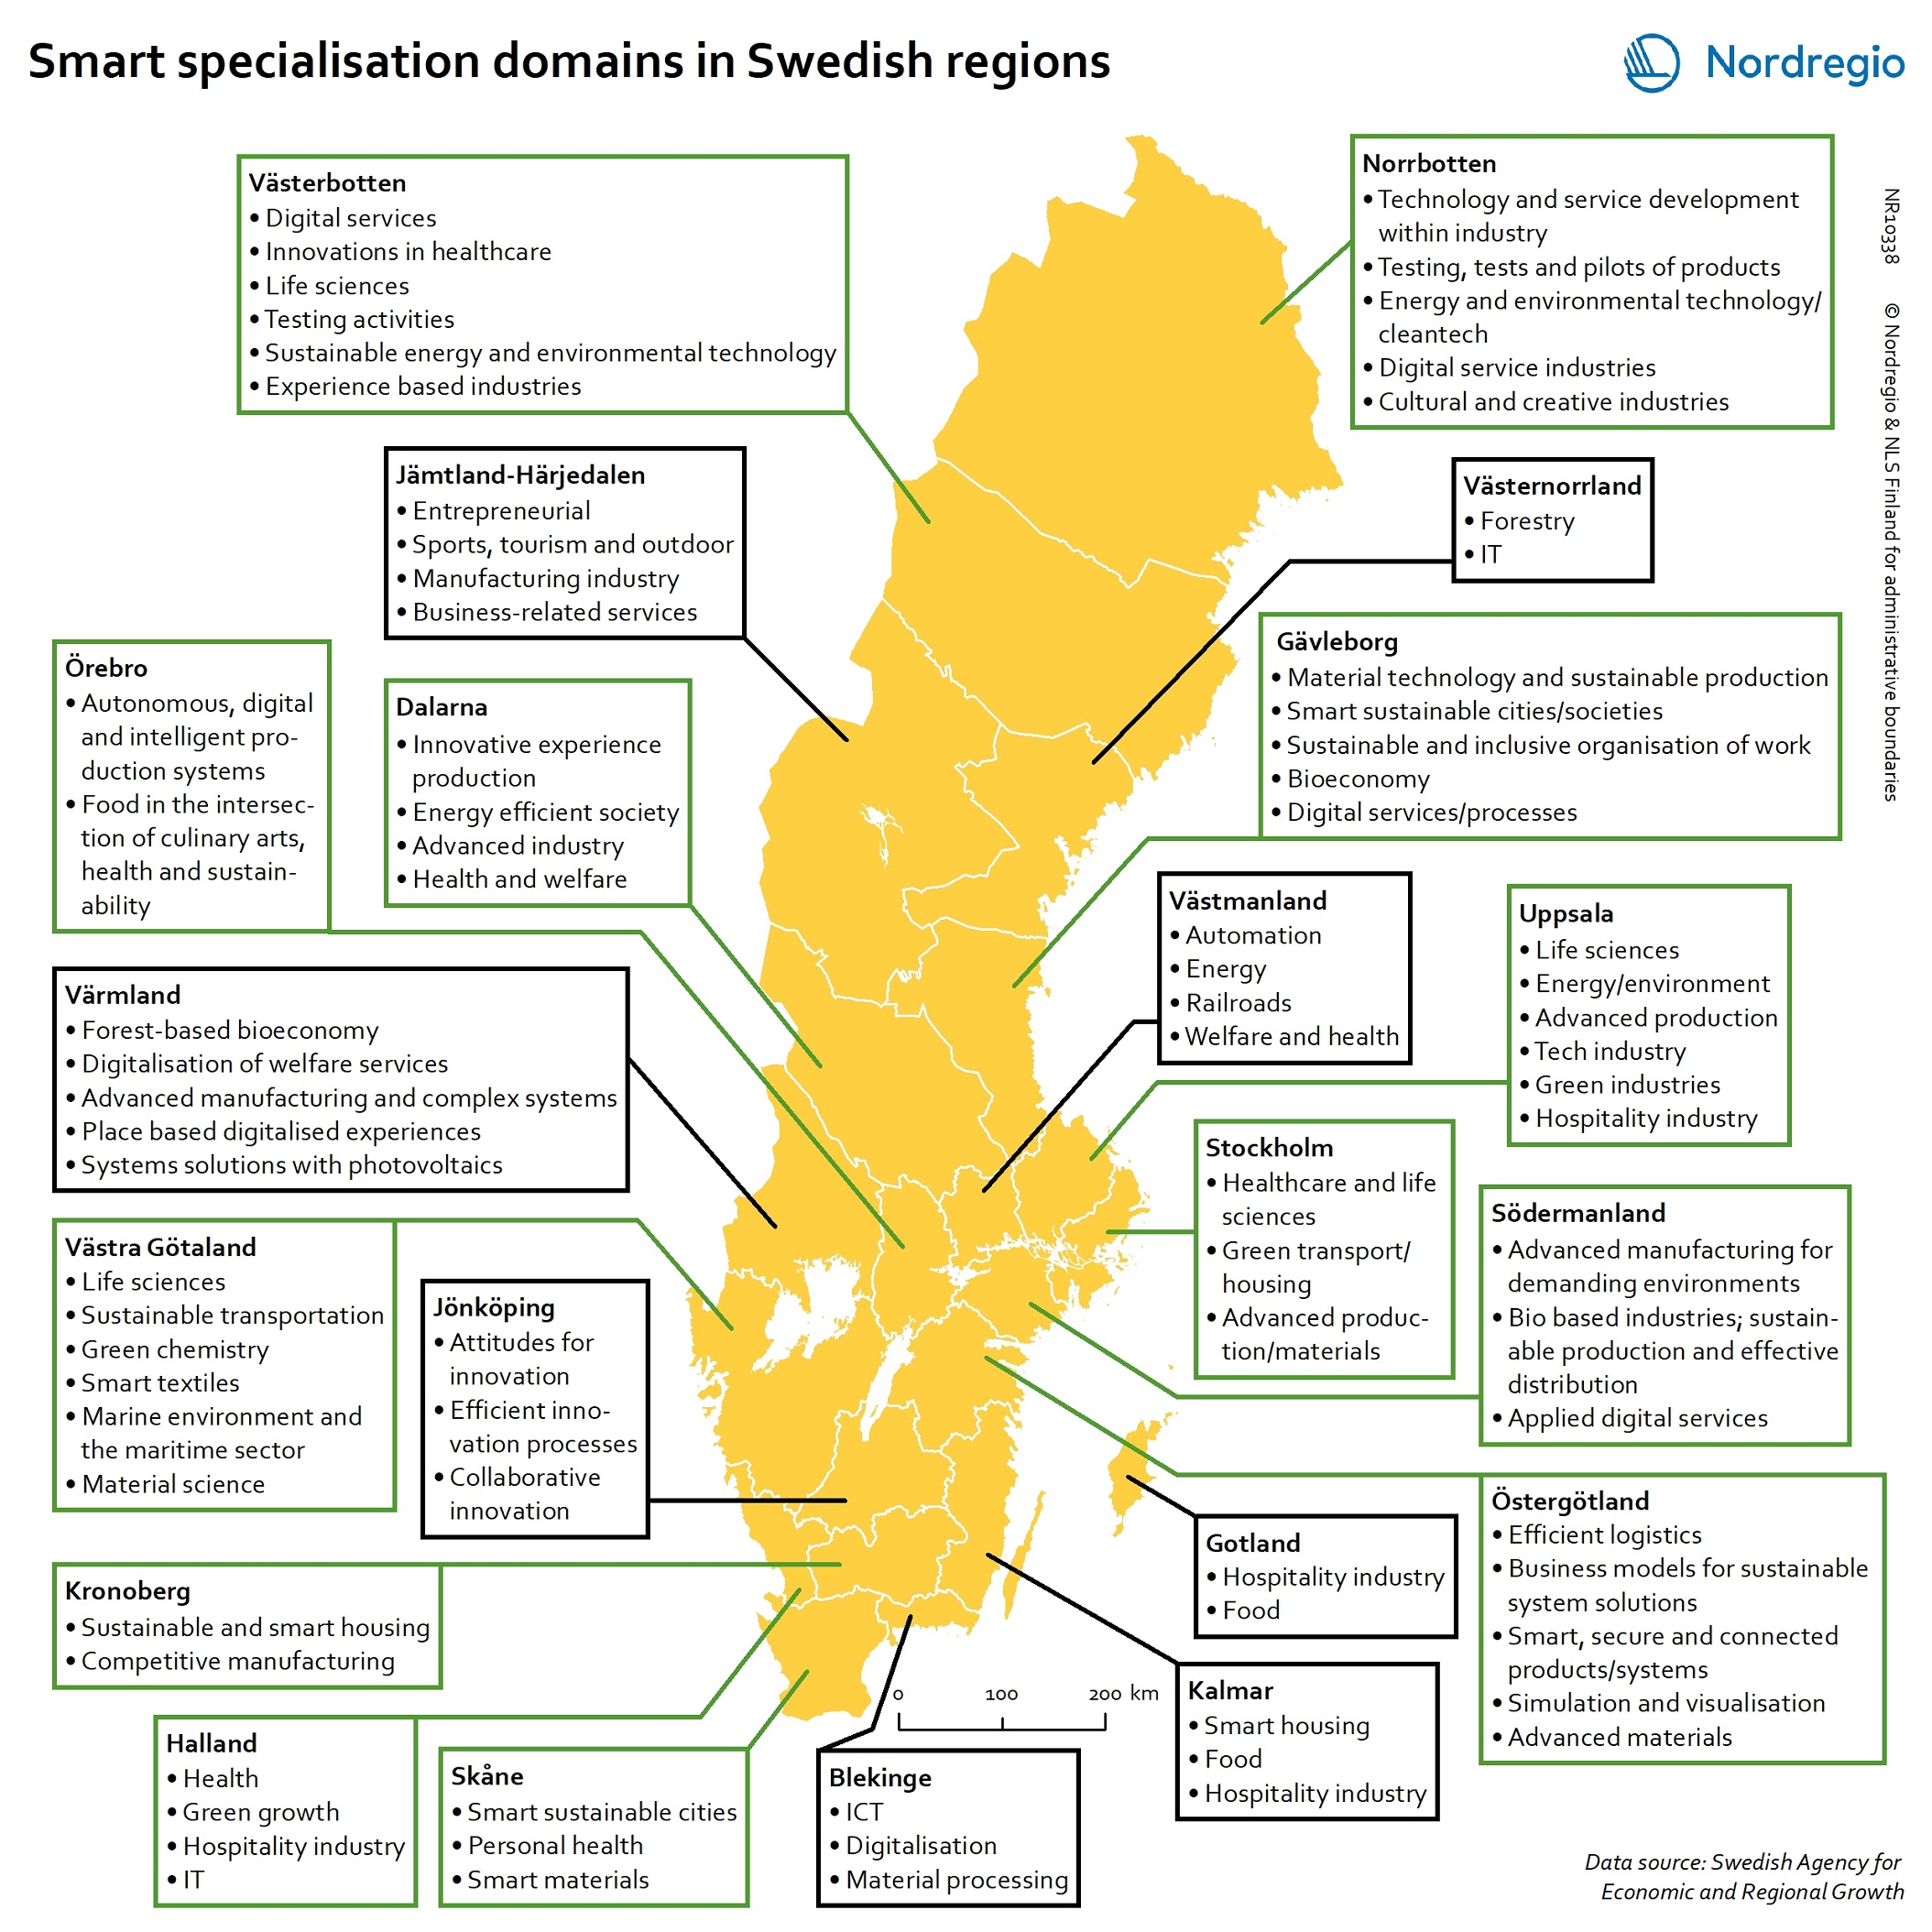
Smart specialisation domains in Swedish regions
This map gives an overview of the S3 focus areas in the Swedish regions in 2019. The major S3 domains in Sweden shown in the map provide a good overview of the key specialisation areas in Sweden. It is possible, for example, to check which Swedish regions have “green”, “sustainable”, “environment” at their smart specialisation domains (marked in green in their respective infoboxes for the domains in the figure). The information illustrated in the map can assist Swedish regions when they are considering opportunities for S3 synergy and co-operation with each other. In Sweden, the Swedish Agency for Economic and Regional Growth (Tillväxtverket) is a central actor in assisting regions in their work with smart specialisation. Tillväxtverket promotes opportunities for cooperation between the Swedish regional S3 processes and provides relevant information and learning seminars related to S3. Read the digital publication here.
- 2020 February
- Economy
- Research and innovation
- Sweden