57 Maps
New urban-rural typology of Nordic countries
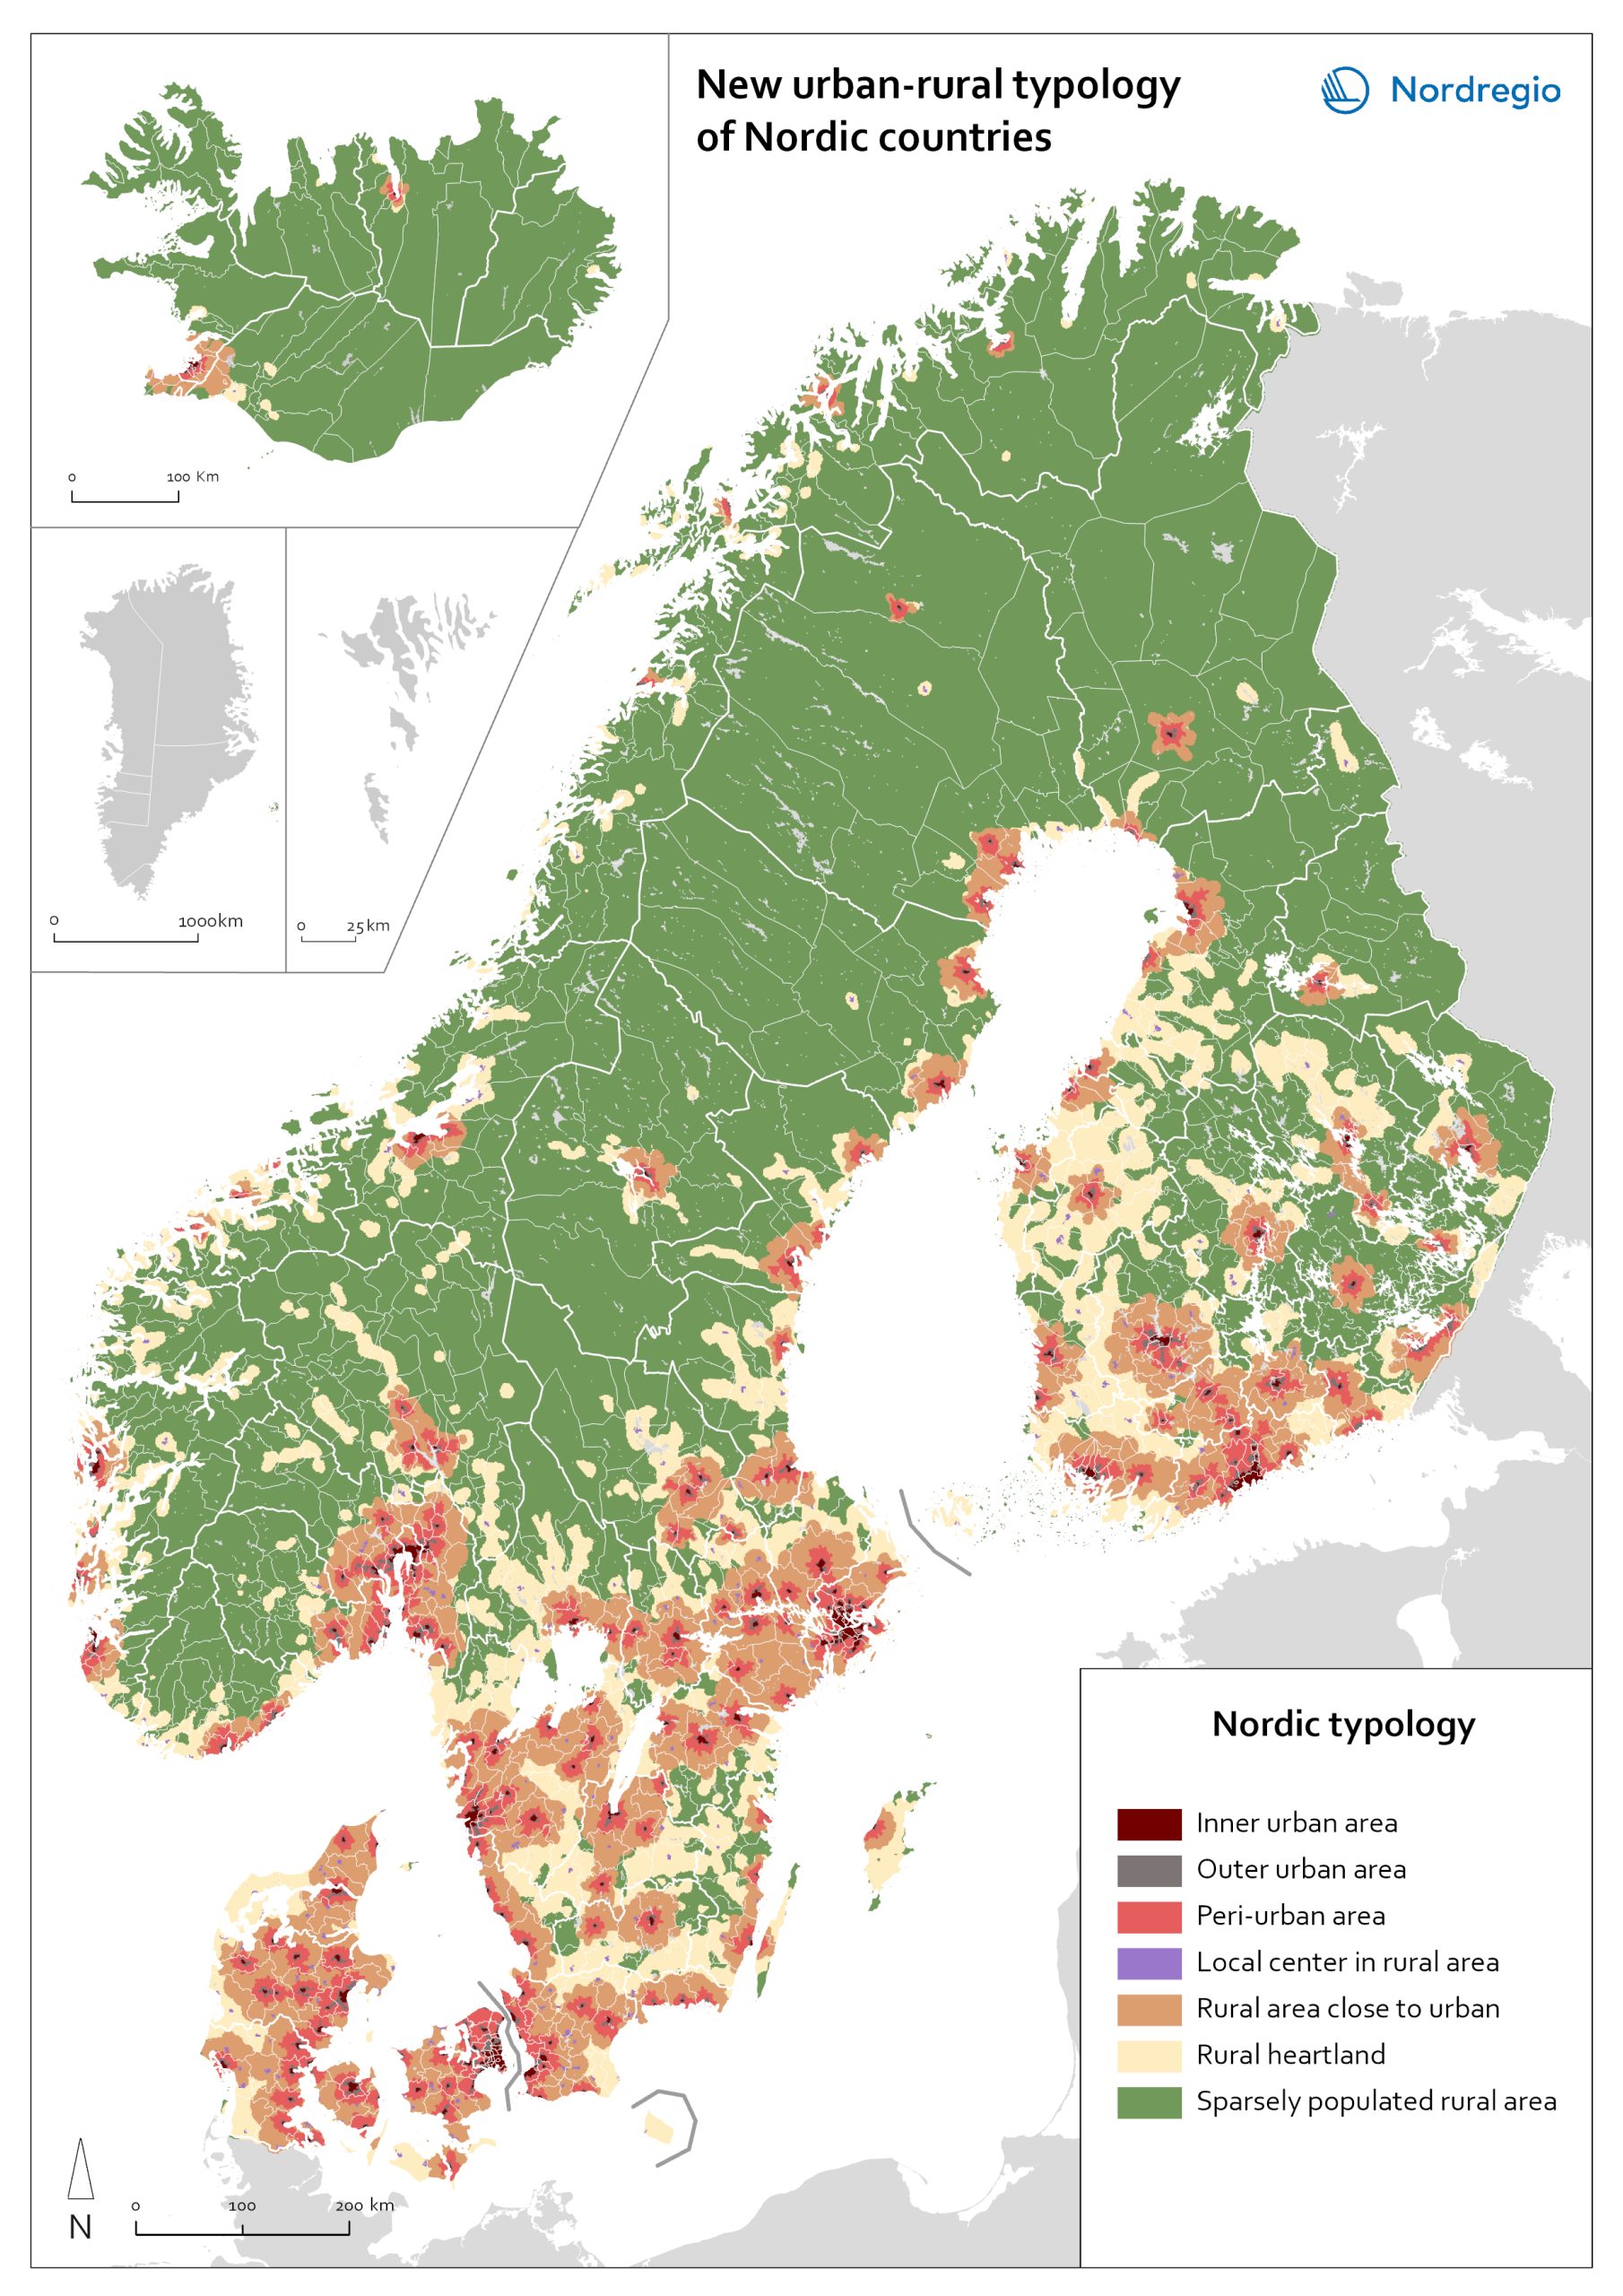
A map portrays a new urban-rural typology based on the grid-level data. New Nordic urban-rural typology is a grid-based classification of areas developed by the Nordic Thematic groups 2021-2024 to enable more accurate cross-Nordic statistical comparisons. The seven classes are defined based on population density, proximity measures and land cover parameters. Read more about the typology here . Inner urban area is the most densely populated part of the urban core. Urban cores are clustered cells summing up to at least 15 000 inhabitants, and these are divided into Inner and Outer urban areas based on density criterion (population density and building floor space). Outer urban area is the least densely populated part of the urban core. Urban core areas are clustered cells with at least 15 000 inhabitants, and these are divided into Inner and Outer urban areas based on density criterions (population density and building floorspace). Peri-urban area is the intermediate zone between urban core and the rural. It is based on generalized travel-time estimates from the edges of outer urban areas (6 min travel-time zones) and smaller urban settlement (4,5 min travel-time zones). Local centers in rural areas are population centers located outside urban areas, small towns and large parish villages where population is between 5000-14999 inhabitants. Rural areas close to urban areas have a rural character that are functionally connected and close to urban areas. In average this means 20-30 of minutes’ drive time from the edge of outer urban area. This class overwrites the area classes ‘Rural heartland’ and ‘Sparsely populated rural areas’. Rural heartland. Rural areas with intensive land use, with a relatively dense population and a diverse economic structure at the local level. Most of the agricultural land is in this class. Sparsely populated rural areas. Sparsely populated areas with dispersed small settlements that are located at a distance from each other.…
 2023 January
 - Administrative and functional divisions
- Nordic Region
New urban-rural typology of Nordic countries
A map portrays a new urban-rural typology based on the grid-level data. New Nordic urban-rural typology is a grid-based classification of areas developed by the Nordic Thematic groups 2021-2024 to enable more accurate cross-Nordic statistical comparisons. The seven classes are defined based on population density, proximity measures and land cover parameters. Read more about the typology here . Inner urban area is the most densely populated part of the urban core. Urban cores are clustered cells summing up to at least 15 000 inhabitants, and these are divided into Inner and Outer urban areas based on density criterion (population density and building floor space). Outer urban area is the least densely populated part of the urban core. Urban core areas are clustered cells with at least 15 000 inhabitants, and these are divided into Inner and Outer urban areas based on density criterions (population density and building floorspace). Peri-urban area is the intermediate zone between urban core and the rural. It is based on generalized travel-time estimates from the edges of outer urban areas (6 min travel-time zones) and smaller urban settlement (4,5 min travel-time zones). Local centers in rural areas are population centers located outside urban areas, small towns and large parish villages where population is between 5000-14999 inhabitants. Rural areas close to urban areas have a rural character that are functionally connected and close to urban areas. In average this means 20-30 of minutes’ drive time from the edge of outer urban area. This class overwrites the area classes ‘Rural heartland’ and ‘Sparsely populated rural areas’. Rural heartland. Rural areas with intensive land use, with a relatively dense population and a diverse economic structure at the local level. Most of the agricultural land is in this class. Sparsely populated rural areas. Sparsely populated areas with dispersed small settlements that are located at a distance from each other.…
- 2023 January
- Administrative and functional divisions
- Nordic Region
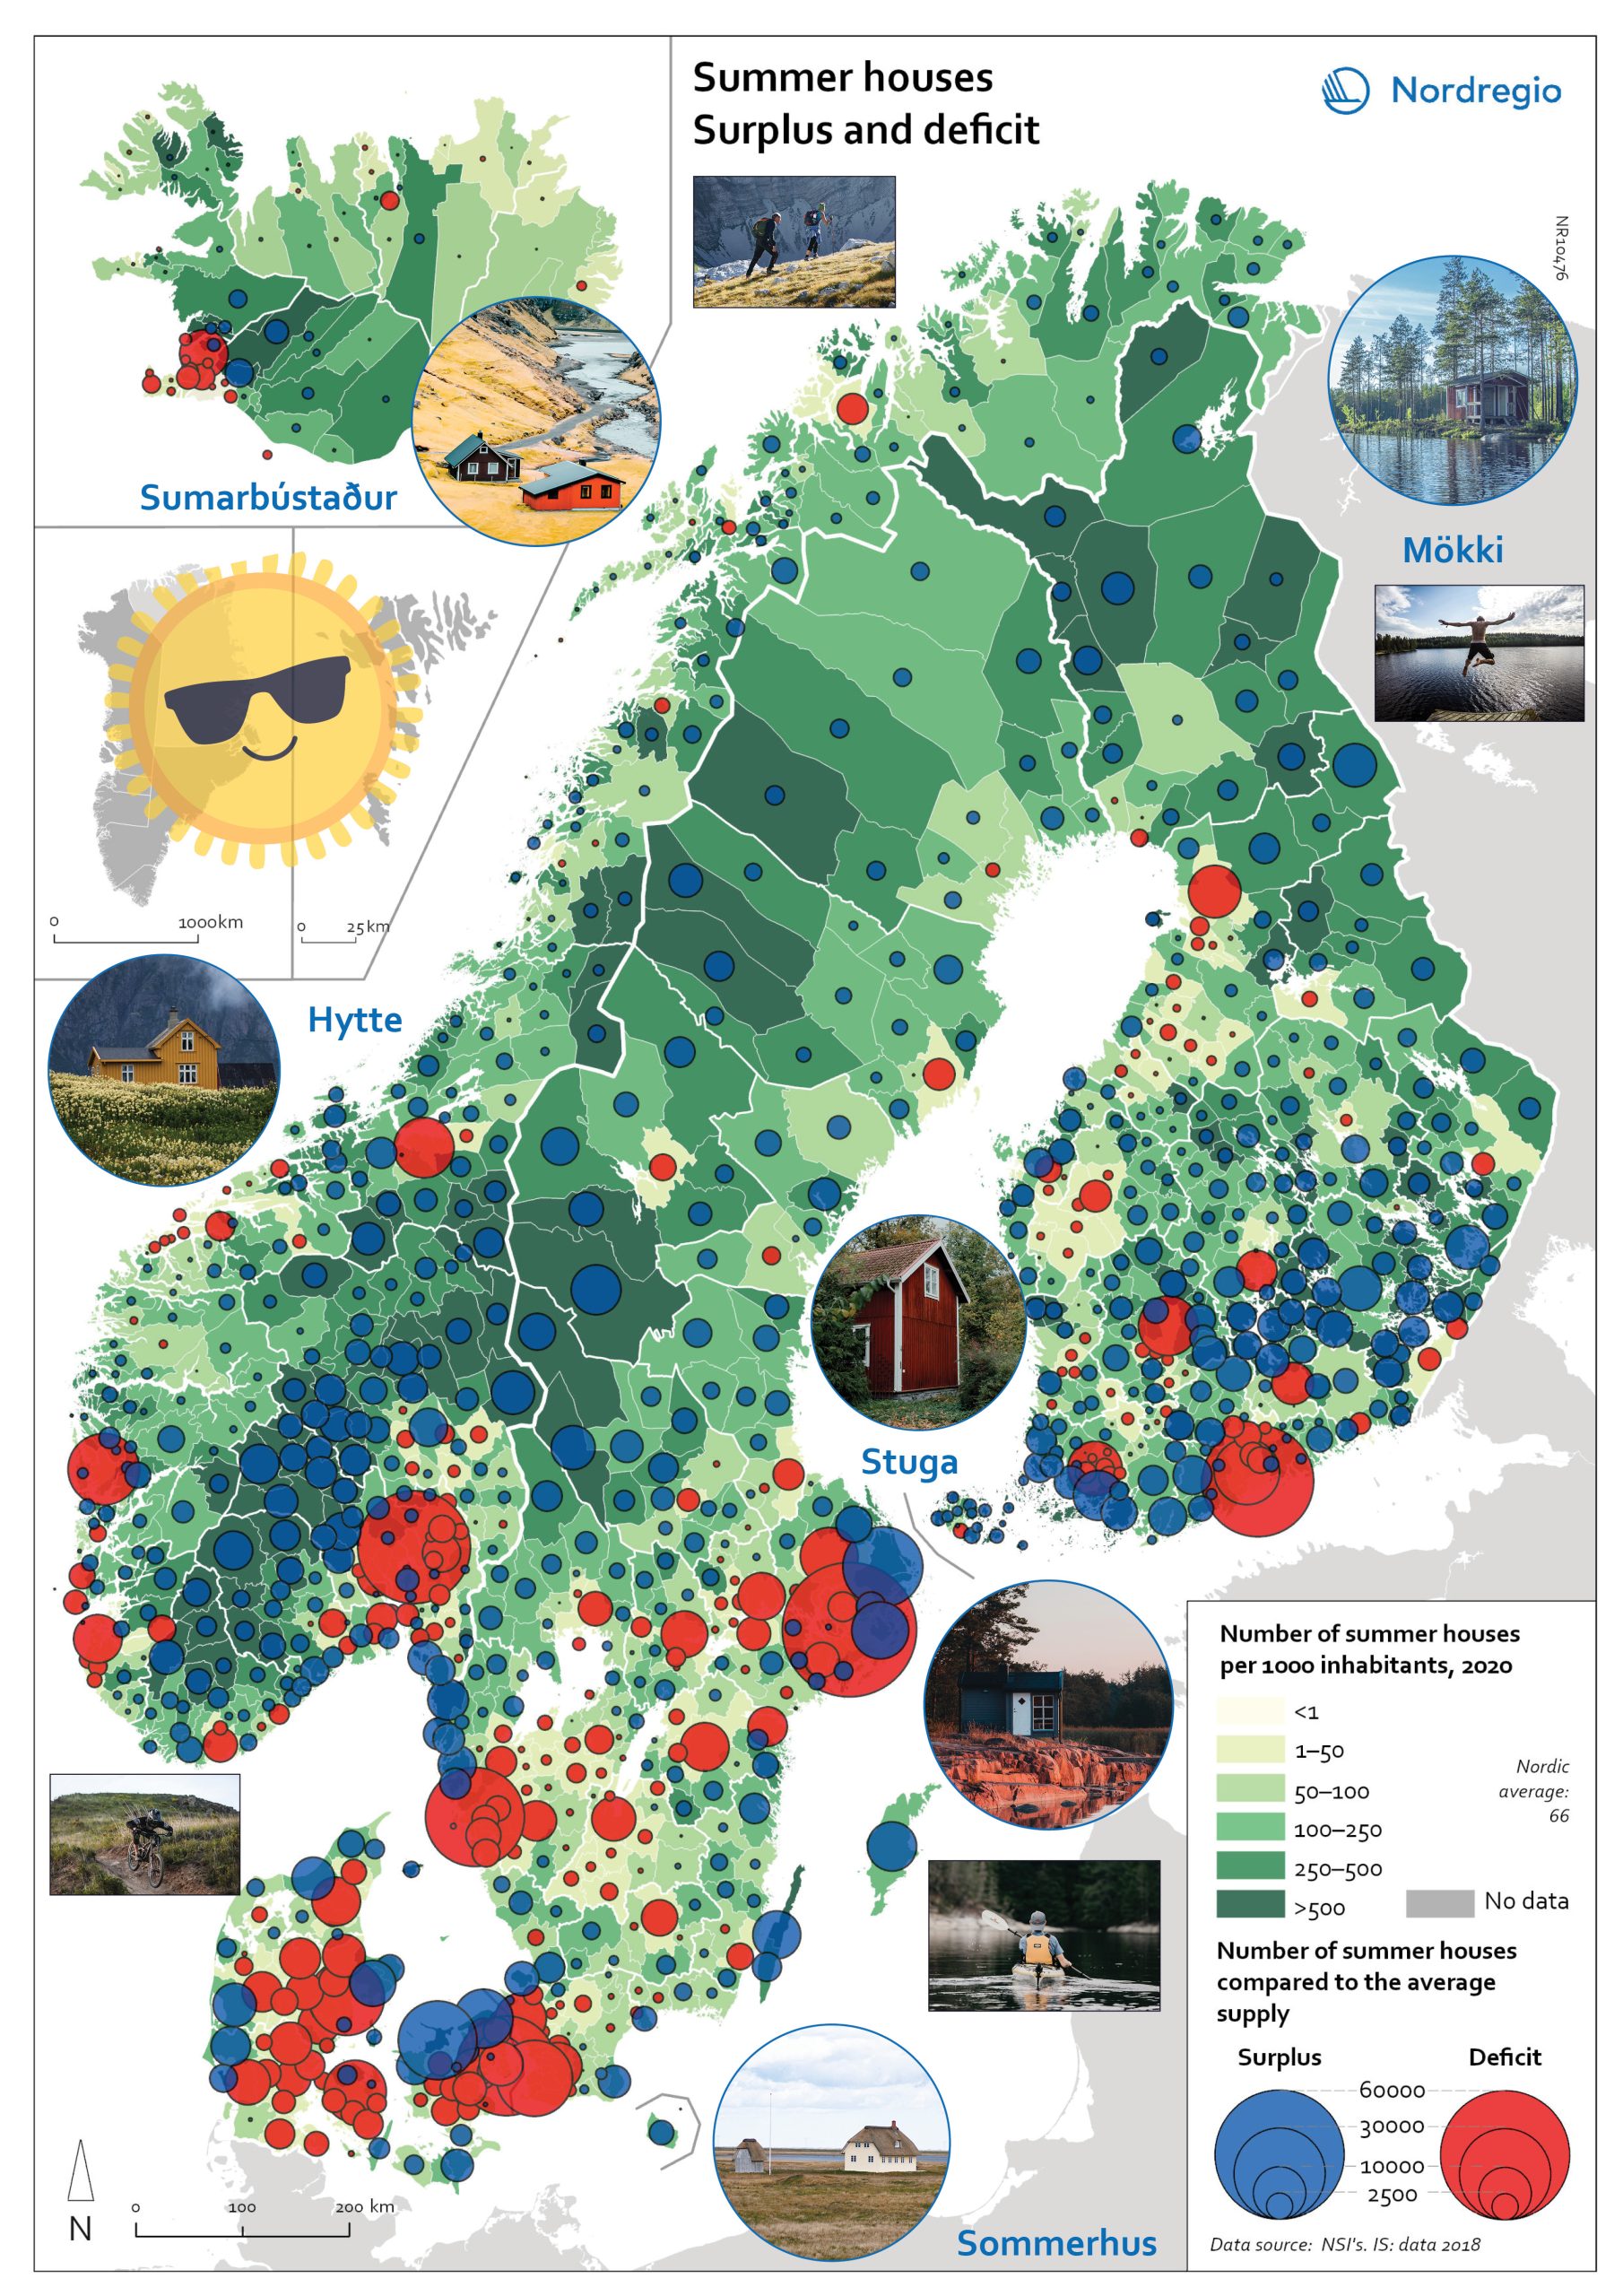
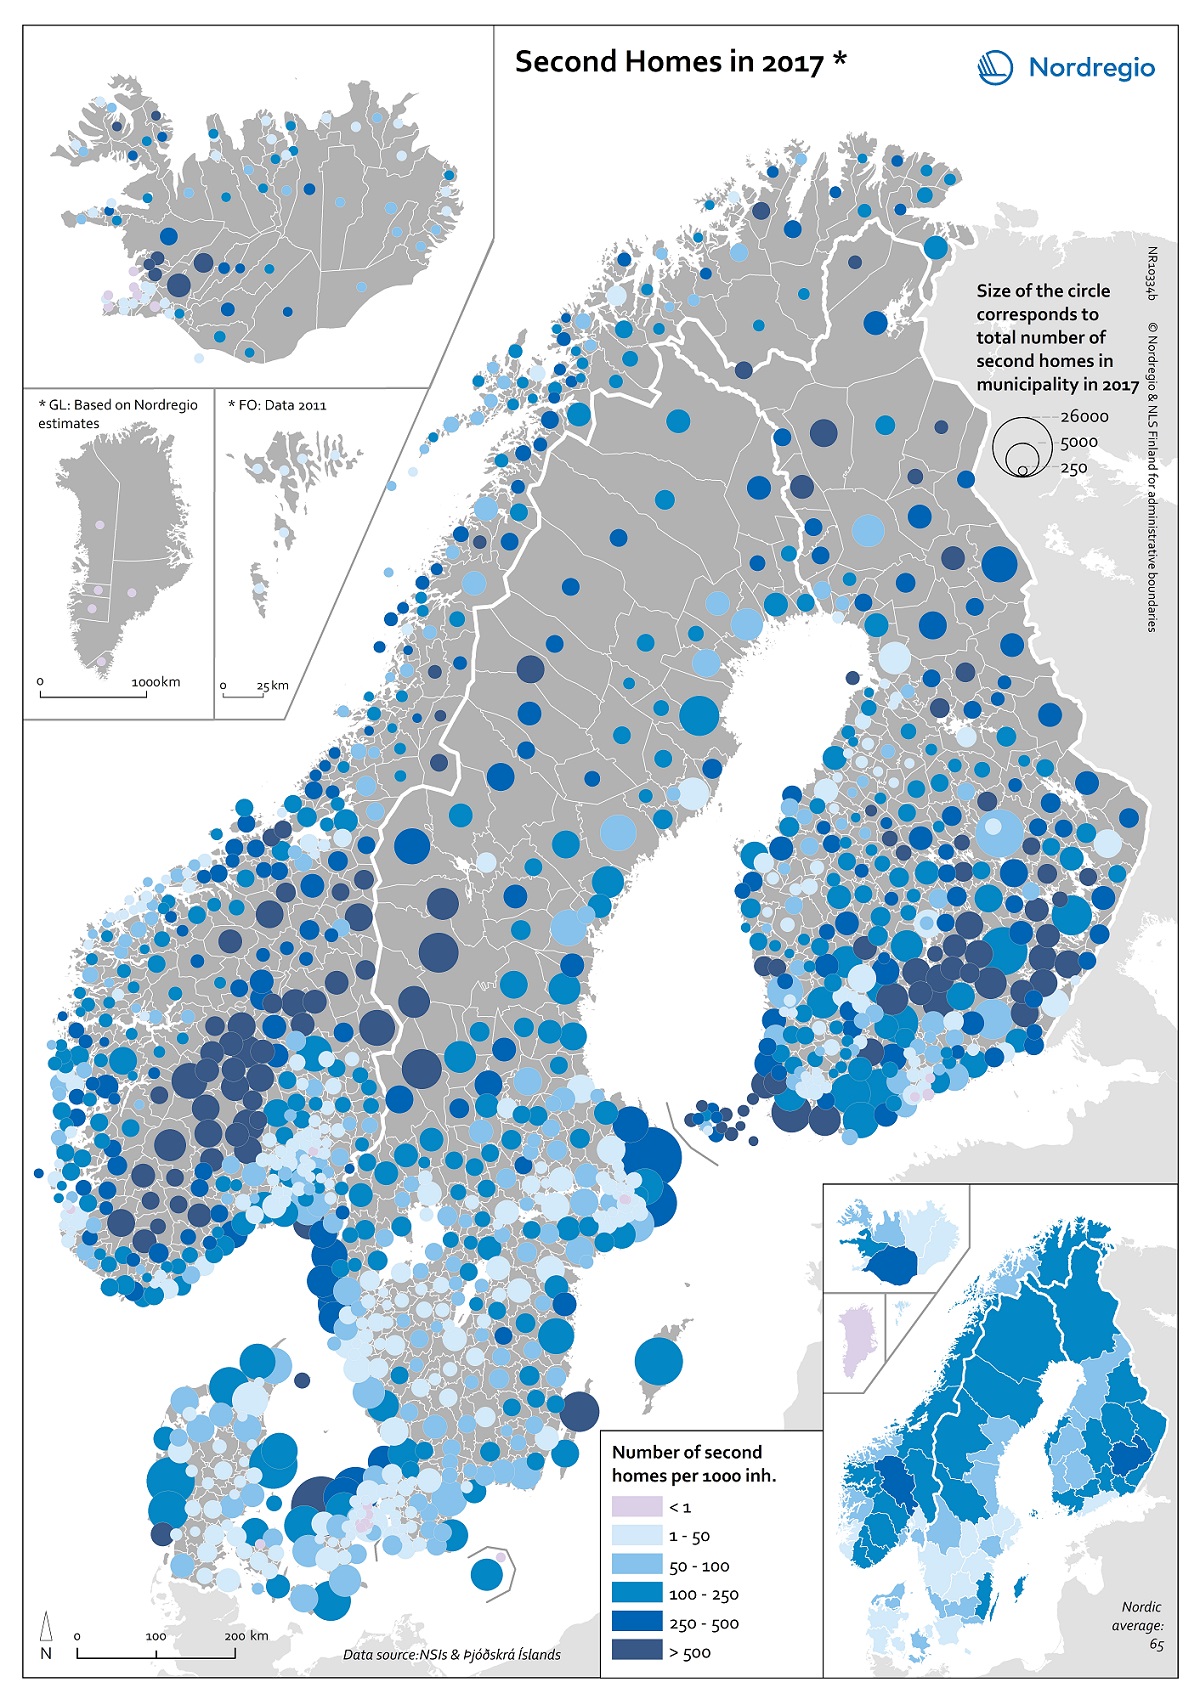
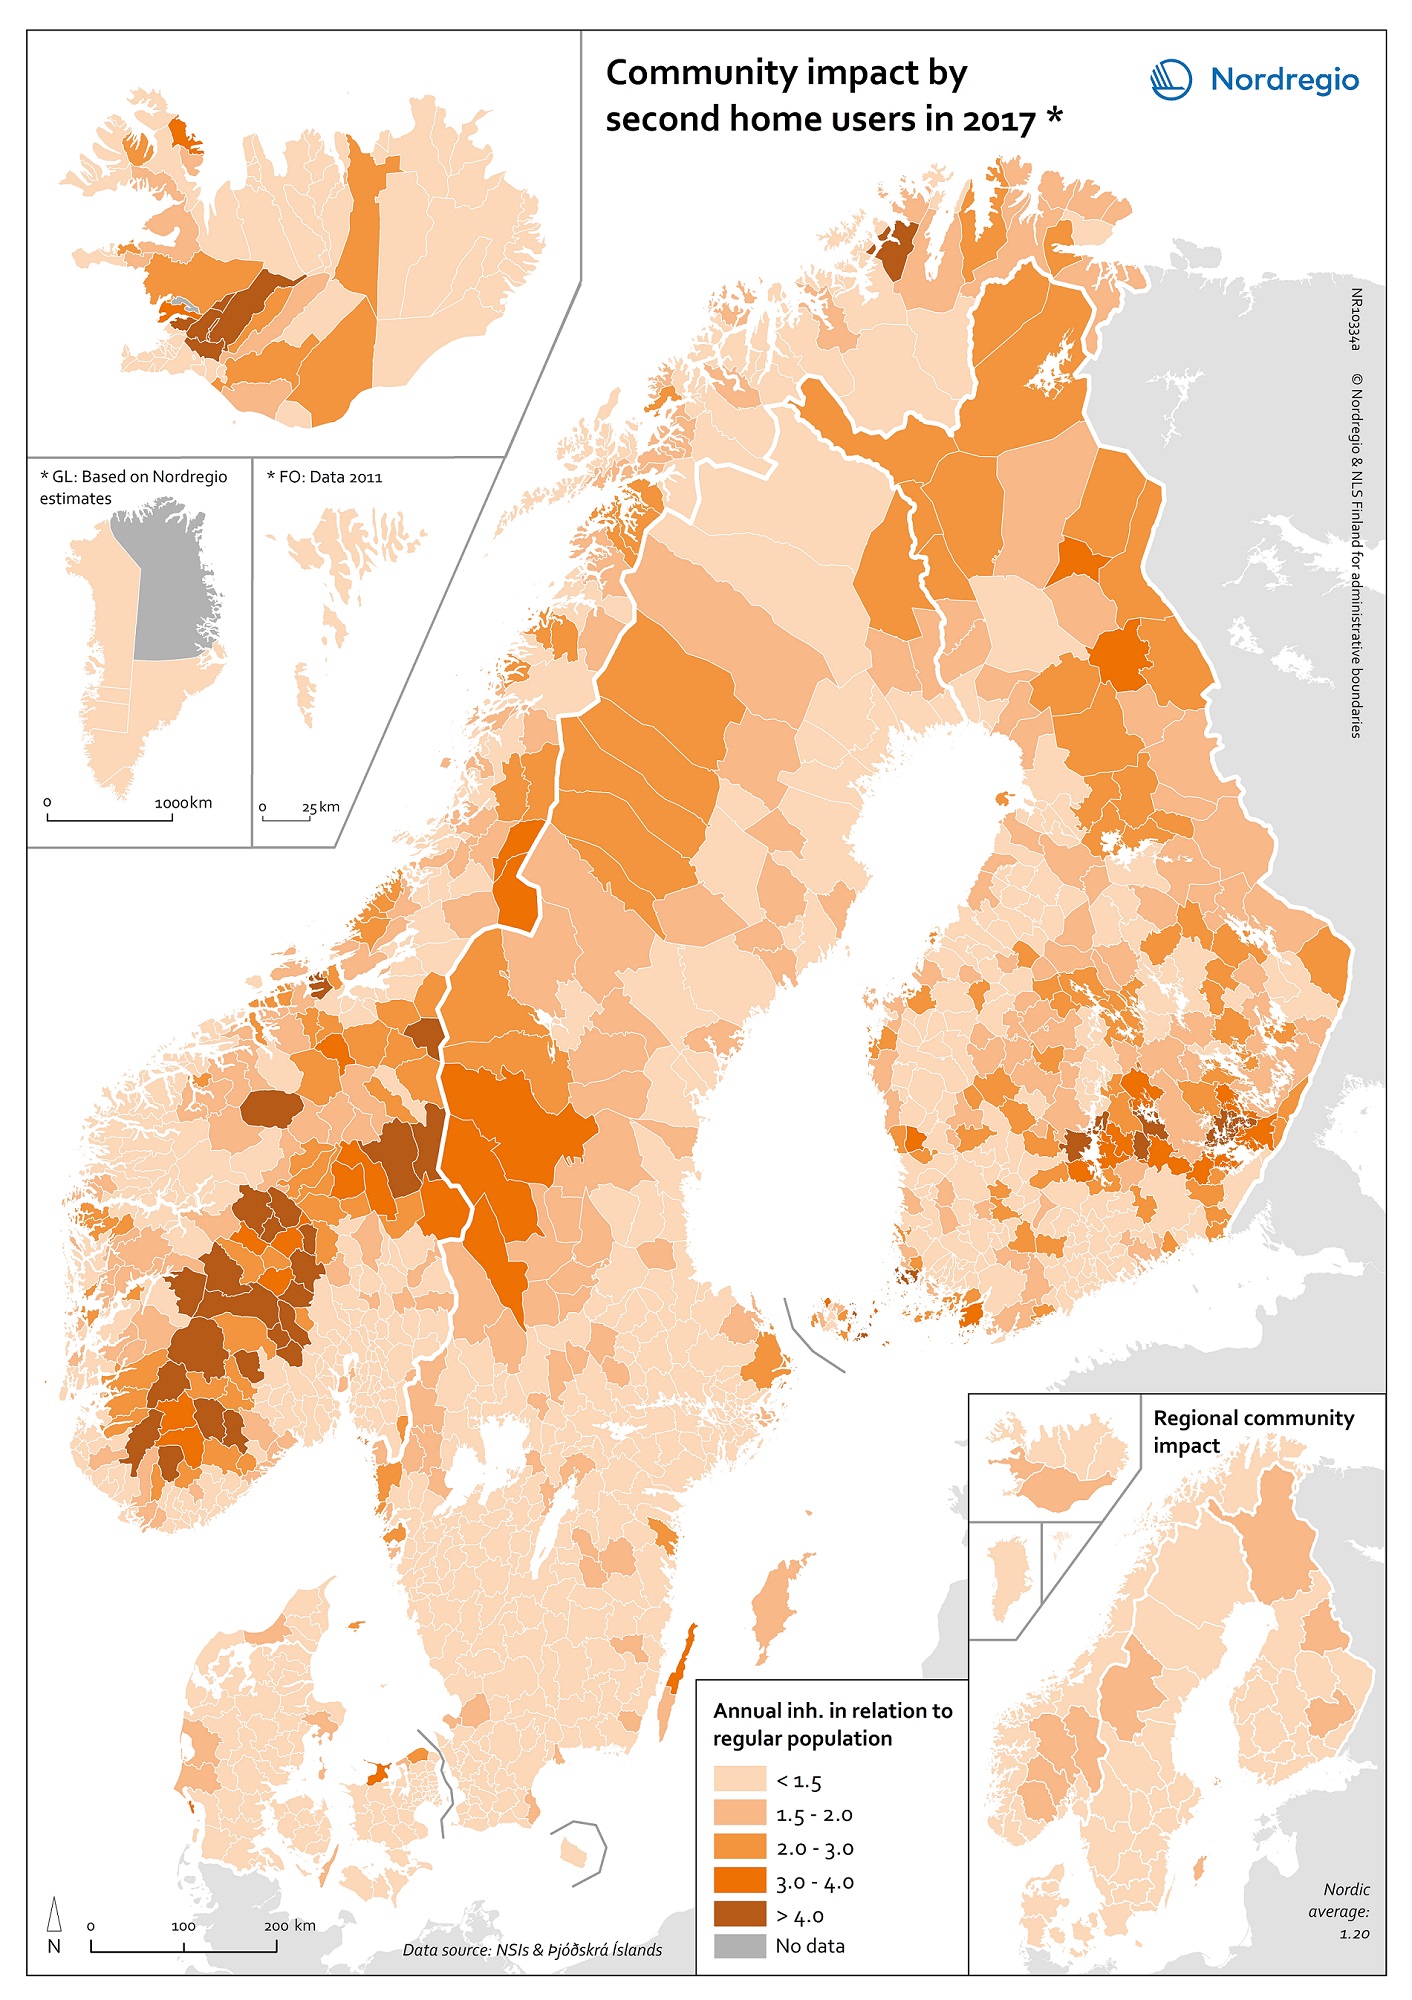
Gone missing: Nordic people!
Nordregio Summer Map 2022: Empty streets, closed restaurants – where is everyone? Nordic cities are about to quiet down as millions of people are logging out from work. But where do they go – Mallorca? Some yes, but the Nordic people are known for their nature-loving and private spirit, and most like to unwind in isolation. So, they head to their private paradises – to one of the 1.8 million summer houses around the Nordics, or as they would call them: sommerhus, stuga, hytte, sumarbústaður or mökki. The Nordregio Summer Map 2022 reveals the secret spots. The Finnish and Norwegians are most likely already packing their cars and leaving the cities: the highest supply of summer houses per inhabitant is found in Finland (92 summer houses per 1000 inhabitants) closely followed by Norway (82). The Swedish (59) Danish (40) and Icelandic (40) people seem to have more varied summer activities. There are large regional differences in the number of summer houses and the number of potential users – so not enough cabins where people would want them! And this is the dilemma Nordregio Summer Map 2022 shows in detail. Most people live in the larger urban areas while many summer houses are located in more remote and sparsely populated areas. The largest deficit of summer houses is found in Stockholm: with almost 1 million inhabitants, there is a need for 65,000 summer houses but the municipality has only 2,000 to offer! So, people living in Stockholm need to go elsewhere to find a summer house. The same goes for the other capital municipalities which have large deficits in summer houses: Oslo is missing 44,000, Helsinki 43,000, and Copenhagen 34,000. Fortunately, there are places that would happily accommodate these second-home searchers. Good news for Stockholm after all as the top-scoring municipality…
- 2022 June
- Nordic Region
- Tourism
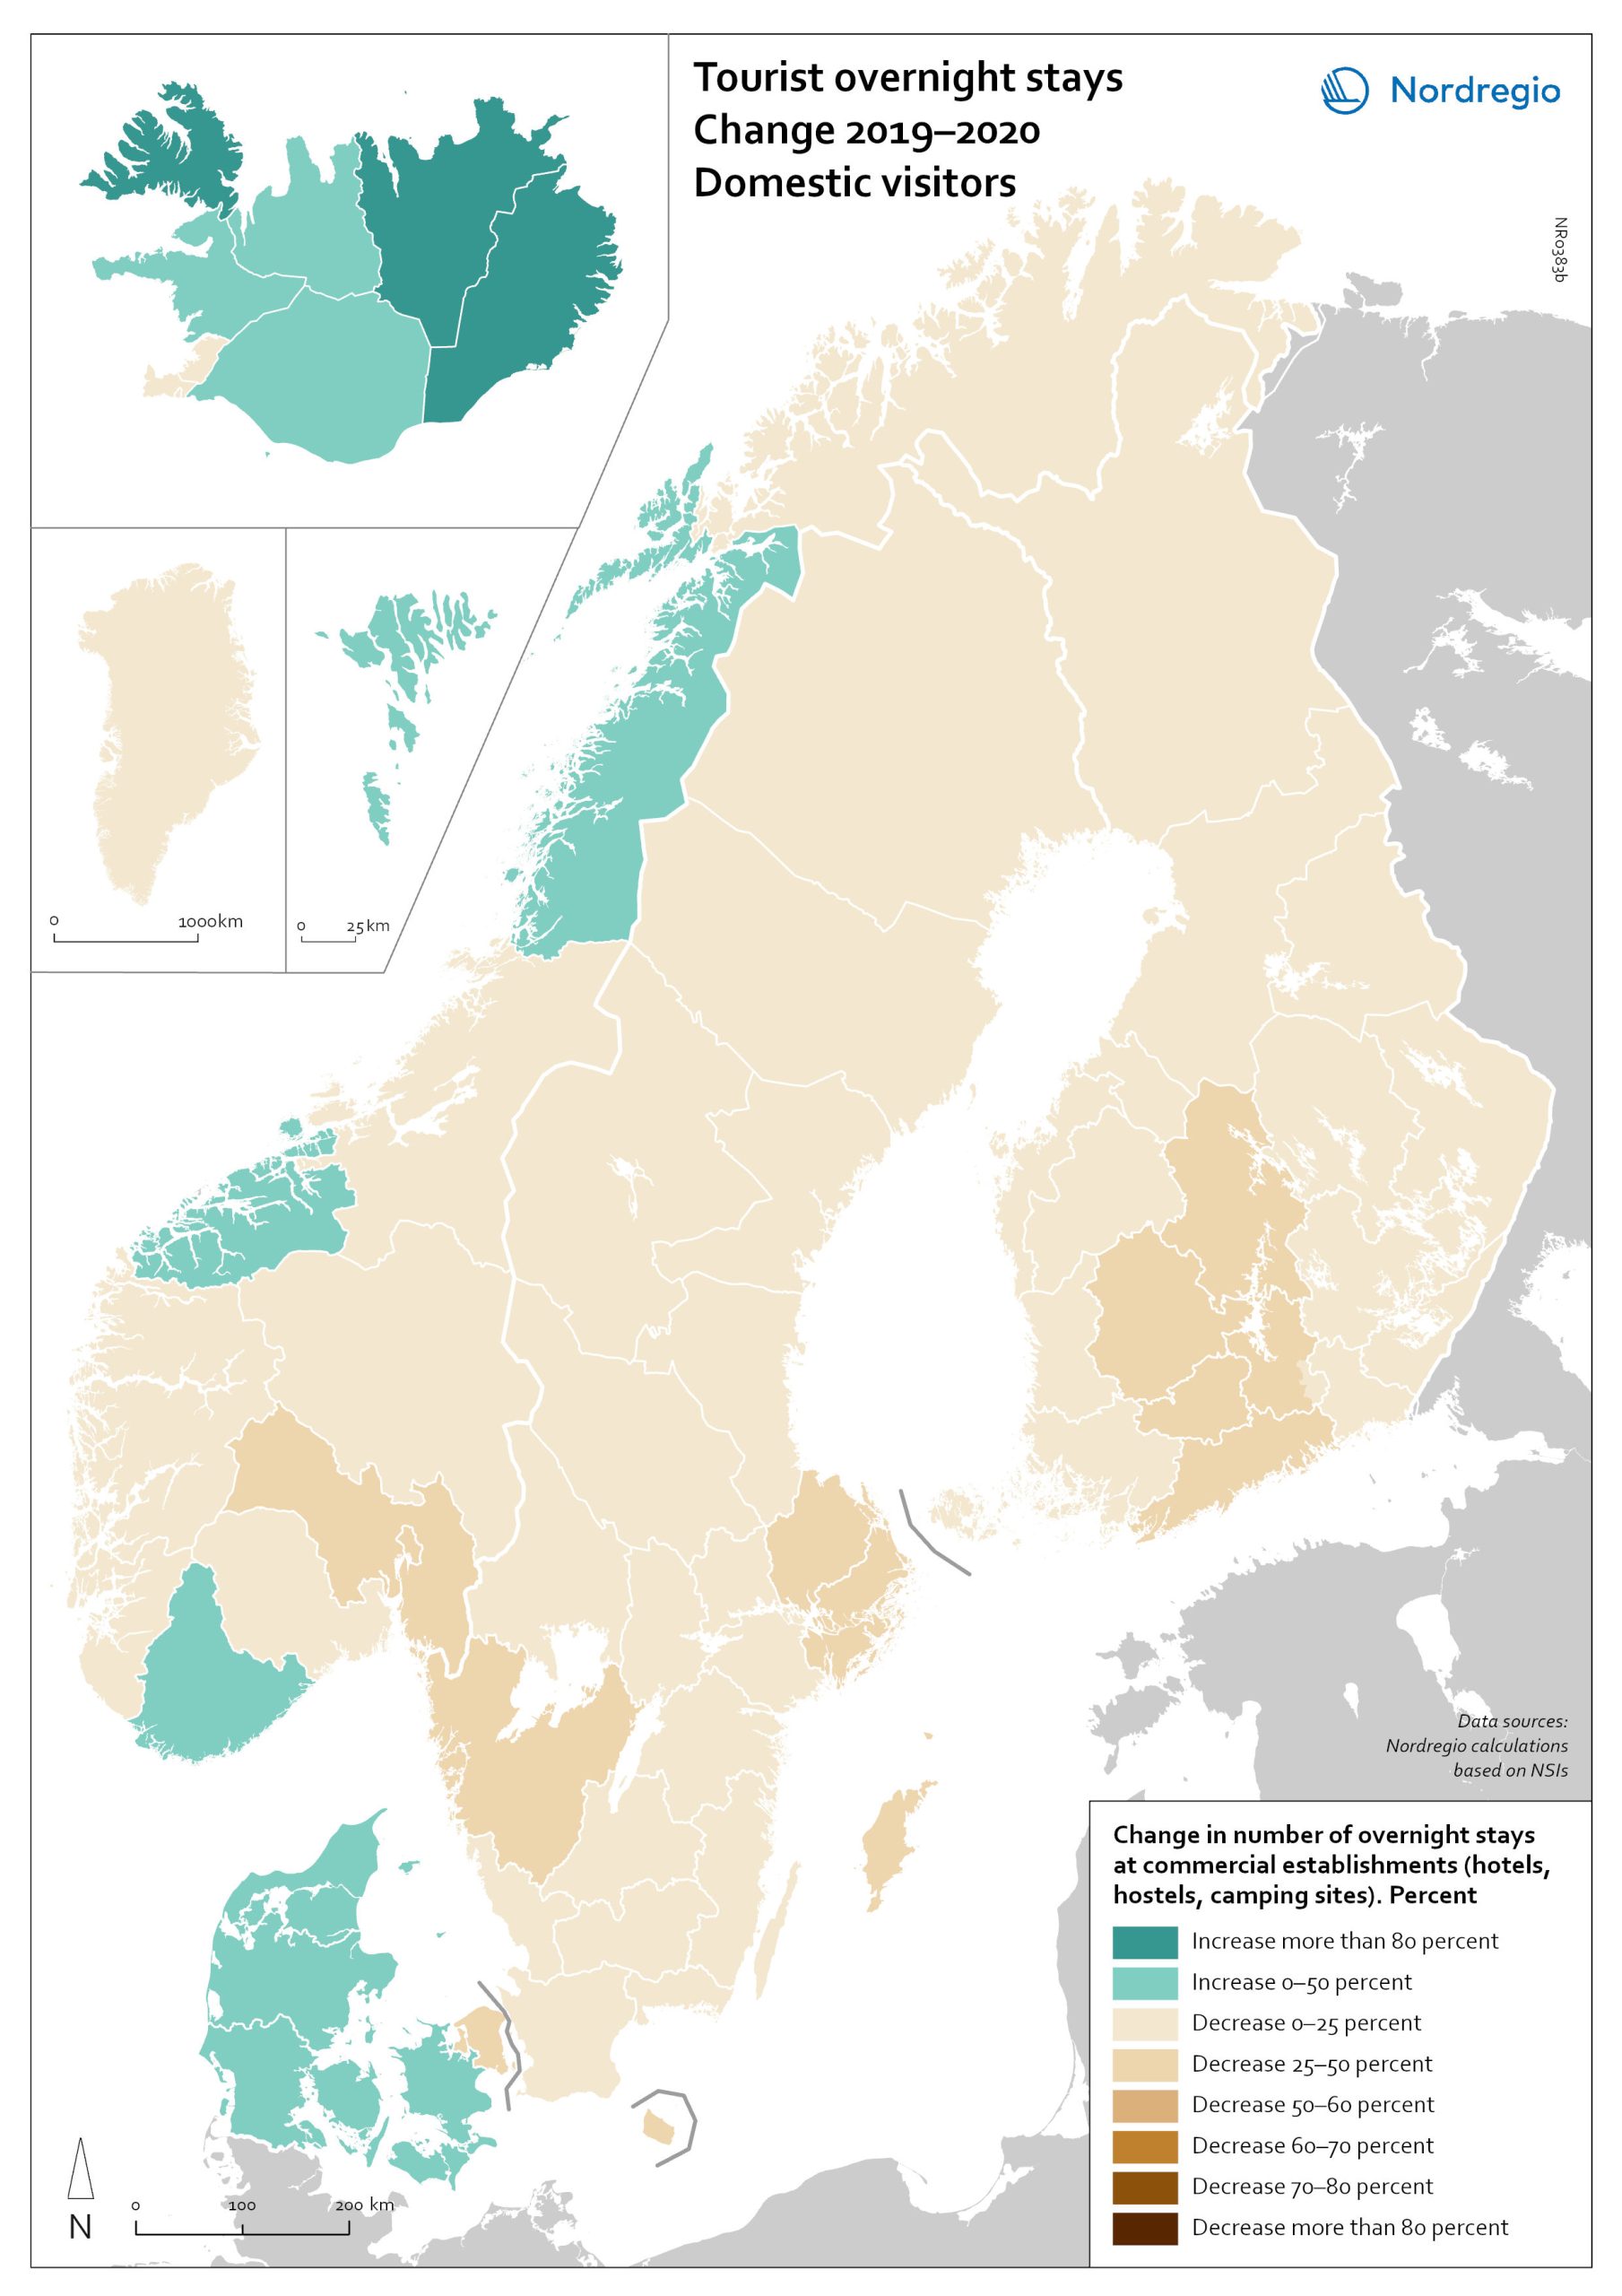
Change in overnight stays for domestic visitors 2019–2020
The map shows the relative change in the number of overnight stays at the regional level between 2019 and 2020 for domestic visitors. This map is related to the same map showing change in overnight stays for foreign visitors 2019–2020. The sharpest fall in visitors from abroad was in destinations where foreign tourists usually make up a high proportion of the total visitors. This is particularly relevant to islands like Åland (89% decrease on foreign visitors, from early 2019 to mid-2020) and to Iceland (66-77% drop depending on region). Lofoten and Nordland County in Norway, as well as Western Norway with Møre and Romsdal, which also have a high proportion of international tourists during the summer season due to their scenic landscape, also recorded sharp falls of 77-79% on foreign visitors during the same period. In Finland, the lake district (South Savo) and Southern Karelia, as well as the coastal Central Ostrobothnia (major cities Vasa and Karleby), recorded a 75-77% drop in the number of visitors from abroad. The fall here was mainly due to the lack of tourists from Russia. Even Finnish Lapland suffered a major fall in international visits during the winter peak period. For many local businesses that rely heavily on winter holidaymakers, the 2021/22 winter was a make-or-break season. In Sweden, the regions of Kalmar, Västra Götaland, Värmland and Örebro lost 77–79% of visitors from abroad, probably due to much fewer visitors from neighbouring Norway and from Denmark. In Denmark, the number of overnight stays by visitors from abroad to the Capital Region was down by 73%, whereas the number of domestic visitors declined by 27%. No region lost as many overnight visitors, both from abroad and domestic, as the capital cities and larger urban areas in the Nordic countries. Copenhagen, Oslo, Stockholm, Helsinki and Reykjavik…
- 2022 March
- Nordic Region
- Tourism
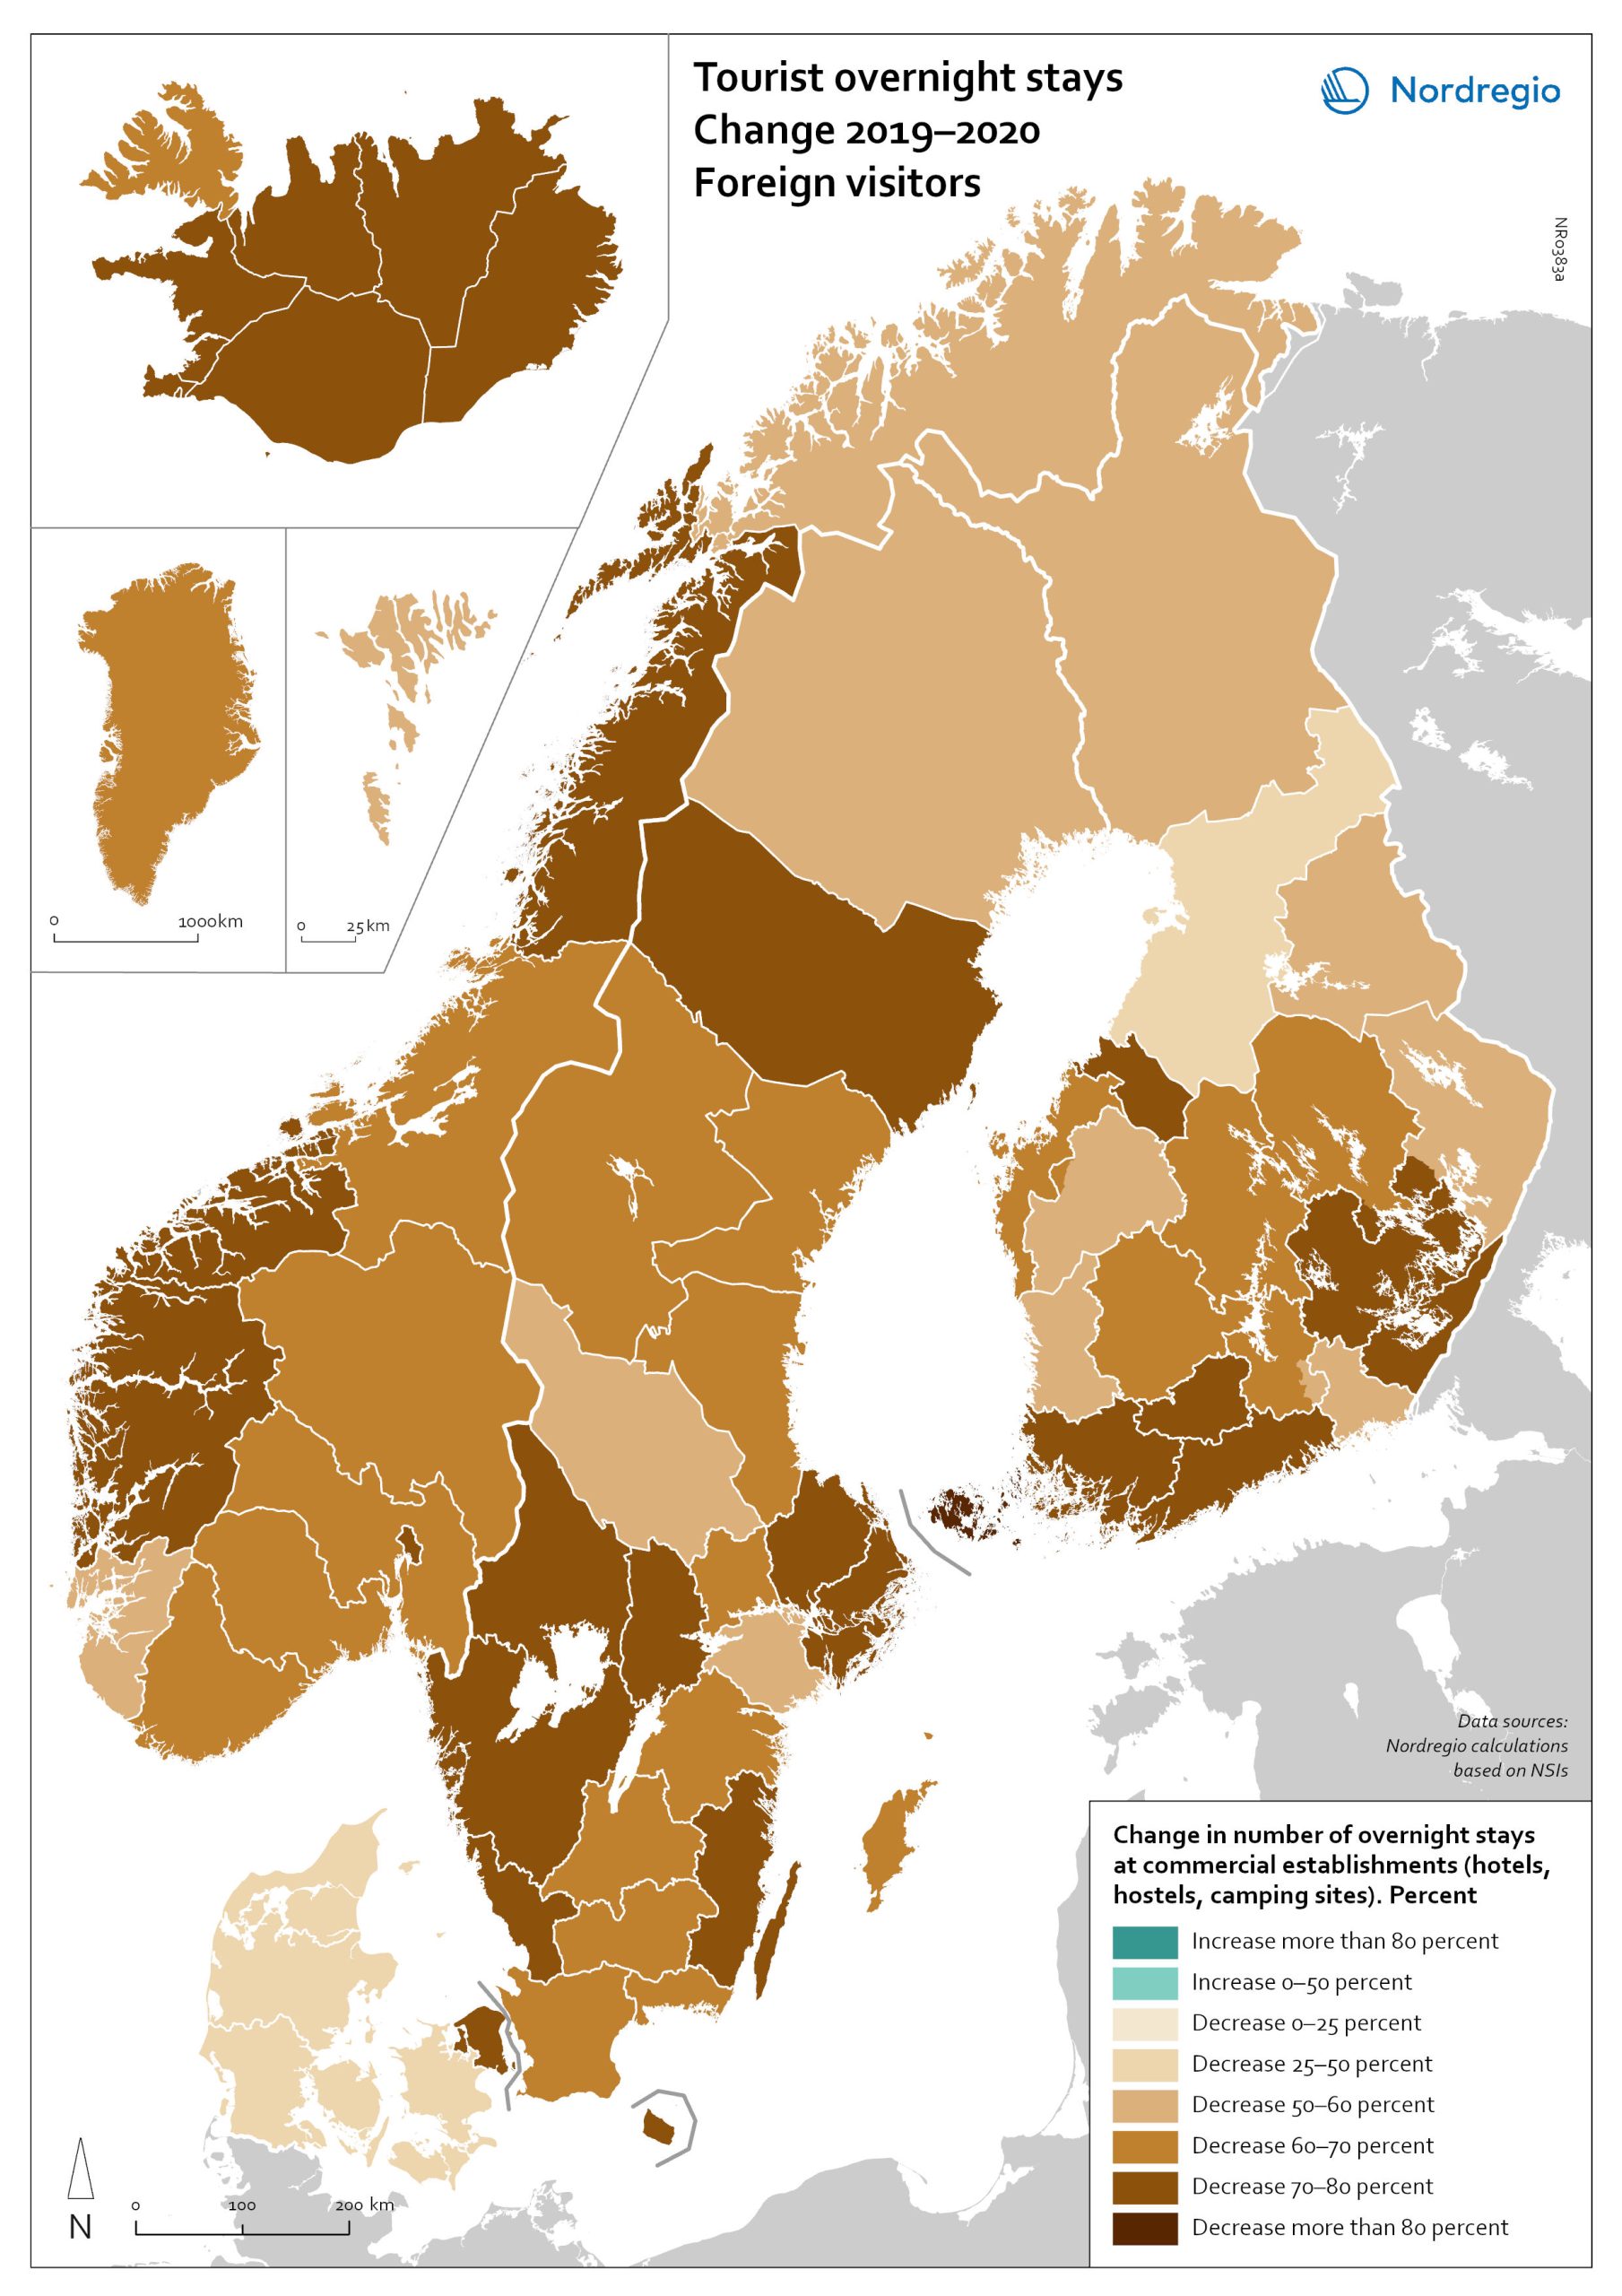
Change in overnight stays for foreign visitors 2019–2020
The map shows the relative change in the number of overnight stays at the regional level between 2019 and 2020 for foreign visitors. This map is related to the same map showing change in overnight stays for domestic visitors 2019–2020. The sharpest fall in visitors from abroad was in destinations where foreign tourists usually make up a high proportion of the total visitors. This is particularly relevant to islands like Åland (89% decrease on foreign visitors, from early 2019 to mid-2020) and to Iceland (66-77% drop depending on region). Lofoten and Nordland County in Norway, as well as Western Norway with Møre and Romsdal, which also have a high proportion of international tourists during the summer season due to their scenic landscape, also recorded sharp falls of 77-79% on foreign visitors during the same period. In Finland, the lake district (South Savo) and Southern Karelia, as well as the coastal Central Ostrobothnia (major cities Vasa and Karleby), recorded a 75-77% drop in the number of visitors from abroad. The fall here was mainly due to the lack of tourists from Russia. Even Finnish Lapland suffered a major fall in international visits during the winter peak period. For many local businesses that rely heavily on winter holidaymakers, the 2021/22 winter was a make-or-break season. In Sweden, the regions of Kalmar, Västra Götaland, Värmland and Örebro lost 77–79% of visitors from abroad, probably due to much fewer visitors from neighbouring Norway and from Denmark. In Denmark, the number of overnight stays by visitors from abroad to the Capital Region was down by 73%, whereas the number of domestic visitors declined by 27%. No region lost as many overnight visitors, both from abroad and domestic, as the capital cities and larger urban areas in the Nordic countries. Copenhagen, Oslo, Stockholm, Helsinki and Reykjavik…
- 2022 March
- Nordic Region
- Tourism
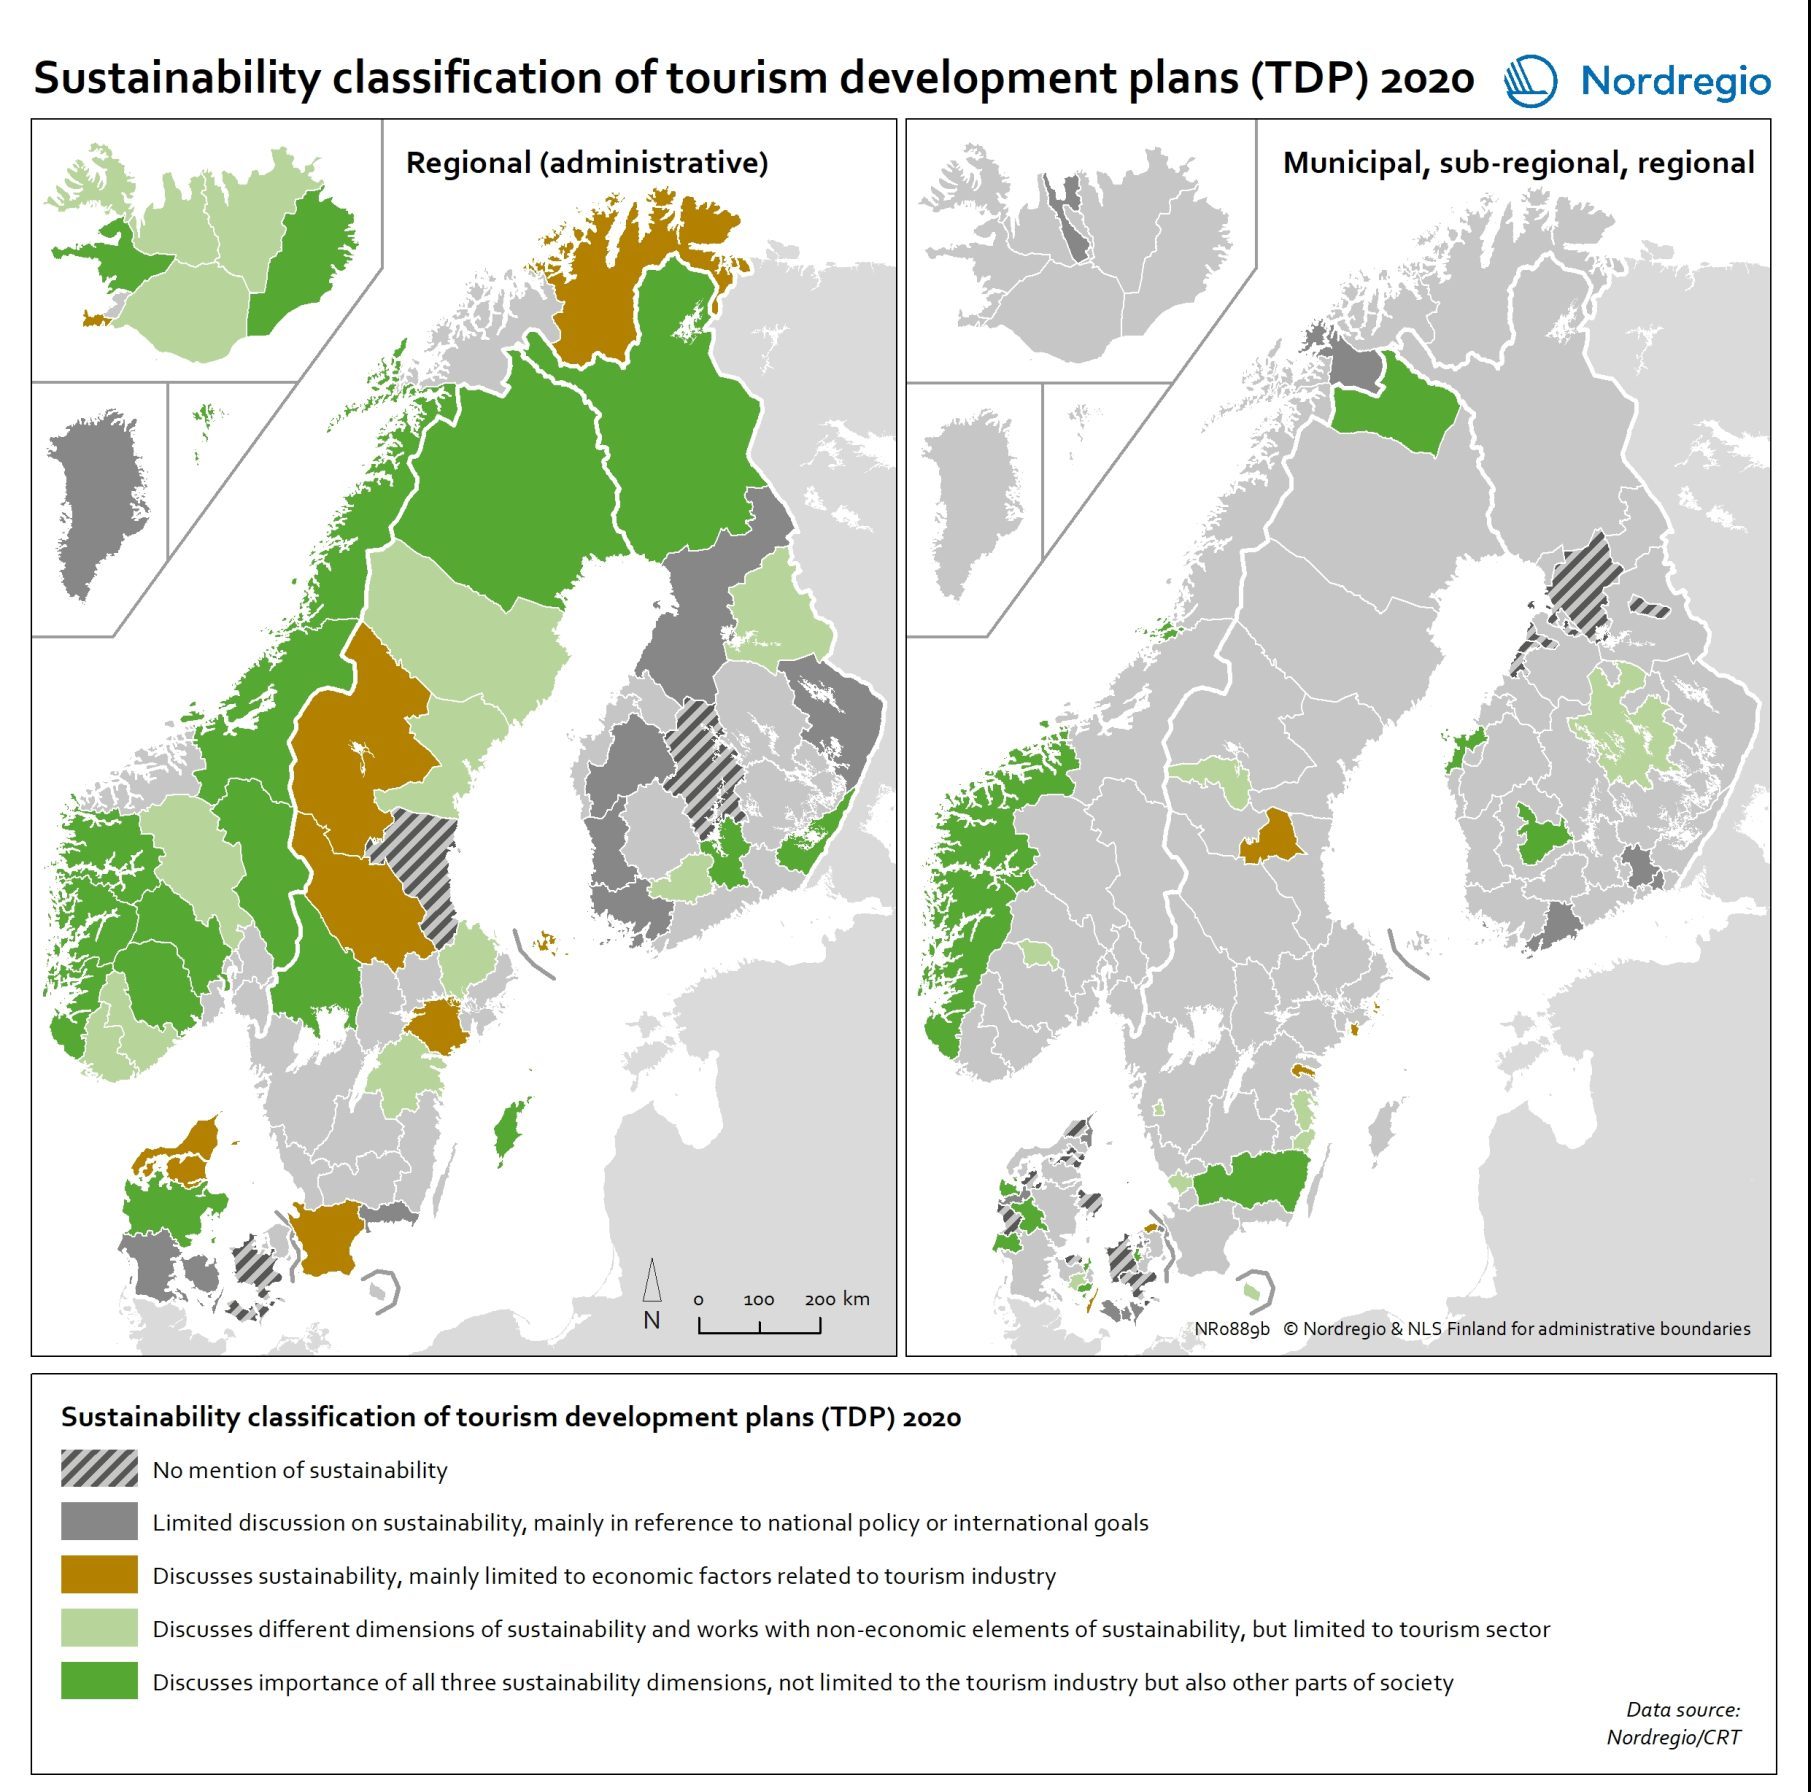
Sustainability classification of tourism development plans (TDPs)
This map indicates the distribution of different TDP sustainability concern treatment classes in the Nordic Region in 2020 Sustainability is seen as an important part of the tourism development in large parts of the Nordic rural regions, at least on paper. Some tourism policies even state it as the point of departure, the light that guides the way in everything that tourism involves. A growing public awareness of the need to transition to more sustainable practices, increased public pressure, along with political statements and commitments to do so, means that we should expect to find sustainability concerns and the SDGs strongly reflected in sub-national plans for tourism development, too. In this map, the dotted areas represent those TDPs that do not mention sustainability in any way. These mainly come from Denmark, as well as a few from Finland, Norway, and Sweden. The grey areas represent TDPs who mention the concept of sustainability, but in a very limited way, as a reference to an overall, global or international or national agenda, but without further operationalising or setting any goals regarding this for the local context. This type of treatment of sustainability concerns is mainly present in Finland, followed by Denmark and Sweden, plus a few cases from Norway and Iceland. Together, these two types represent almost two out of every five TDPs. They greyish green areas represent those TDPs which limit their discussion of sustainability to the economic sustainability of tourism businesses. This type of TDP is mainly found in Sweden, followed by Denmark, and then a case from each from Finland, Norway and Iceland. The green areas, which represent just under half of the TDPs, engage in a holistic treatment of sustainability concerns, including their economic, social and environmental aspects. The light green TDPs, with a tourism-centred sustainability treatment, come…
- 2021 December
- Nordic Region
- Tourism


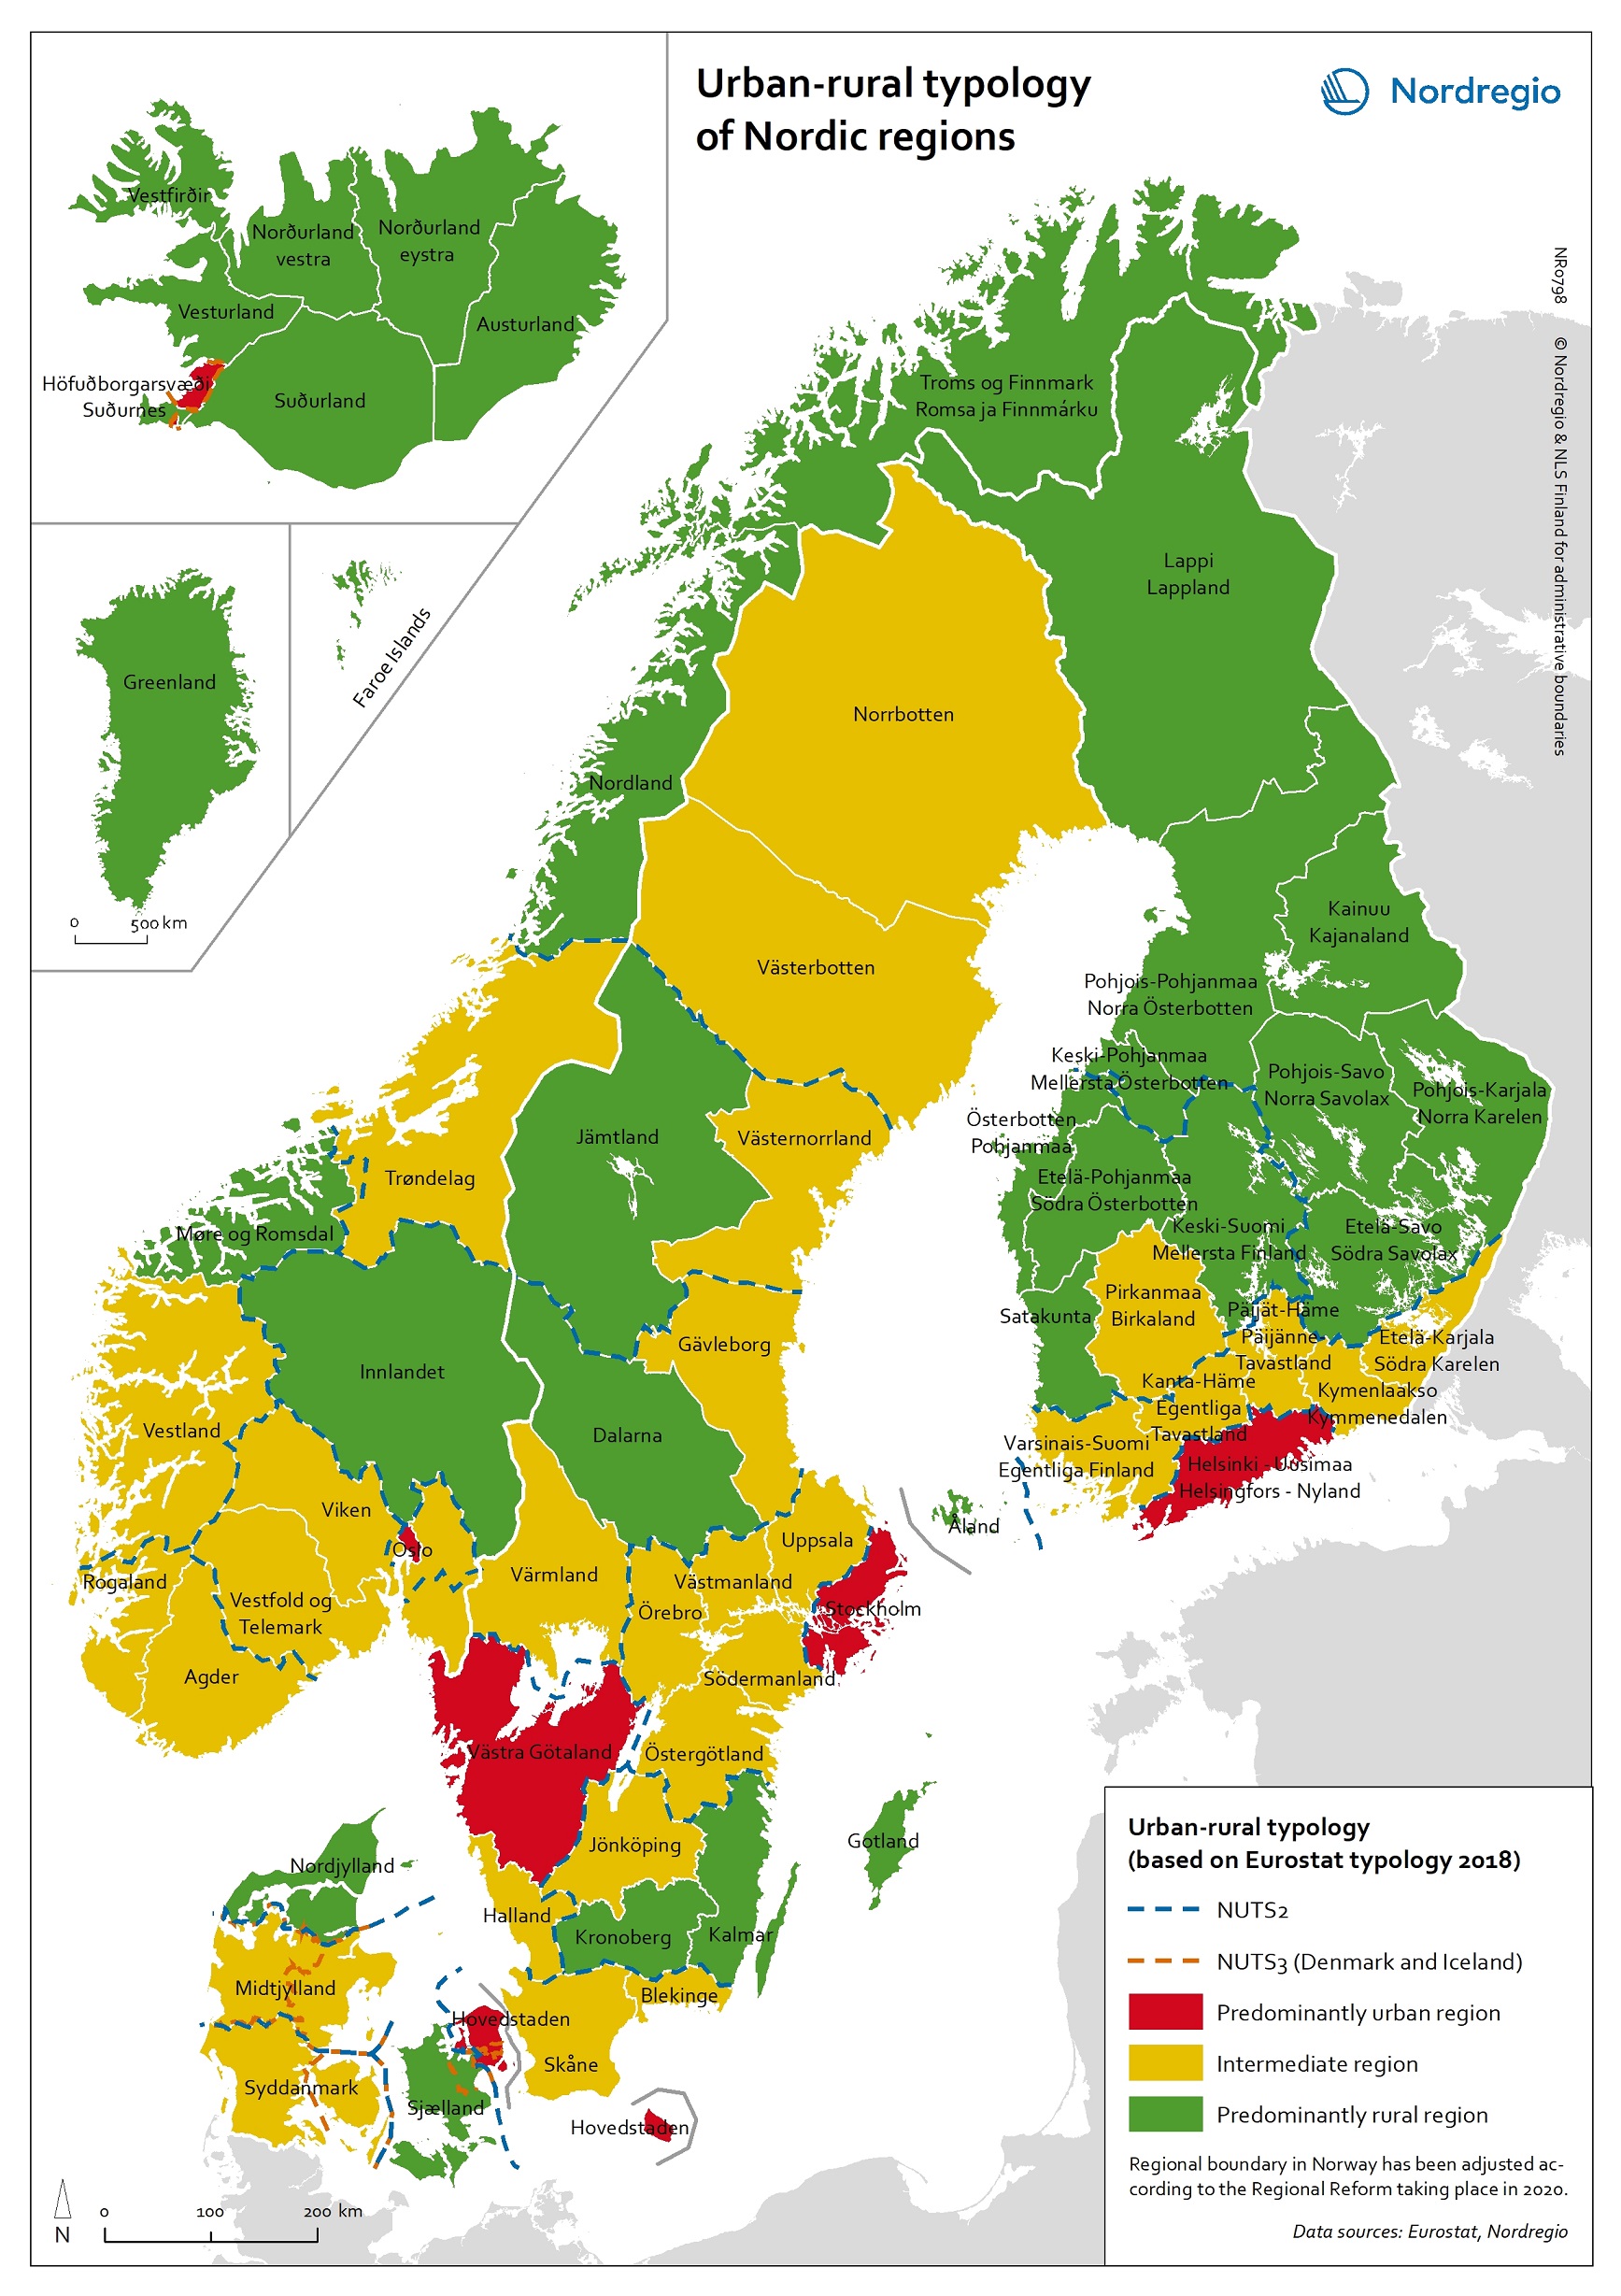
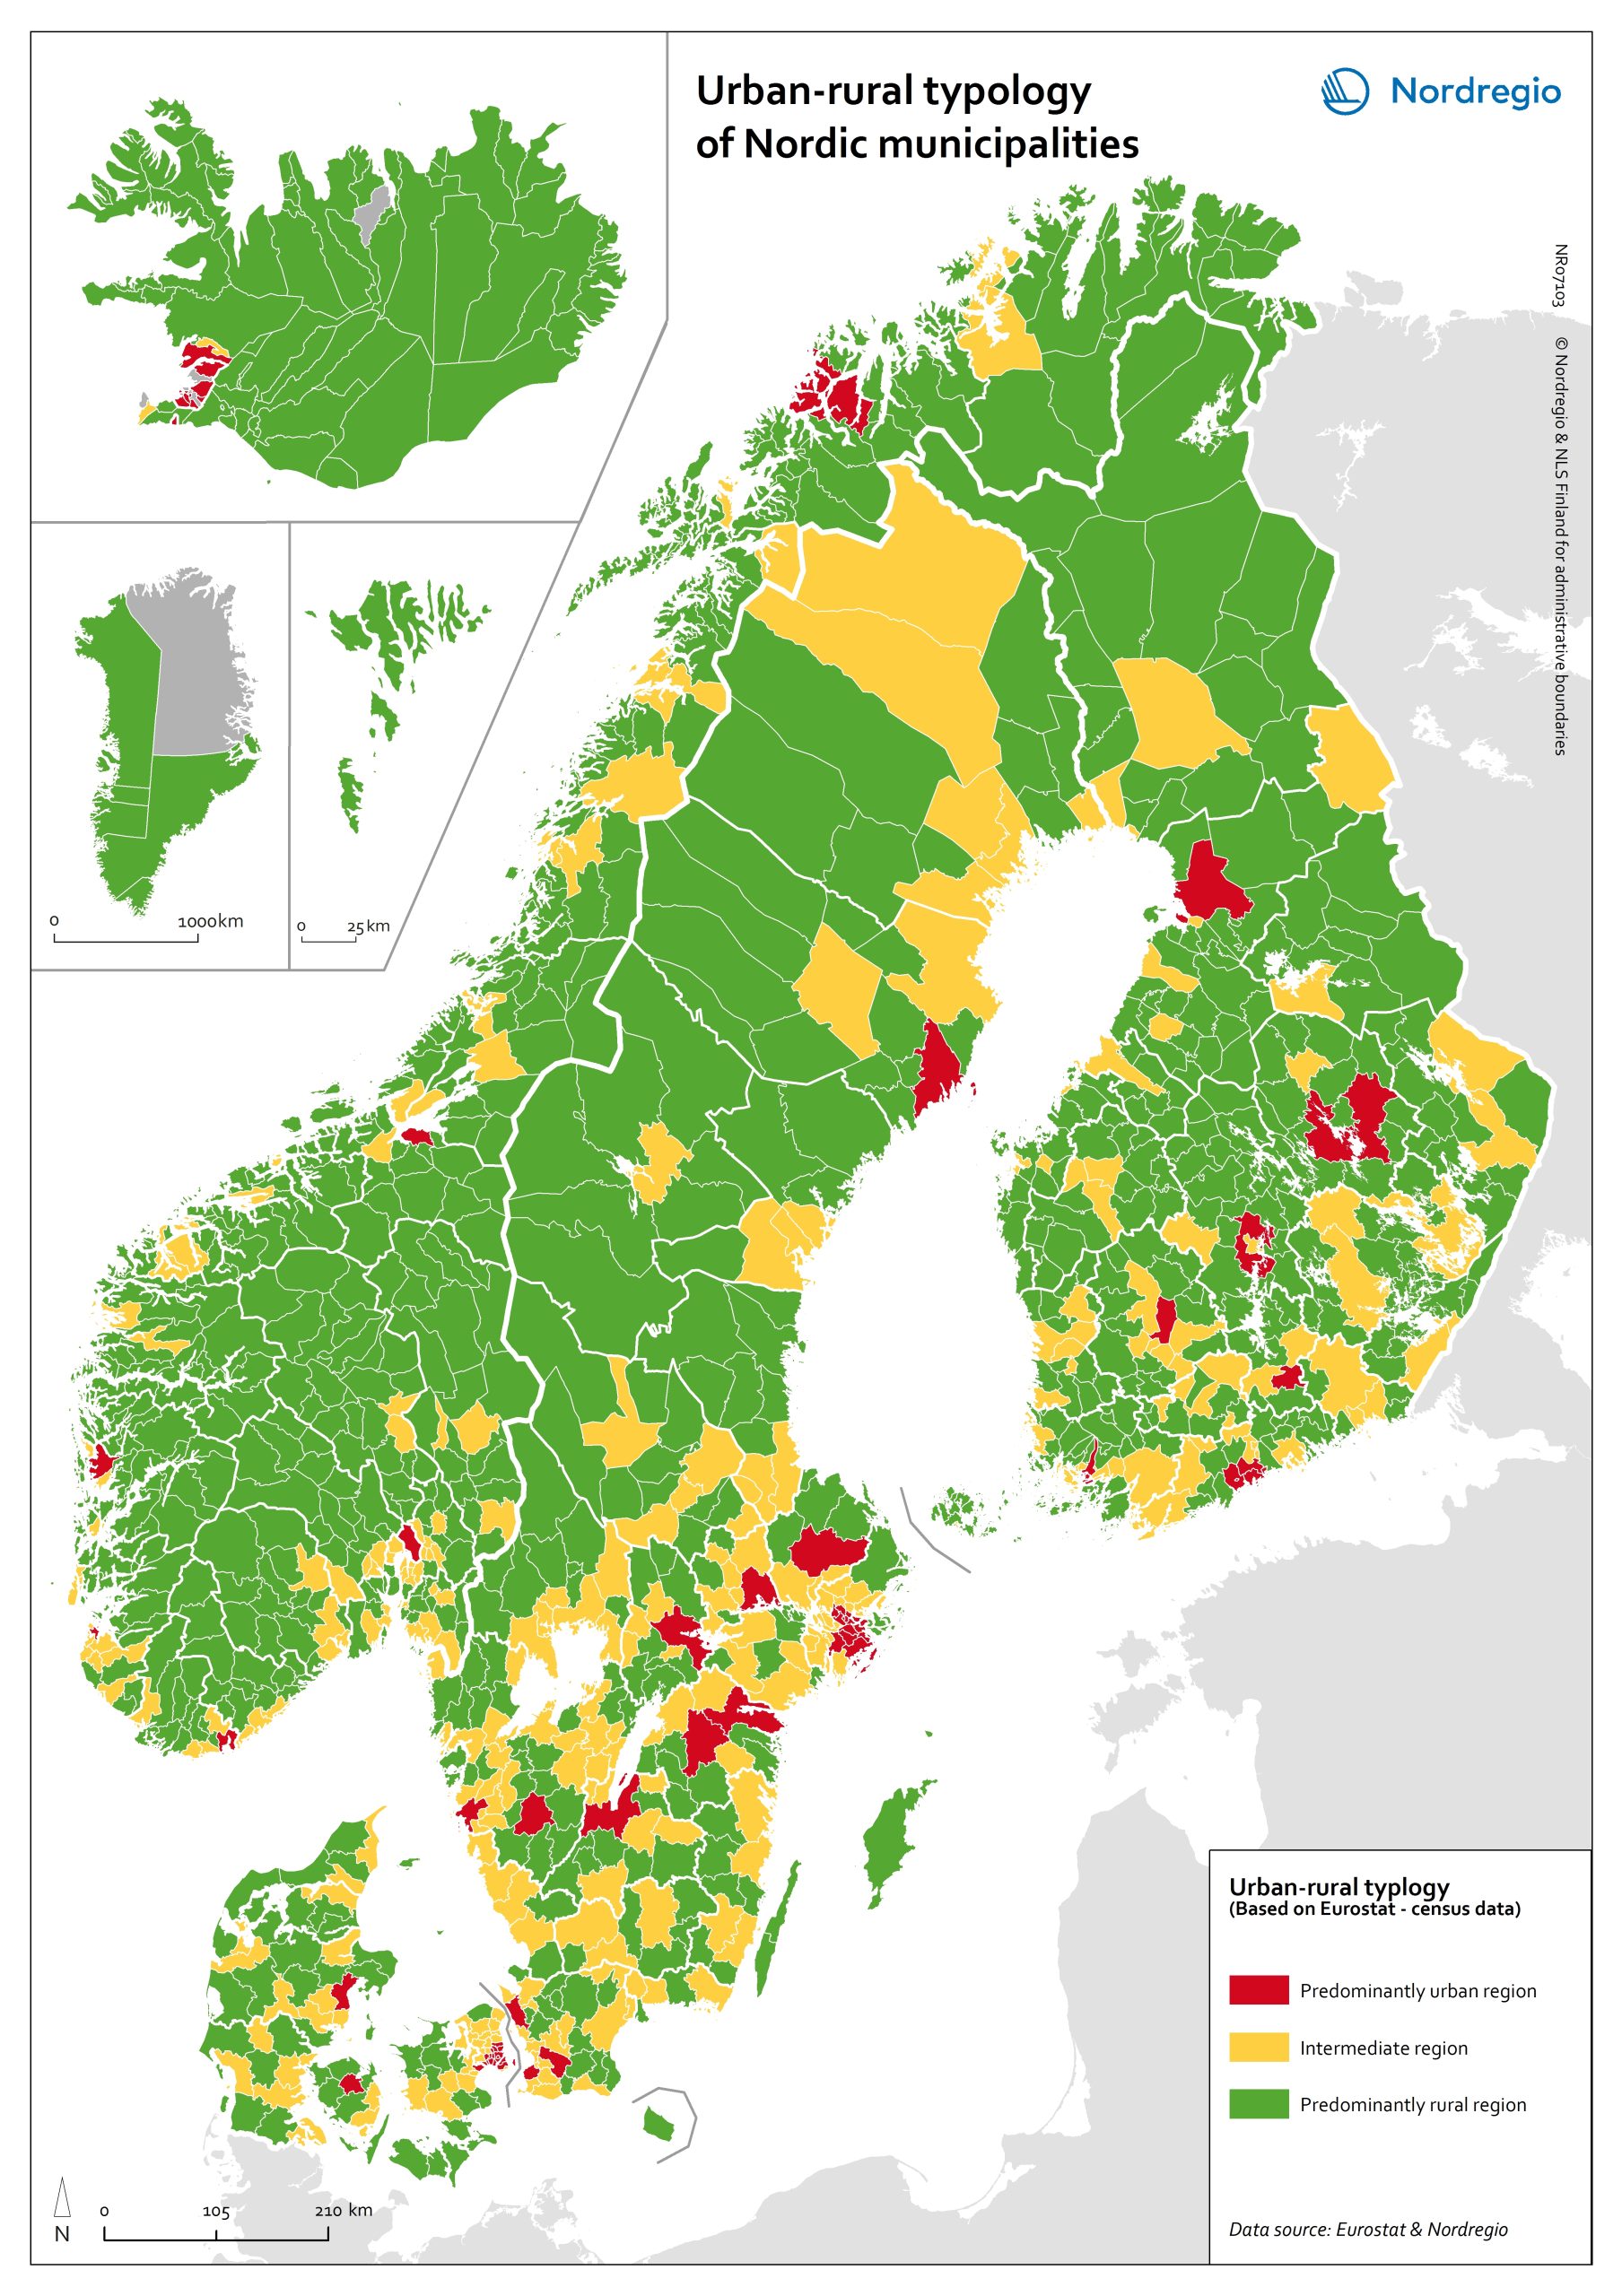
Urban-rural typology of the Nordic regions 2020
This map is included in the introduction of the State of the Nordic Region 2020 report. The map is based on the typology provided by Eurostat (2018), in which the 2016 NUTS 3 regions are classified in three categories according to their population density in 2011 and 2015, in 1 km² grids. In predominantly urban regions, at least 80% of the total population is urban, while in intermediate regions, 50–80% of the population lives in urban clusters. In regions that are predominantly rural, less than 50% of the population lives in urban areas. Read the digital publication here.
- 2020 February
- Administrative and functional divisions
- Nordic Region