61 Maps
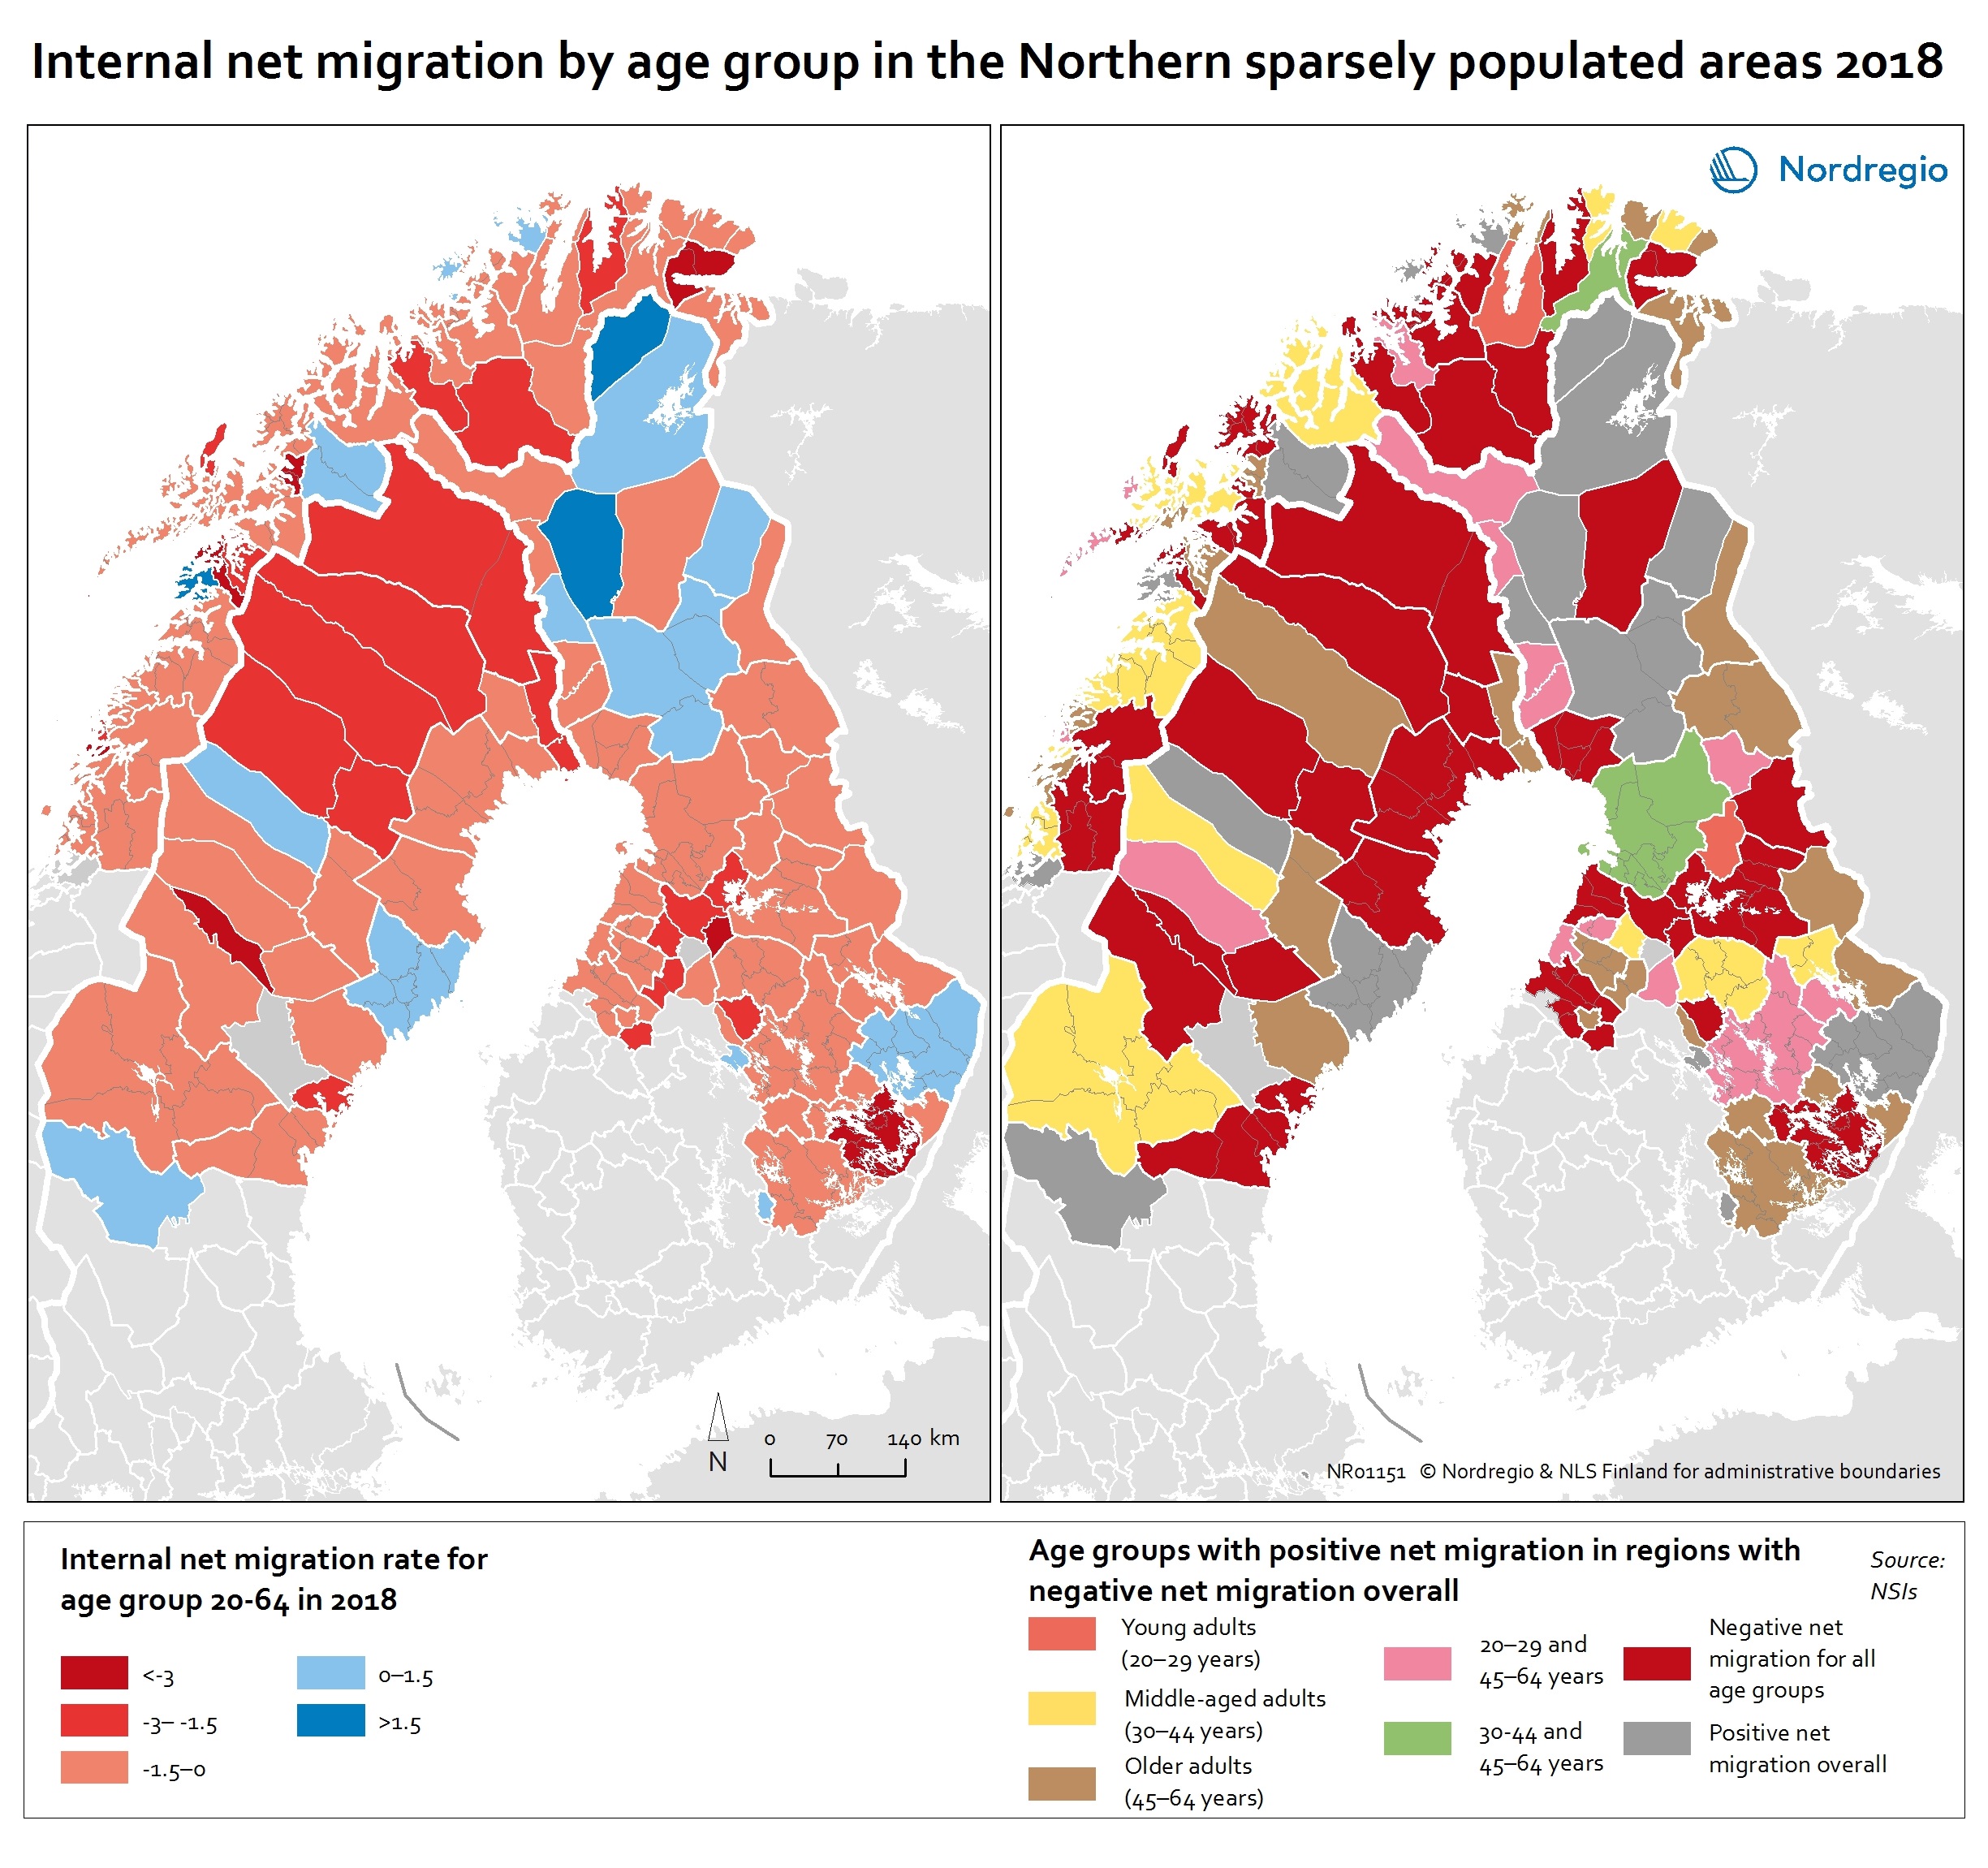
Internal net migration by age group in the Northern sparsely populated areas 2018
This map shows the internal net migration rate in 2018 (left map) and net migration by age group (right map) in local labour market areas of the Northern sparsely populated areas in 2018 The map on left shows the internal net migration rate in the NSPAs in 2018. Although many regions experienced negative net migration, this was not the case for all segments of the population. The map on the right of shows the age groups in which more people moved in than moved out, despite these regions having negative net migration overall. The red colours on the map on the left indicates a net out-migration, while the blue colours indicate a positive net migration. In the map on the right, the red colours indicate net out-migration for all age groups and the grey positive net migration overall. The other colours indicate age groups with a positive net migration (while having negative net migration overall). Inward and outward migration are slightly different in the local labour market areas (LLMAs) compared to the independent labour markets. Among the LLMAs, Rovaniemi is the only one that has positive net migration in all age groups. This positive development may be due to the number of governmental offices, the strength of the tourism industry and the presence of two universities. On the contrary, 18 local labour market areas– four in Sweden, nine in Norway and five in Finland – have negative net migration in all age groups. Out-migration of young adults is seen in most of LLMAs, the exceptions being Umeå, Målsev, Joensuu and Oulu. The inflows of young adults in these regions reflect the presence of the universities in Umeå, Joensuu and Oulu and the army bases in Målselv. Despite this positive inflow, most of these LLMAs are unable to retain adults in…
 2020 February
 - Demography
- Labour force
- Migration
- NSPA and North Atlantic
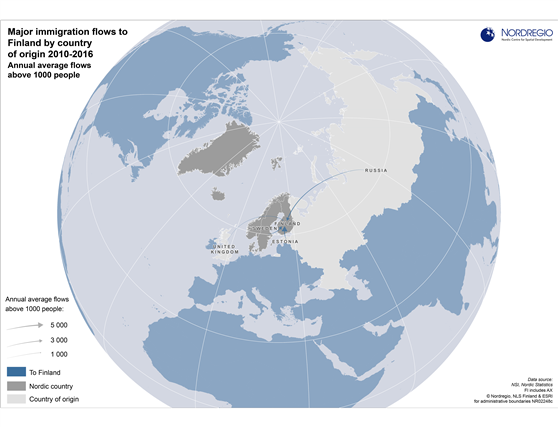
Major immigration flows to Finland 2010-2016
Average annual flows above 1000 people by country of origin Migration flows by country of origin are of growing interest in the Nordic Region due to the recent unprecedented inflows of migrants. There are also interesting differences between the Nordic countries with respect to the dominant countries of origin of migrants and the size of inflows. Finland had only four inflows exceeding annual averages of 1000 people during the measured period. The inflow from Estonia was by far the largest, an annual average of around 5000 people, flowed by inflows from Sweden and Russia (just under 3000), and the United Kingdom (around 1000).
- 2017 June
- Demography
- Finland
- Migration
- Nordic Region
- Other
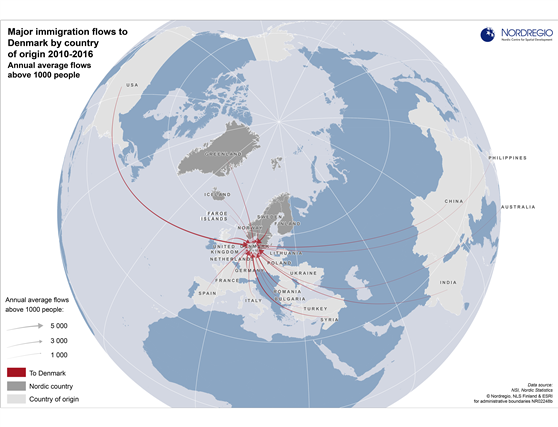
Major immigration flows to Denmark 2010-2016
Average annual flows above 1000 people by country of origin Migration flows by country of origin are of growing interest in the Nordic Region due to the recent unprecedented inflows of migrants. There are also interesting differences between the Nordic countries with respect to the dominant countries of origin of migrants and the size of inflows. During the measured period, there were more than 23 average annual inflows to Denmark that exceeded 1000 people. However, none of these inflows were as large as the dominant inflows to Norway and Sweden during the same period. The largest inflows to Denmark were around 5000 people each from U.S., Sweden, Germany and Poland. Due to historic and political connections, Denmark, unlike Norway, Finland and Sweden, had substantial annual inflows from the Faroe Islands, Greenland and Iceland (around 1000 or 2000 each). These numbers are particularly notable in the context of the small populations of
- 2017 June
- Demography
- Migration
- Nordic Region
- Other
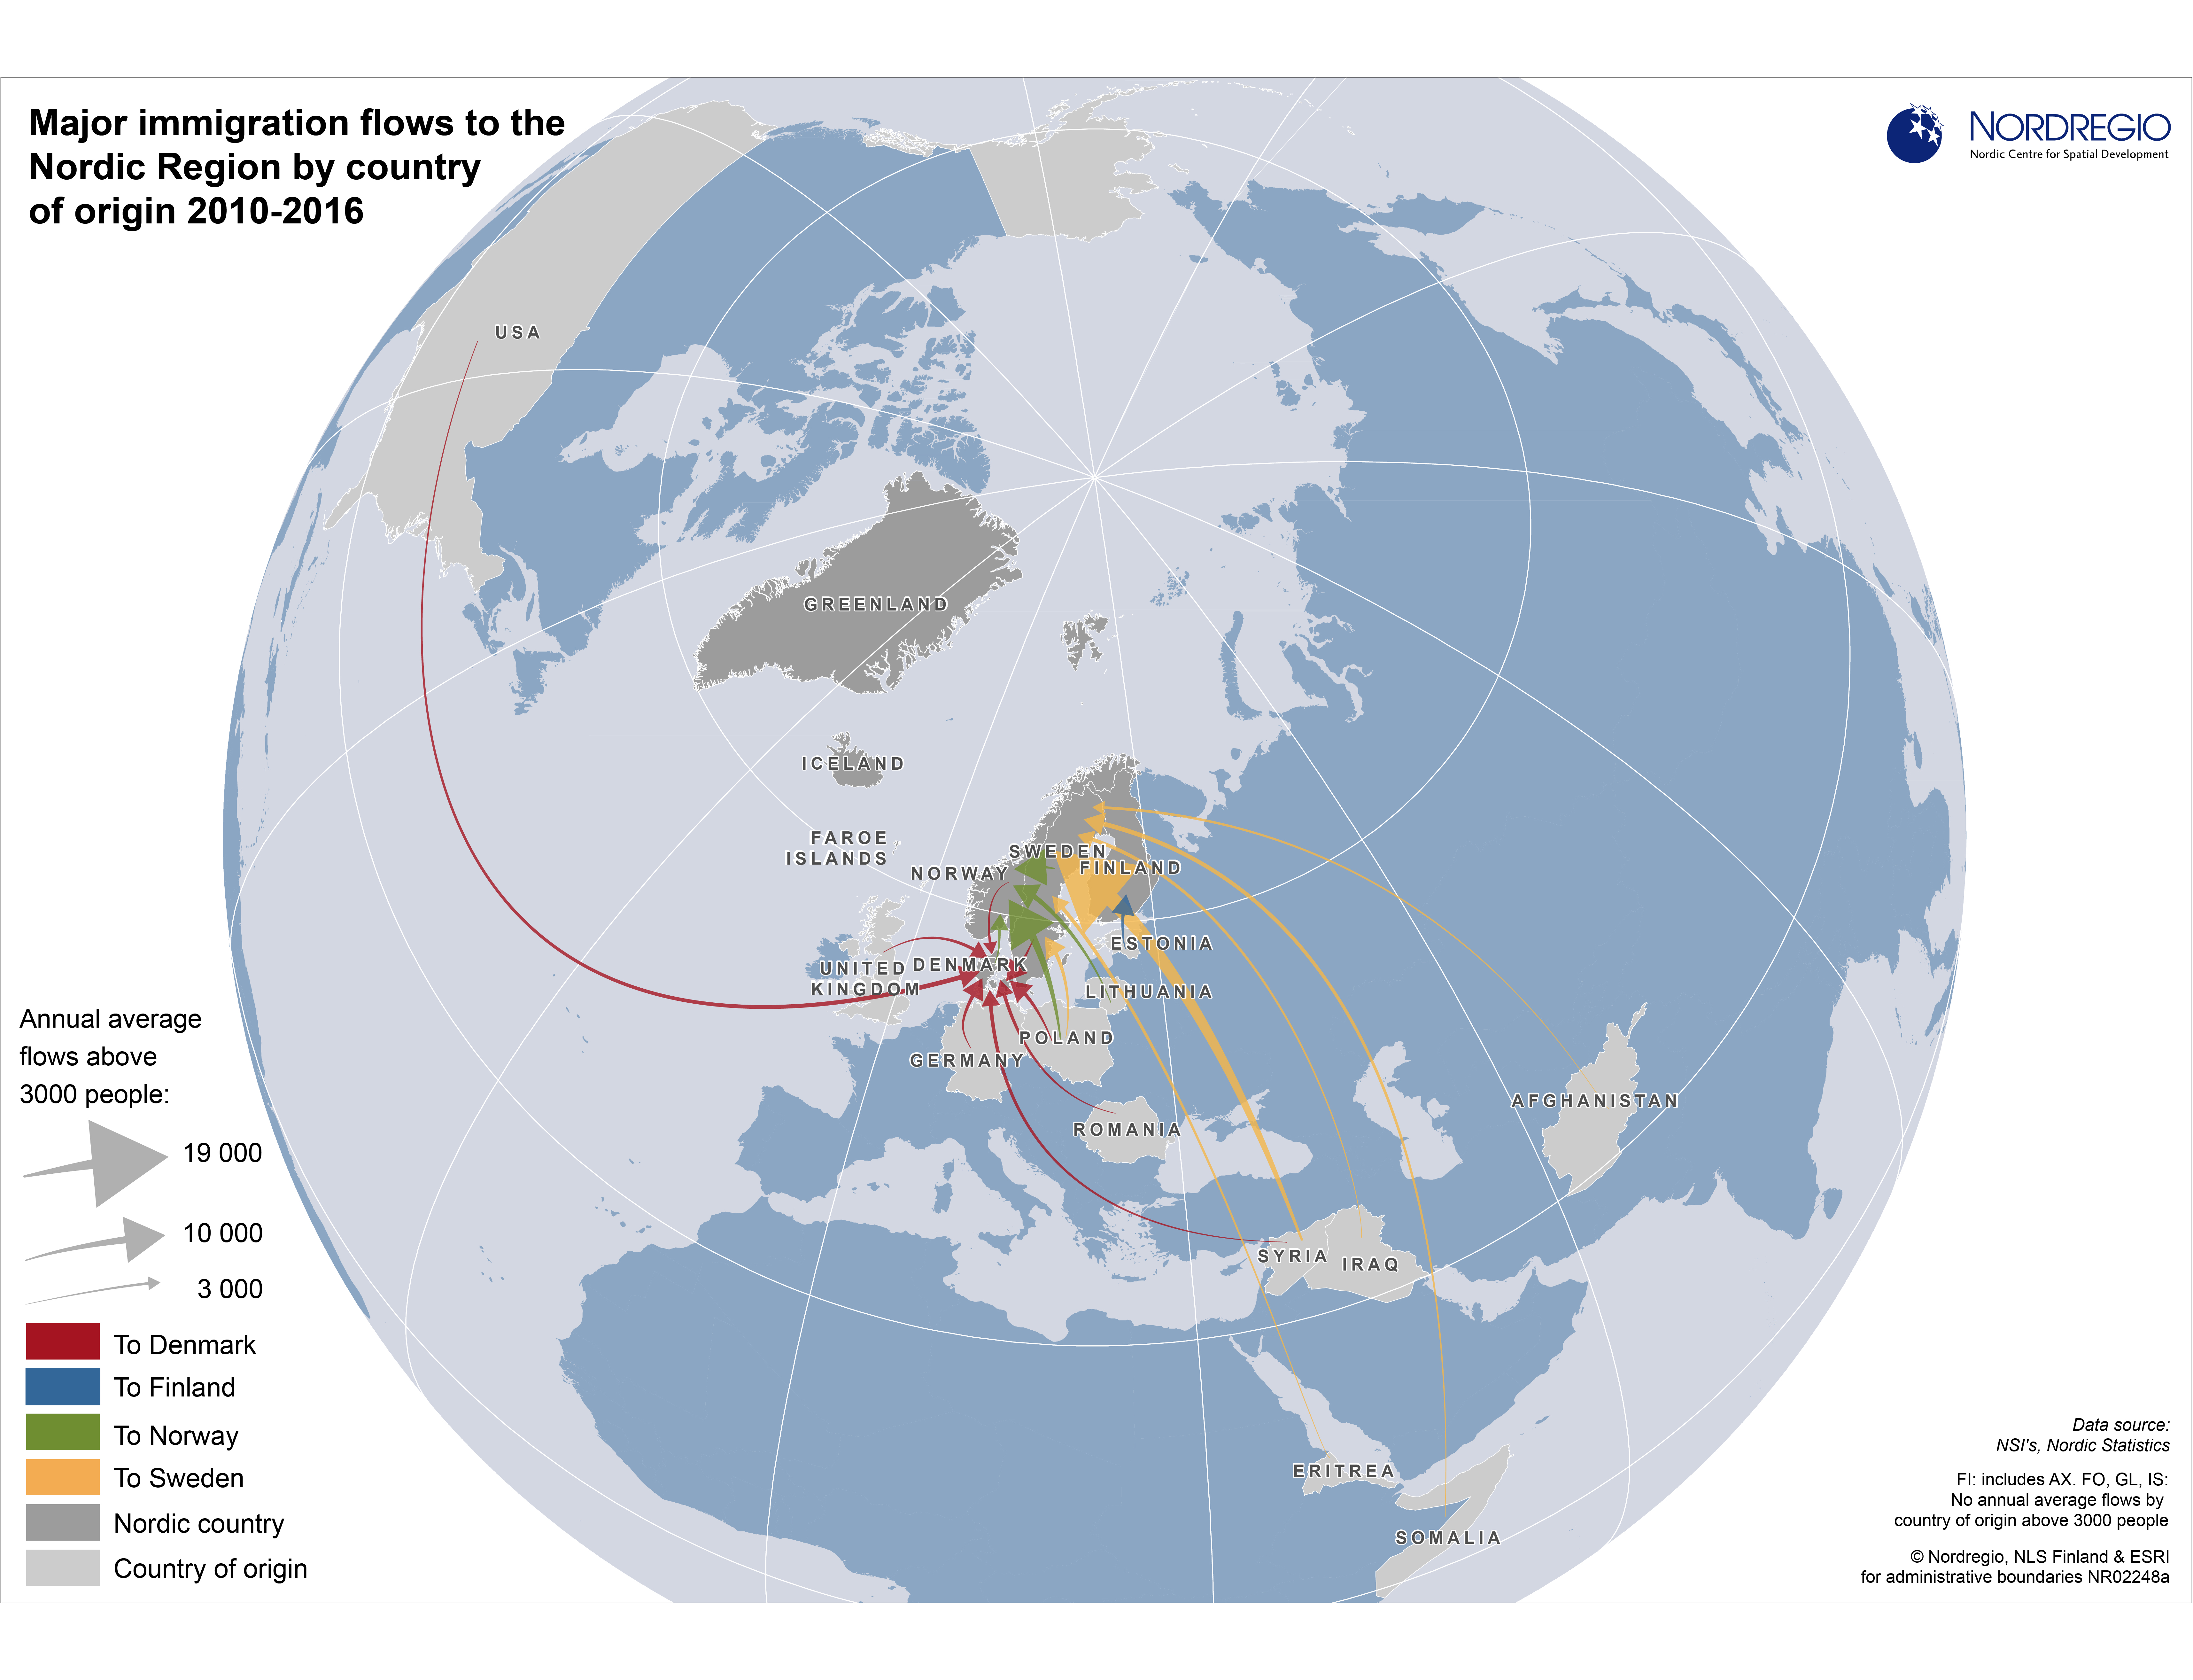
Major immigration flows to the Nordic Region 2010-2016
Average annual flows above 3000 people by country of origin Migration flows by country of origin are of growing interest in the Nordic Region due to the recent unprecedented inflows of migrants. There are also interesting differences between the Nordic countries with respect to the dominant countries of origin of migrants and the size of inflows. The map shows some clear spatial patterns regarding the dominant countries of origin of migrants and the size of inflows to each of the Nordic countries. Finland had only one average annual inflow of over 3000 people during the measured period, namely from Estonia. Compared to the other Nordic countries, Sweden had by far the largest immigrant flows, with average annual arrivals of nearly 19 000 immigrants from Syria, around 5000 from both Somalia and Poland, about 4000 from Iraq and Eritrea, and circa 3000 from Afghanistan, India, China and Iran. For Norway, inflows above 3000 people were all from nearby countries: Sweden, Lithuania, Denmark, and Poland. Inflows from Poland were particularly high – an annual average of almost 11 000 people. Although Denmark experienced a similar number of inflows above 3000 people, these inflows were smaller and more evenly distributed than in Norway and Sweden. The largest inflows were around 5000 people and included migrants from the U.S., Sweden, Germany and Poland.
- 2017 June
- Demography
- Migration
- Nordic Region
- Other
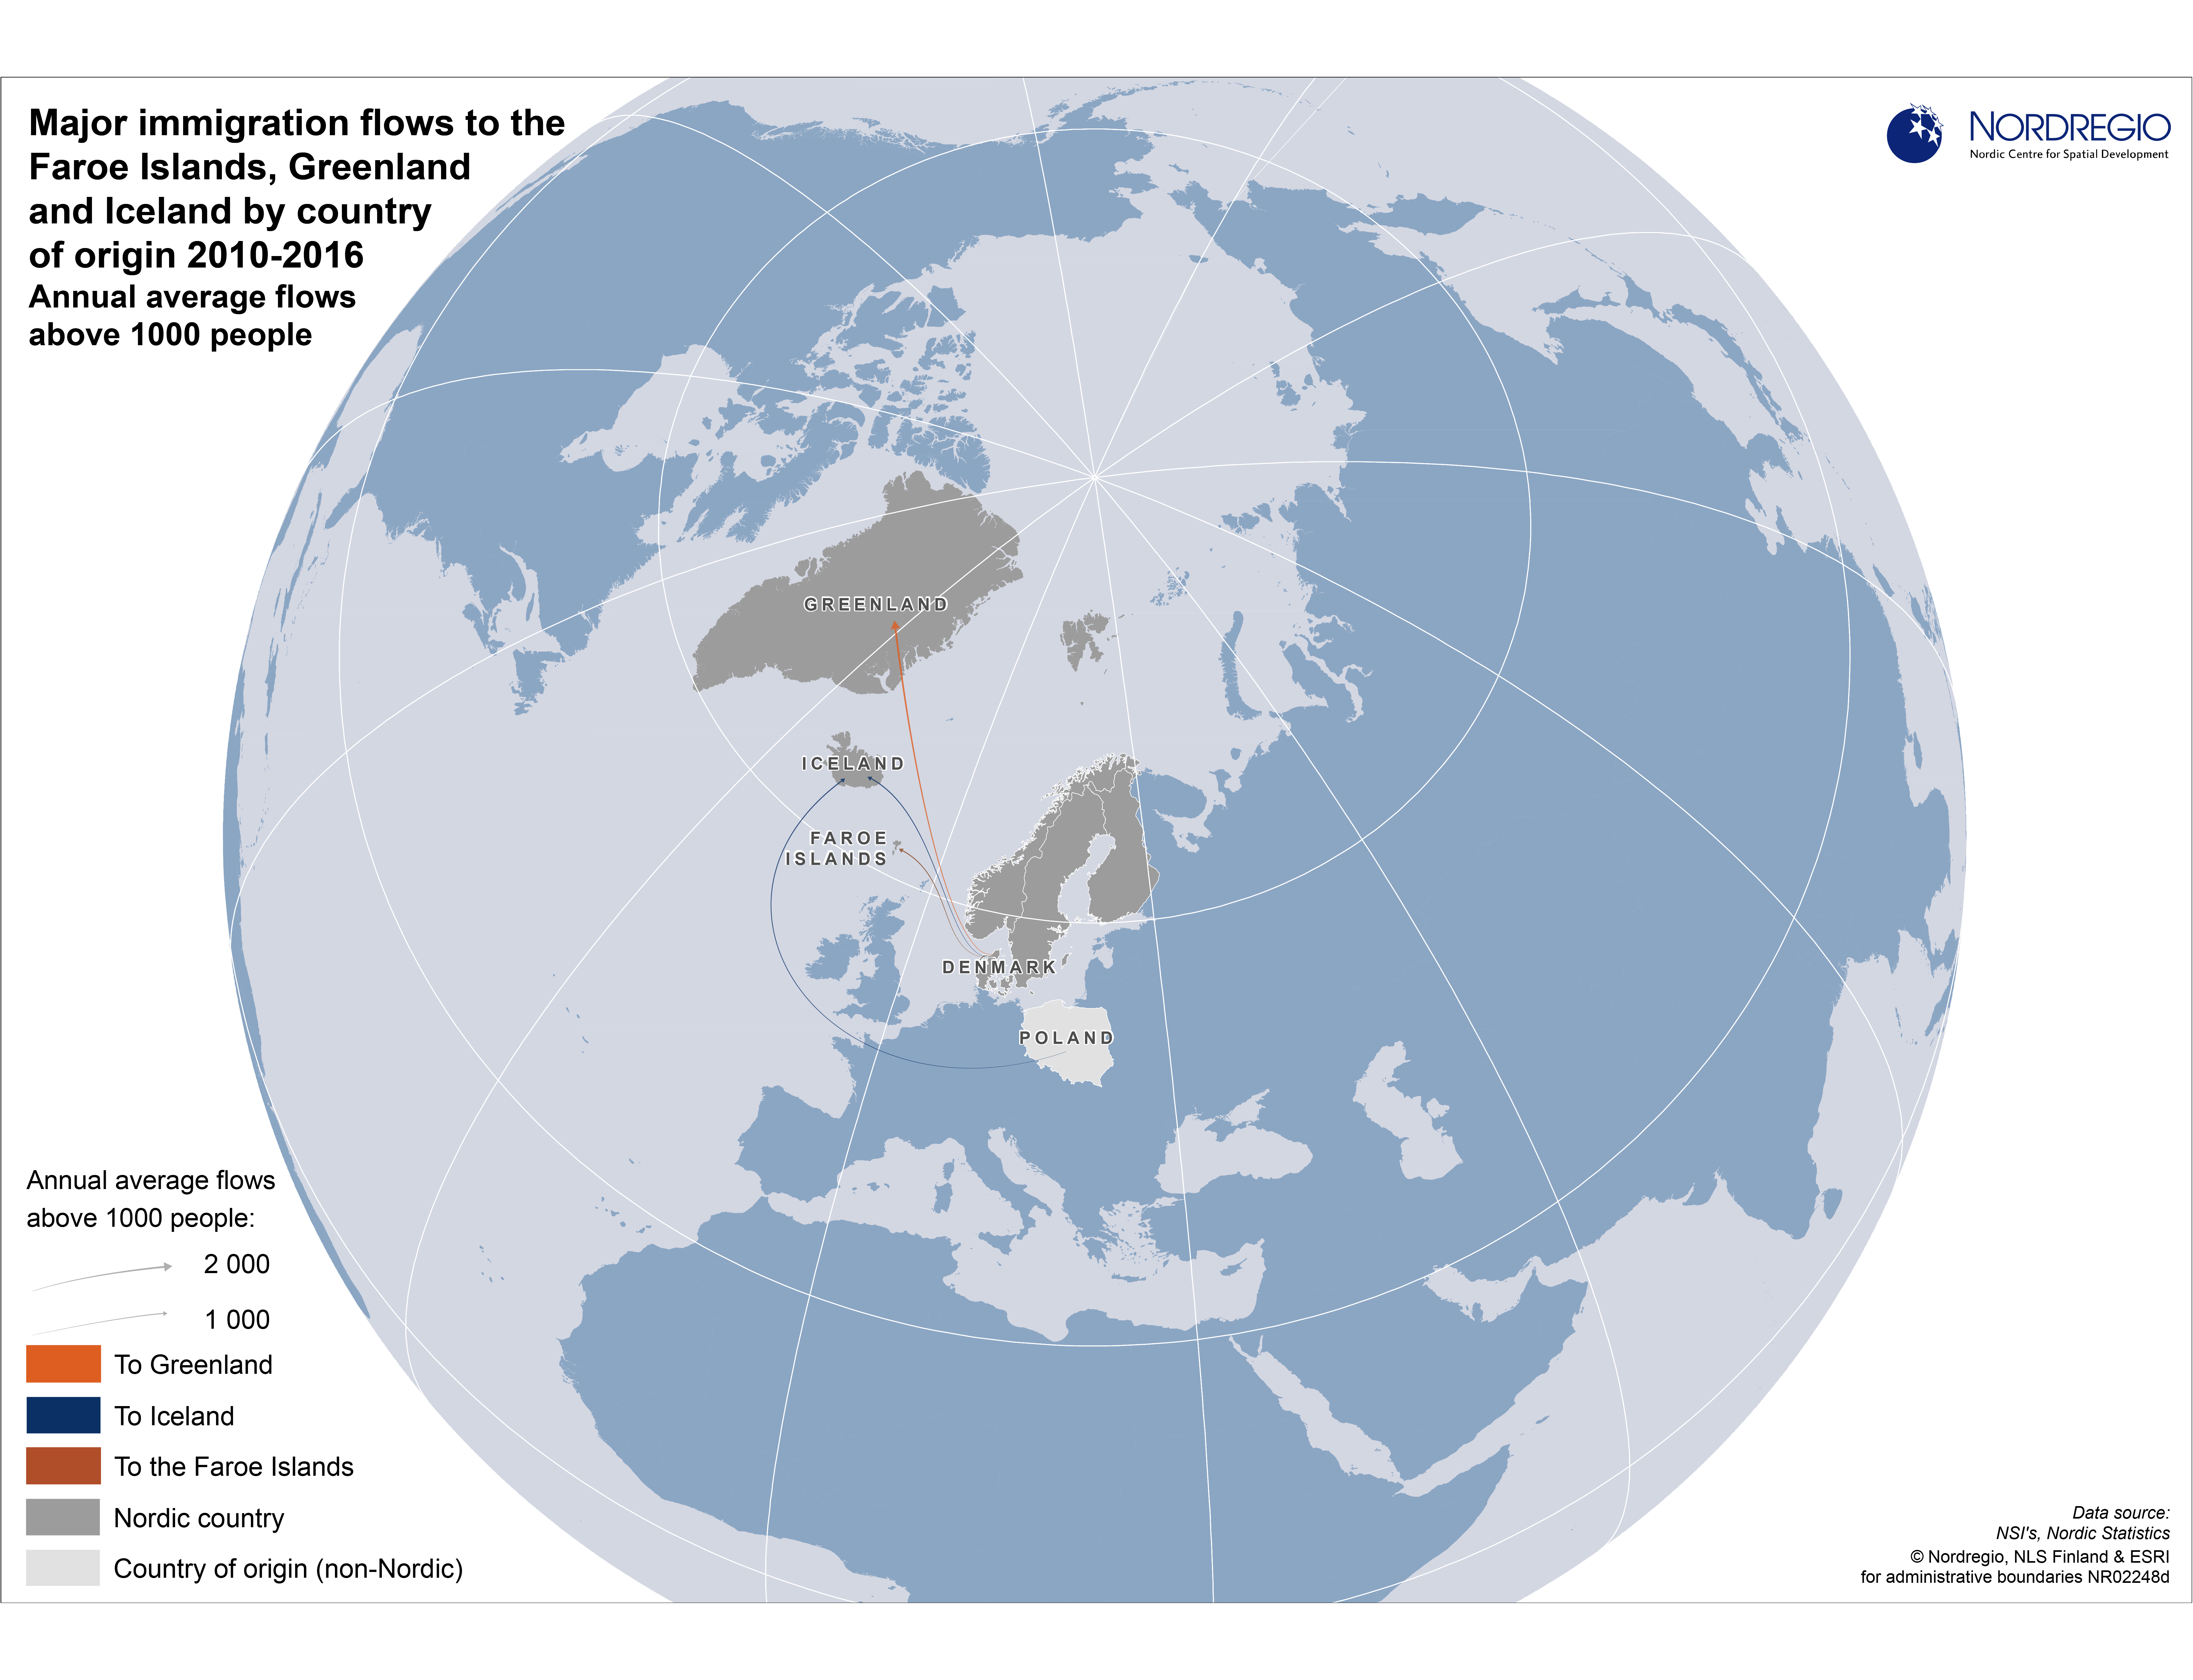
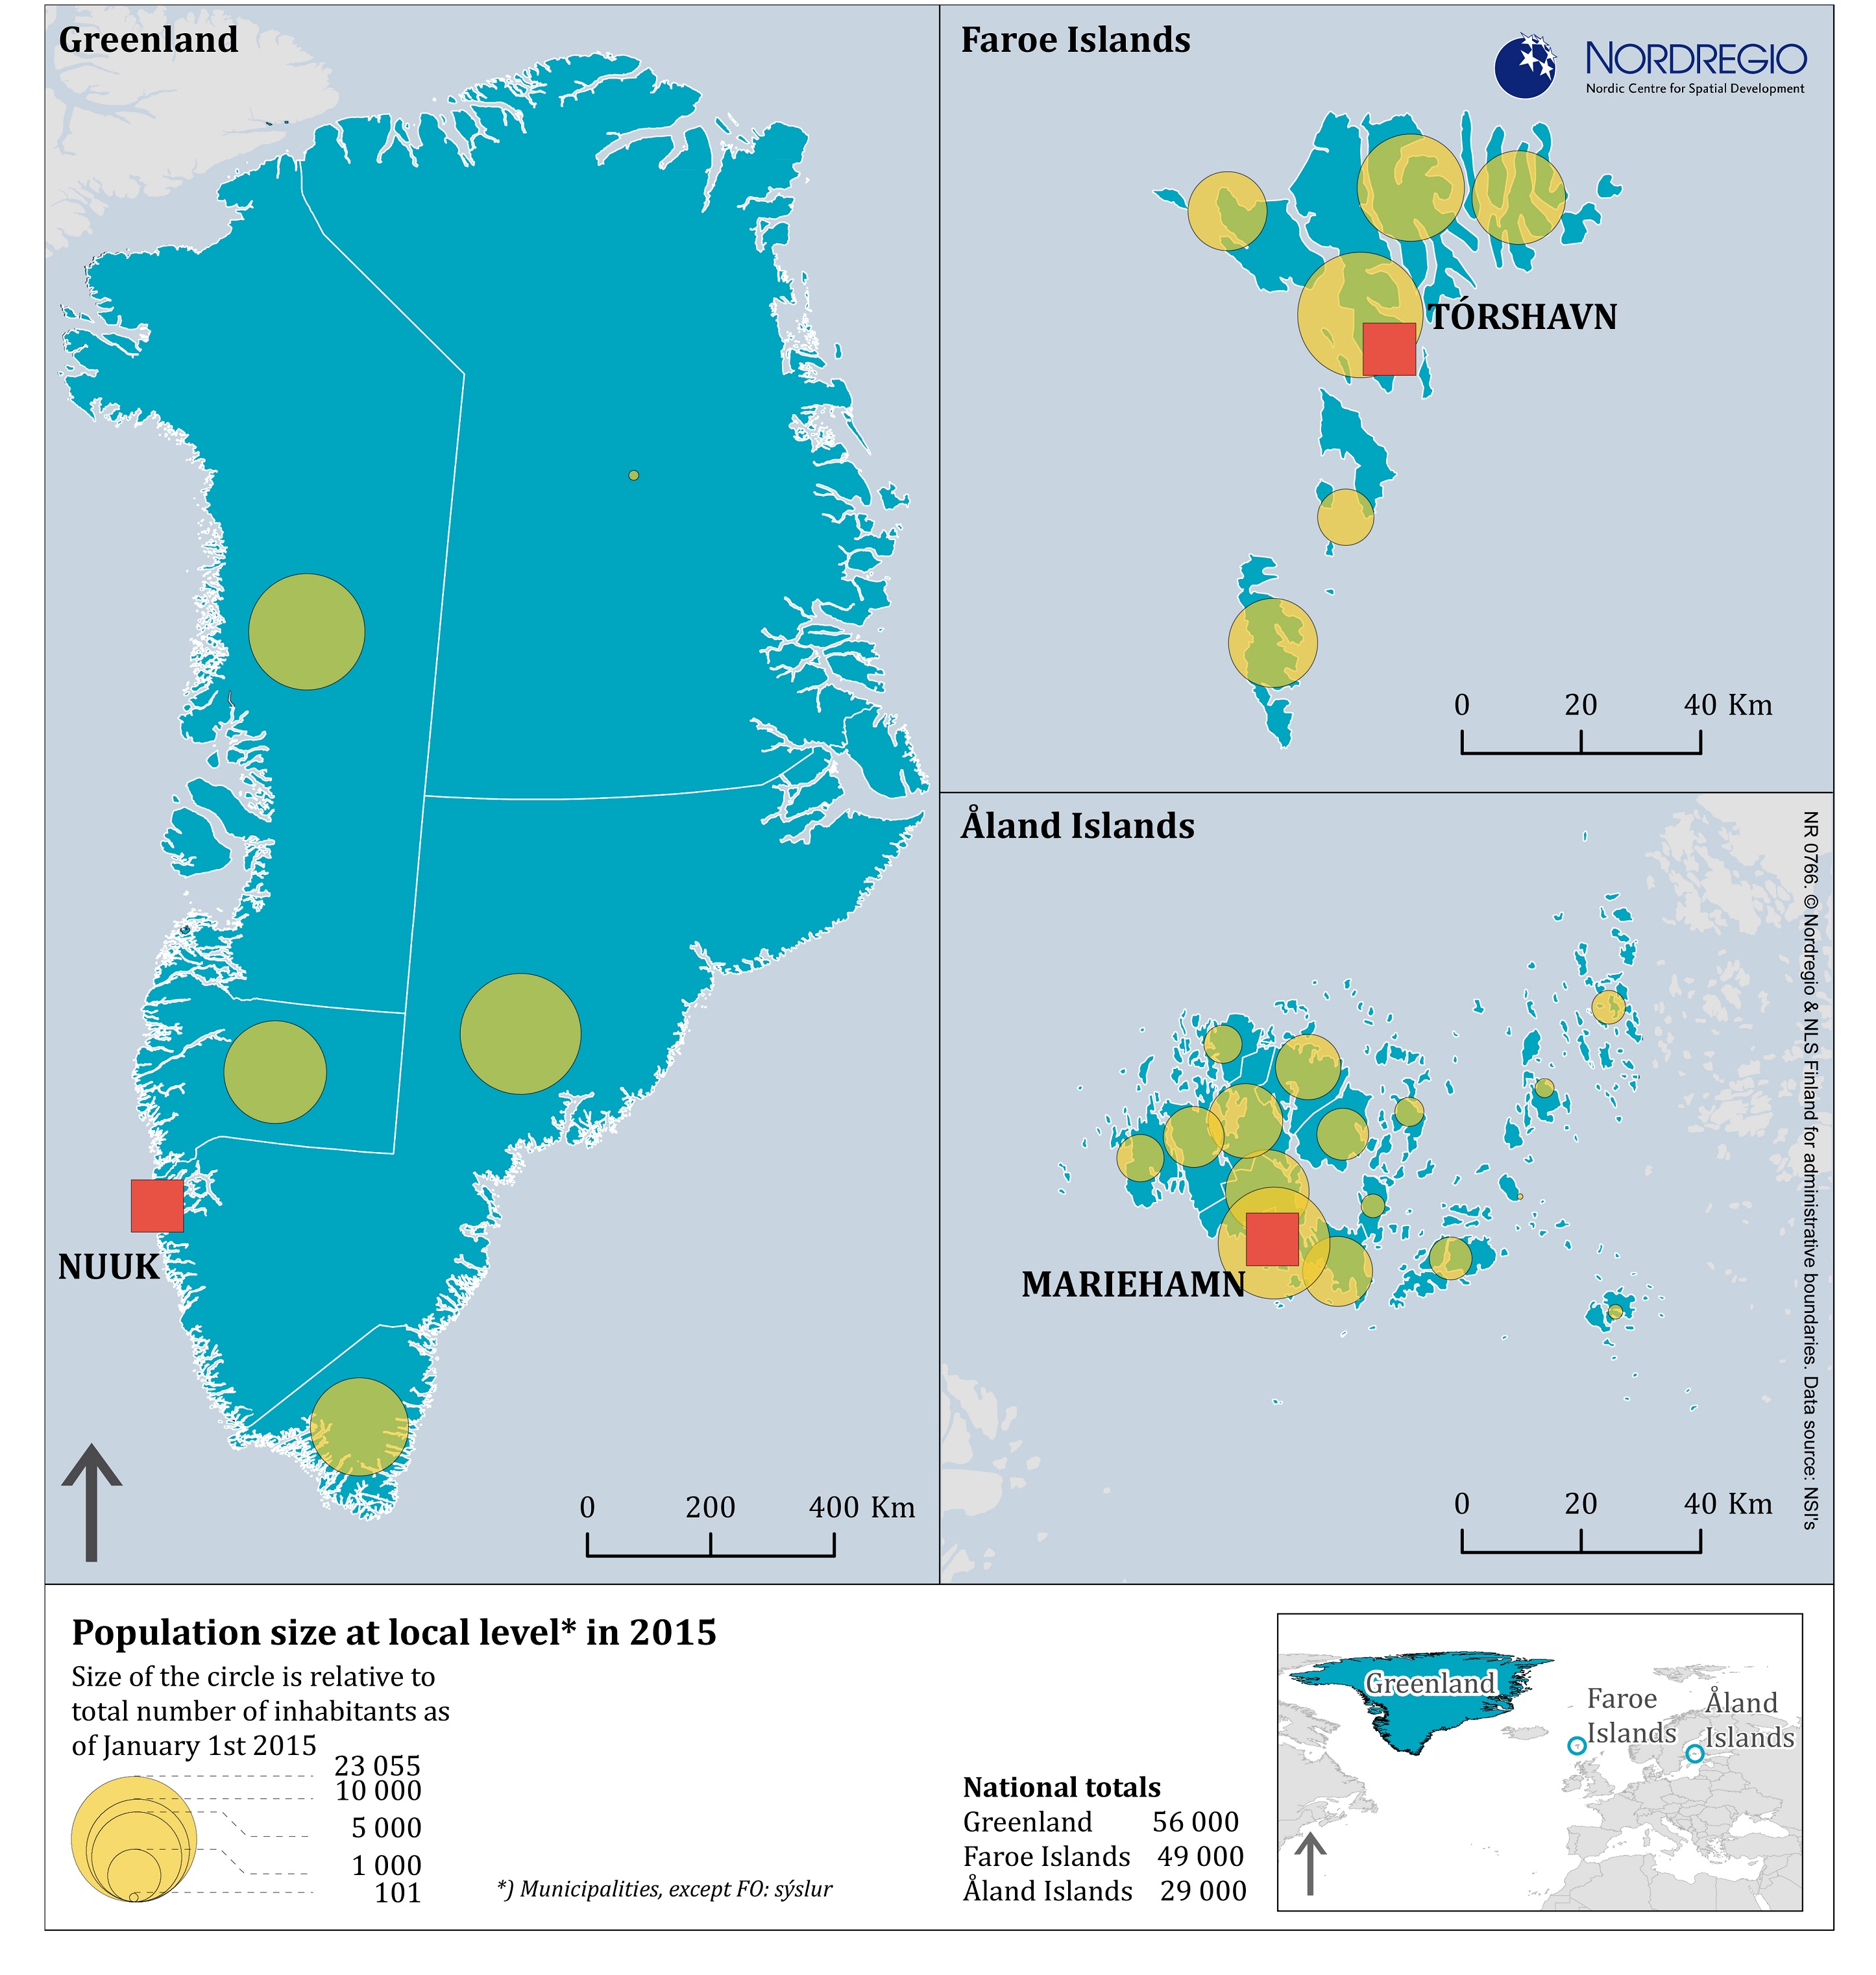
Major immigration flows to the Faroe Islands, Greenland and Iceland 2010-2016
Average annual flows above 1000 people by country of origin Migration flows by country of origin are of growing interest in the Nordic Region due to the recent unprecedented inflows of migrants. There are also interesting differences between the Nordic countries with respect to the dominant countries of origin of migrants and the size of inflows. The Faroe Islands and Greenland each had one average annual inflow greater than 1000 people during the measured period, in both cases from Denmark (around 2000 to Greenland and around 1000 to the Faroe Islands). Iceland had average annual inflows just above 1000 people from two countries, Denmark and Poland.
- 2017 June
- Demography
- Iceland
- Migration
- Nordic Region
- Other
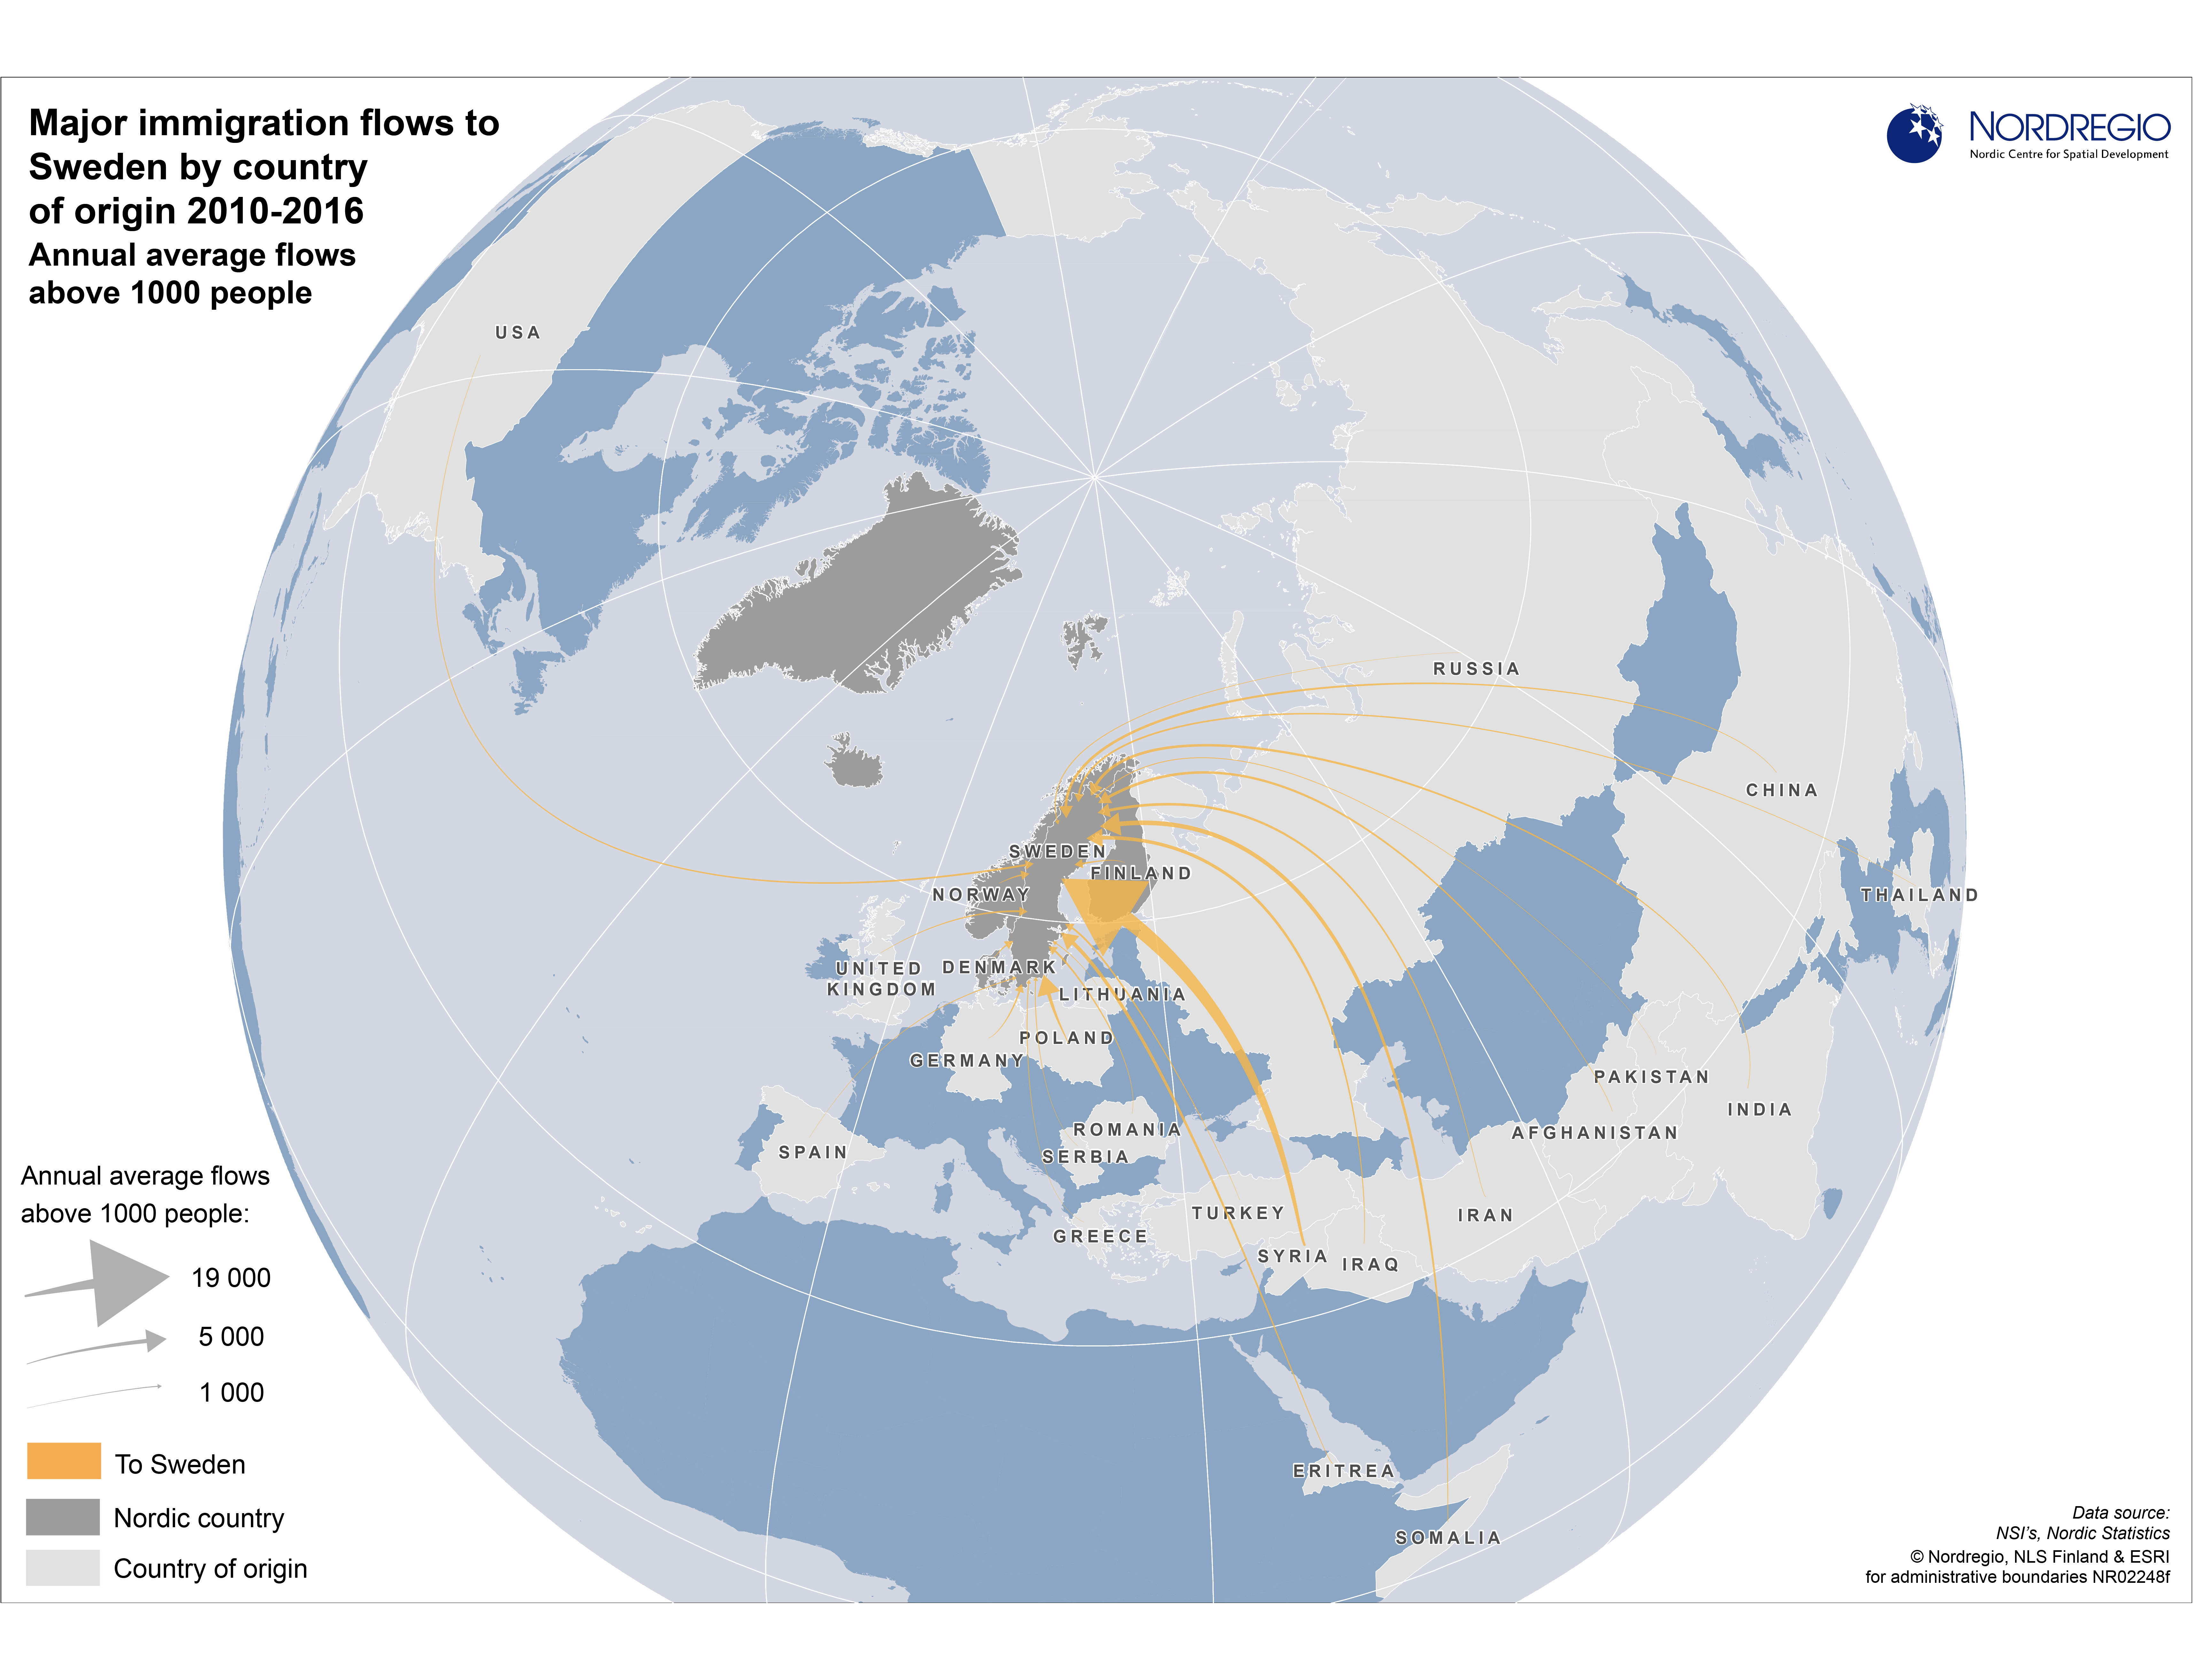
Major immigration flows to Sweden 2010-2016
Average annual flows above 1000 people by country of origin Migration flows by country of origin are of growing interest in the Nordic Region due to the recent unprecedented inflows of migrants. There are also interesting differences between the Nordic countries with respect to the dominant countries of origin of migrants and the size of inflows. During the measured period, Sweden had by far had the largest immigrant flows compared to of all the other Nordic countries – Denmark, Finland, Iceland and Norway. An annual average of nearly 19 000 immigrants came from Syria, around 5000 from both Somalia and Poland, about 4000 from Iraq and Eritrea, and circa 3000 each from Afghanistan, India, China and Iran. Many of the largest immigration flows to Sweden originated from countries in East Africa, the Middle-East, and mainland Asia. Alongside the large inflows from Poland, Sweden also experienced large inflows from its other European neighbours: Finland, Germany, Denmark and Norway (over 2000 people at the annual average).
- 2017 June
- Demography
- Migration
- Nordic Region
- Other

Major immigration flows to Norway 2010-2016
Average annual flows above 1000 people by country of origin Migration flows by country of origin are of growing interest in the Nordic Region due to the recent unprecedented inflows of migrants. There are also interesting differences between the Nordic countries with respect to the dominant countries of origin of migrants and the size of inflows. During the measured period, the largest average annual inflows to Norway were from nearby countries: Sweden, Lithuania, Denmark, and, most notably, Poland (annual average of almost 11 000 people). This specific pattern for Norway can largely be explained by the rich job opportunities that have existed in in the country over the past decade.
- 2017 June
- Demography
- Migration
- Nordic Region
- Other
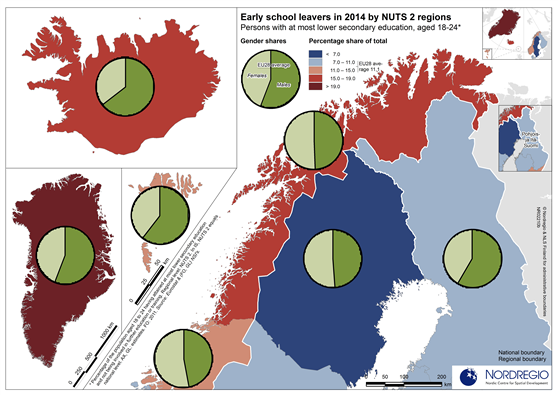
Early school leavers in 2014 by NUTS 2 regions
Persons with at most lower secondary education as share of total population aged 18-24 The map indicates variations within the Nordic countries with the lowest rates of early school leaving found in Swedish regions. In six of the eight Swedish NUTS 2 regions (riksområden) early school leavers make up less than seven percent of the population aged 18-24 years. Hovedstaden in Denmark is the only other Nordic region with a similar rate. In Finland (suuralue/storområde) and Norway (landsdel), variations between the NUTS 2 regions are bigger than in Sweden and Denmark. In the northernmost Finnish region, Pohjois- ja Itä-Suomi (North & East Finland), early school leavers make up a small portion of the population aged 18-24 years, below both the EU average (11.1%) and the two southernmost Finnish NUTS 2 regions. In the Faroe Islands, Iceland, Northern Norway, and, in particular, Greenland, the percentage of the population aged 18-24 years with lower-secondary school as their highest level of education is well above the EU average. With respect to gender, the balance is fairly even in northern Sweden and northern Norway. All other countries and regions included in the map show patterns consistent with the EU average, with males making up a larger portion of the early school leaving population.
- 2016 October
- Labour force
- NSPA and North Atlantic